
Currency
 Several weeks after Goldman’s chief technician started covering bitcoin, overnight Bank of America has released what some may call an “initiating coverage” report on bitcoin which notes that while the cryptocurrency remains very volatile and risky, bitcoin has experienced a spectacular surge in liquidity in the last six months. However, BofA remains stumped when it comes to making any official forecasts BofA’s commodity strategist Francisco Blanch writes that bitcoin is uncorrelated to any financial asset, “so there is no way to explain let alone predict returns.”
While we will present some of the more notable findings from the report shortly, one observation caught our attention, namely that in at least one regard, bitcoin has already surpassed gold: the total daily trading bolume for bitcoin has now surpassed that of the biggest gold ETF, the GLD.

“The trend in housing starts for Canada reached its highest level in almost five years”, said Bob Dugan, CMHC’s chief economist. “So far this year, all regions are on pace to surpass construction levels from 2016 except for British Columbia, where starts have declined year-to-date after reaching near-record levels last summer.” CMHC News Room
NOTE: The chart below shows the actual annual totals count from 1956 through 2016.
The 2017 data points on the chart are derived from the “annualized” provincial data set in the charts above and are therefor a projection of what year end 2017 might look like.
|
|
Projected Year End 2017 Totals
Canada = 190,424 (-4% Y/Y) ON = 74,310 (-1% Y/Y) QC = 35,100 (-9% Y/Y) BC = 39,131 (-7% Y/Y) AB = 25,423 (-4% Y/Y) |


 Last week, the S&P 500 price/revenue ratio reached the highest level in history, outside of the single week of March 24, 2000 that represented the peak of the tech bubble. Meanwhile, the 30-day CBOE volatility index (largely reflecting the level of fear or complacency among option traders) dropped to a record low, as bullish sentiment surged to 57.8% bulls versus 16.7% bears (Investors Intelligence), and the S&P 500 pushed to its upper Bollinger bands (two standard deviations above a 20-period moving average) on daily, weekly, and monthly resolutions.

Strengths
- The best performing precious metal for the week was silver, up 3.34 percent as investors loaded up on ETFs that purchase the physical metal, perhaps speculating that silver would outperform gold if the latter rallied. Gold traders and analysts remained bullish this week, for the fifth week, as the European Central Bank keeps its stimulus going, reports Bloomberg. In addition, as the dollar slumps amid an investigation into President Trump, gold heads for the first back-to-back weekly advance since early June, another Bloomberg article reads.
- Gold bulls are keeping their faith in the metal, reports Bloomberg, as the equity rally pares the yellow metal’s gains. Gold bulls have pointed to slow inflation and Fed concerns that asset prices look “somewhat rich.” Similarly, a Bank of America Merrill Lynch survey shows fund managers are growing hesitant to buy U.S. equities. Jason Mayer of Sprott Asset Management says that the non-stop bull market has led to a lot of complacency where managers aren’t hedging. “Once that tide turns, that could prove to be bullish for gold and precious metals,” Mayer said.
- After President Trump’s economic revitalization agenda once again faltered, the U.S. dollar fell to an 11-month low this week, reports Bloomberg. Opposition to Trump’s health-care reform bill, along with European shares dropping amid earnings disappointments, sent gold to its highest level this month.
Weaknesses
- The only negatively performing precious metal for the week was palladium, off 1.62 percent. Hedge funds and money managers seem to be losing their faith in gold, along with other precious metals, reports Bloomberg. Before posting its first weekly gain in six weeks, the net-long position in gold fell to the lowest in 17 months for the week ended July 11. Money managers are hitting the exit as they brace for monetary tightening in the U.S. and Western Europe, the article continues, and aren’t waiting around for signs that the Fed may change its rate trajectory.
- U.K. Royal Mint sales dropped in the second quarter by 62 percent compared with the previous three months, reports Bloomberg. Sales are down 41 percent from a year earlier. And according to data on the Swiss Federal Customs Administration’s website, Swiss gold exports declined 169.5 tons in May. Month-over-month exports to India also fell, but exports to China and Hong Kong both rose.
- Jaguar Mining previously had seen its 2017 gold production output at 100,000 ounces, but the company cut its forecast to 95,000-105,000 ounces, reports Bloomberg. Positive news, however, came after its decision to leave Turmalina at Level 9 and commence development and mining of Level 10 in Orebody A. Turmalina saw significantly stronger production in June versus April following this decision, the article continues.
Opportunities
- Scotia Mining Sales notes that as silver has gotten cheap again, particularly when looking at the widening gold-silver ratio, investors have been piling into silver ETFs (while dropping out of gold ETFs). Interestingly enough, there seems to be a bearish outlook in the futures market, where hedge funds are now holding the first net short silver position seen in two years, the group writes. The risk of higher U.S. interest rates should drive silver prices lower, is the reasoning behind this. However, if the Fed “blinks” and silver prices rebound, they will rebound quickly and violently, Scotia continues.

- Klondex Mines reported record, second-quarter operating results for its Nevada and Canadian operations this week, producing 66,629 gold equivalent ounces (GEOs), an increase of 94 percent from the first quarter. In the press release, the company also stated that it remains on track to meet its annual production guidance of 210,000 to 225,000 GEOs, up 36 percent from 2016. “As expected, the operating results for the second quarter were the best in the company’s history,” President and CEO Paul Huet said.
- Roxgold Inc. announced an updated mineral resource estimate (MRE) and complete drilling results from its first half Infill and Extension drilling program at the Bagassi South deposit. The Bagassi South deposit is located less than two kilometers from Roxgold’s flagship underground gold mine at the 55 Zone. According to a press release, highlights of the estimate are as follows: 1) Indicated MRE of 352,000 tonnes at 16.6 grams of gold per tonne (g/t Au) for 188,000 ounces and 2) Inferred MRE of 130,000 tonnes at 16.6 g/t Au for approximately 69,000 ounces of gold. In other company news, Columbus Gold Corp. announced its intention to spin out its mineral projects in the U.S. into a separate publicly traded company to be named Allegiant Gold Ltd. The plan of arrangement would see shareholders of Columbus receive one share of Allegiant for every five shares of Columbus. This should unlock the value for their North American assets.
Threats
- As Global Mining Research points out in a note this week, over the last few years there have been a number of companies that haven’t mined to their Life of Mine (LOM) plans. In particular, stripping requirements haven’t been met. One of the most well-known examples of this recently is Detour Gold, the research group points out, but clarifies that it certainly not the only one. Deferring the waste removal puts the company at risk for greater waste removal requirements in the future, which is obviously not a source of revenue.
- Due to Goldcorp’s failure to properly consult with affected indigenous peoples on its proposed Coffee Gold project, the Yukon Socio-Economic Assessment Board decided to stop its assessment of the project, reports Seeking Alpha. This means the project’s timeline could be in jeopardy, along with costs associated with the project. This decision points to deeper troubles at Goldcorp in relation to the company’s Canadian operations, the article continues.
- Special Counsel Robert Mueller is taking a wide-angle approach to his probe regarding President Donald Trump’s campaign and Russia in last year’s election. He is now looking into other Trump business transactions, despite the President’s caution not to do so. “The roots of Mueller’s follow-the-money investigation lie in a wide-ranging money laundering probe launched by then-Manhattan U.S. Attorney Preet Bharara last year,” the Bloomberg article reads.
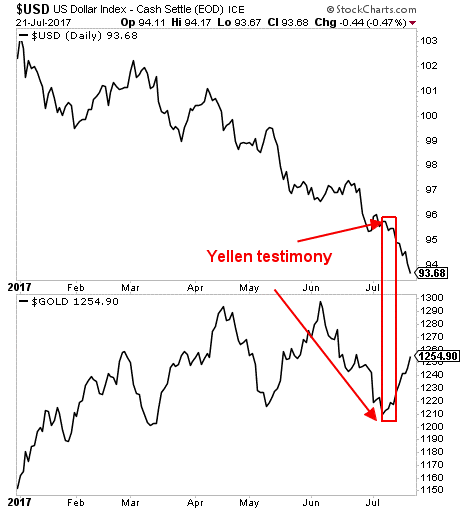
Janet Yellen has confirmed that the US Dollar is going to collapse.
I don’t mean a systemic, going to zero, collapse (though one day the $USD, like all fiat currencies will fail). I mean that the $USD is going to drop hard in the coming 18+ months.
How hard?
I believe we’ll see the $USD in the 80s sometime in 2018. That’s a full 11% lower from where the $USD is today. Put simply, the entire move in the greenback that was driven by the Fed ending QE will be unwound.

How do we know this?
Janet Yellen’s testimony to Congress earlier this month was a clear signal.
First, a little context…
For months now, numerous Fed officials have been publicly stating that the Fed was embarking on a significant tightening schedule.
This has been one of the most coordinated and clear Fed PR campaigns in recent history with numerous Fed officials calling for 3-4 rate hikes in 2017 as well as Fed balance sheet shrinking.
Then on Tuesday and Wednesday July 11th and 12th respectively, Fed Chair Janet Yellen testified in front of Congress that the Fed is just about done with tightening. Moreover, she stated that the Fed WOULDN’T use its balance sheet normalization as a monetary policy (indicating that it won’t use it to drain liquidity from the system).
The $USD, which was already trending downward in spite of the Fed’s previous hawkishness, promptly collapsed. And Gold erupted higher.
It’s time to get moving into inflation plays.
If you’re not taking steps to actively prepare your portfolio for this, you need to so now.
Graham Summers
Chief Market Strategist


-
I know Mike is a very solid investor and respect his opinions very much. So if he says pay attention to this or that - I will.
~ Dale G.
-
I've started managing my own investments so view Michael's site as a one-stop shop from which to get information and perspectives.
~ Dave E.
-
Michael offers easy reading, honest, common sense information that anyone can use in a practical manner.
~ der_al.
-
A sane voice in a scrambled investment world.
~ Ed R.
Inside Edge Pro Contributors

Greg Weldon

Josef Schachter

Tyler Bollhorn

Ryan Irvine

Paul Beattie

Martin Straith

Patrick Ceresna

Mark Leibovit

James Thorne

Victor Adair