
Gold & Precious Metals
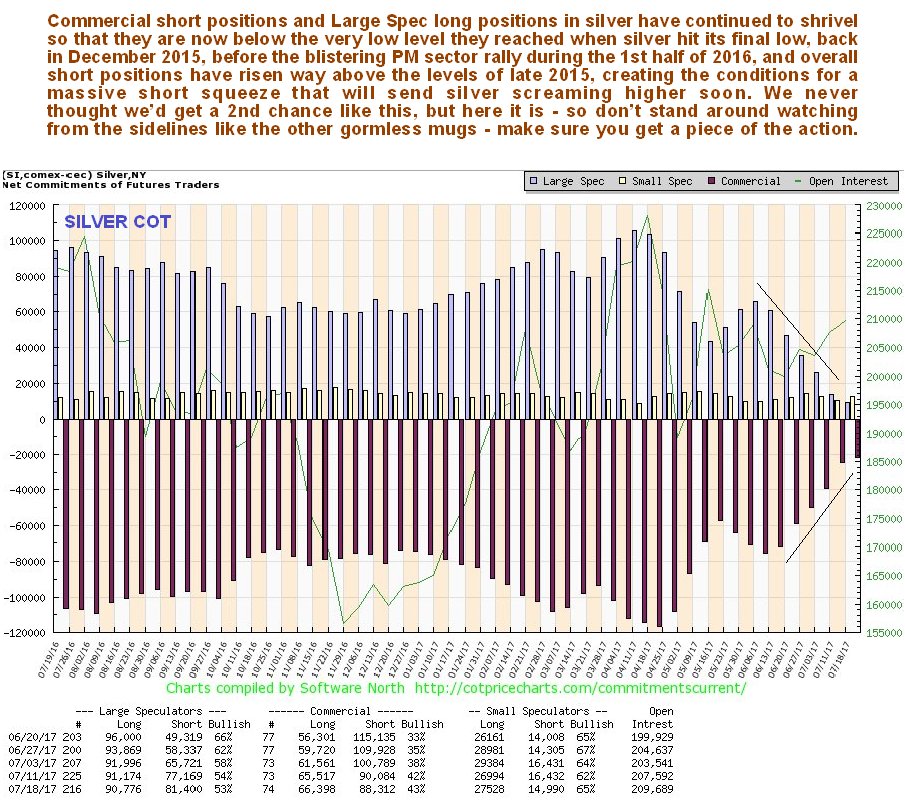
There will be no equivocating, fence sitting or any kind of hedging or expression of doubt in what is written in this update. Let me be absolutely clear: – we are now at the threshold of a barnburner rally in the Precious Metals sector, and silver is set to scream higher driven by a massive short covering panic, because short positions in it have ballooned in recent weeks to levels way above what we saw in December 2015, when silver hit its final bearmarket bottom, before the big sector rally during the 1st half of 2016.
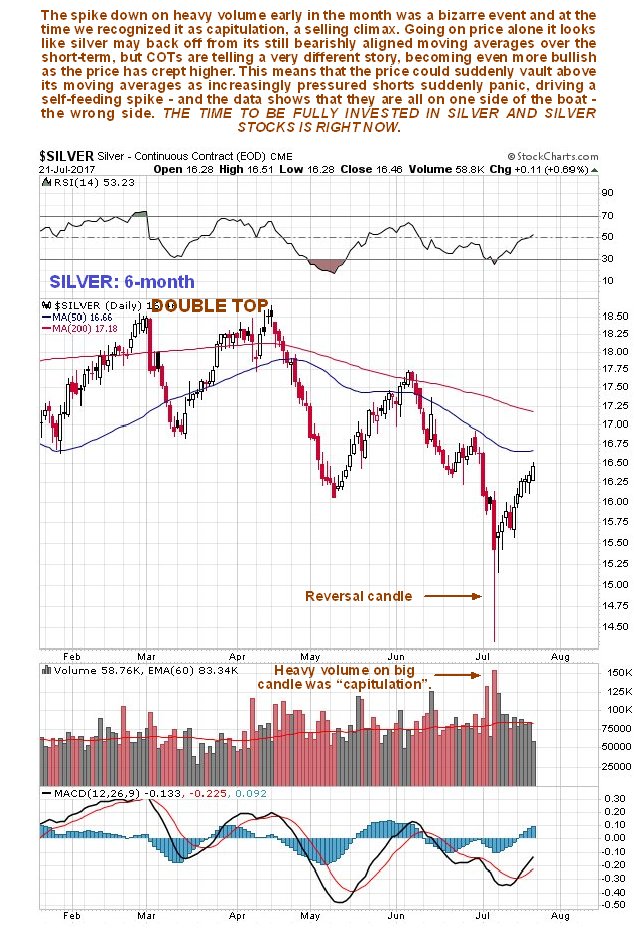
We have been on to this for some time, hence the rash of articles over the past couple of weeks on the site recommending various good looking gold and silver stocks, and we will look at more this weekend. This is truly a massive opportunity, but these low prices are not going to be around for much longer. So if you want to fully partake of this rally and buy at the current crazy cheap prices, and haven’t done so yet, you had better pull your finger out and get on with it, because this market is not going to wait on your convenience. Don’t be fooled into thinking that because silver has rallied towards still bearishly aligned moving averages over the past week or so that it must drop back towards its lows again. That huge candle early this month on big volume which we can see on the 6-month chart below was a final capitulation reversal candle – a bottom. While the price has since been edging higher, the COT has continued to improve to the point that it is even more extremely bullish, so we can expect this so far hesitant rally to gain serious traction soon. Even if we do see a dip, which is considered highly unlikely, it would simply make the picture even more positive, although it is now scarcely possible that it can look much more positive than it is already.
Click on chart to popup a larger, clearer version.
The latest silver COT chart shows that Commercial short and Large Spec long positions have fallen even further over the past week, despite the price having risen somewhat. These are now at even lower levels than we saw at the December 2015 bottom. Gold’s are about the same as last week and very bullish too, and for good measure we are just entering the most bullish time of year for the Precious Metals. So there it is – a massive opportunity staring you in the face, of the sort we haven’t seen since late 2015, and before that for many years. Look out for more stock write-ups over the weekend. Remember that most stocks in the sector are like sheep – they all move together, that’s why when we buy them, we storm in and buy across the board if we see a major opportunity present itself, as it’s doing right now, since there’s no point in chasing them higher if we don’t have to.

Yellen Overshoots
ECB Runs Out of Bullets
Chinese Debt Meltdown
Too Many Planes; Grand Lake Stream, Maine; Colorado; and Portugal
“The world in which we live has an increasing number of feedback loops, causing events to be the cause of more events (say, people buy a book because other people bought it), thus generating snowballs and arbitrary and unpredictable planet-wide winner-take-all effects.”
– Nassim Nicholas Taleb, The Black Swan

“What do you do?” is a common question Americans ask people they have just met. Some people outside the US consider this rude – as if our jobs define who we are. Not true, of course, but we still feel obliged to answer the question.
My work involves so many different things that it isn’t easy to describe. My usual quick answer is that I’m a writer. My readers might say instead: “He tells people what could go wrong.” I like to think of myself as an optimist, and I do often write about my generally optimistic view of the future, but that optimism doesn’t often extend to the performance of governments and central banks. Frankly, we all face economic and financial risks, and we all need to prepare for them. Knowing the risks is the first step toward preparing.
Exactly 10 years ago we were months way from a world-shaking financial crisis. By late 2006 we had an inverted yield curve steep and persistent enough to be a high-probability indicator of recession 12 months later. So in late 2006 I was writing about the probability that we would have a recession in 2007. I was also writing about the heavy leverage in the banking system, the ridiculous level of high-yield offerings, the terms and potential turmoil in the bond and banking markets, and the crisis brewing in the subprime market. I wish I had had the money then that a few friends did to massively leverage a short position on the subprime market. I estimated at that time that the losses would be $400 billion at a minimum, whereupon a whole lot of readers and fellow analysts told me I was just way too bearish.
Turned out the losses topped well over $2 trillion and triggered the financial crisis and Great Recession. Conditions in the financial markets needed only a spark from the subprime crisis to start a firestorm all over the world. Plenty of things were waiting to go wrong, and it seemed like they all did at the same time. Governments and central bankers scrambled hard to quench the inferno. Looking back, I wish they had done some things differently, but in the heat of battle – a battle these particular people had never faced before, with more going wrong every day – it was hard to be philosophically pure.
(Sidebar: I think the Fed’s true mistakes were QE2, QE3, and missing their chance to start raising rates in 2013. By then, they had time to more carefully consider those decisions.)
We don’t have an inverted yield curve now, so the only truly reliable predictor of recessions in the US is not sounding that warning. But when the central bank artificially holds down short-term rates, it is difficult if not almost impossible for the yield curve to invert.
We have effectively suppressed that warning signal, but I am laser focused on factors that could readily trigger a global recession, resulting in another global financial crisis. All is not well in the markets. Yes, we see stock benchmarks pushing to new highs and bond yields at record lows. Inflation benchmarks are stable. Unemployment is low and going lower. GDP growth is slow, but it’s still growth. All that says we shouldn’t worry. Perversely, the signs that we shouldn’t worry are also reasons why we should.
This is a classic Minsky teaching moment: Stability breeds instability.
I know the bullish arguments for why we can’t have another crisis. Banks are better capitalized now. Regulators are watching more intently. Bondholders are on notice not to expect more bailouts. All that’s true.
On the other hand, today’s global megabanks are much larger than their 2008 versions were, and they are more interconnected. Most Americans – the 80% I’ve called the Unprotected – are still licking their wounds from the last battle. Many are in worse shape now than in 2008. Our crisis-fighting reserves are low.
European banks are still highly leveraged. The shadow banking system in China has grown to scary proportions.
Globalization has proceeded apace since 2008, and the world is even more interconnected now. Problems in faraway markets can quickly become problems close to home. And that’s without a global trade war.
I am concerned that another major crisis will ensue by the end of 2018 – though it is possible that a salutary combination of events, aided by complacency, could let us muddle through for another few years. But there is another recession in our future (there is always another recession), and it’s going to be at least as bad as the last one was, in terms of the global pain it causes. The recovery is going to take much longer than the current one has, because our massive debt build-up is a huge drag on growth. I hope I’m wrong. But I would rather write these words now and risk eating them in my 2020 year-end letter than leave you unwarned and unprepared.
Because I’m traveling this week, this letter will be just a few appetizers –black swan hot wings, black swan meatballs in orange sauce, teriyaki swan skewers, and the like – to whet your appetite and help you anticipate what’s coming.
Seriously speaking, could the three scenarios we discuss below turn out be fateful black swans? Yes. But remember this: A harmless white swan can look black in the right lighting conditions. Sometimes that’s all it takes to start a panic.
Black Swan #1: Yellen Overshoots
It is increasingly evident, at least to me, that the US economy is not taking off like the rocket some predicted after the election. President Trump and the Republicans haven’t been able to pass any of the fiscal stimulus measures we hoped to see. Banks and energy companies are getting some regulatory relief, and that helps; but it’s a far cry from the sweeping healthcare reform, tax cuts, and infrastructure spending we were promised. Though serious, major tax reform could postpone a US recession to well beyond 2020, what we are going to get instead is tinkering around the edges.
On the bright side, unemployment has fallen further, and discouraged workers are re-entering the labor force. But consumer spending is still weak, so people may be less confident than the sentiment surveys suggest. Inflation has perked up in certain segments like healthcare and housing, but otherwise it’s still low to nonexistent.
Is this, by any stretch of the imagination, the kind of economy in which the Federal Reserve should be tightening monetary policy? No – yet the Fed is doing so, partly because they waited too long to end QE and to begin reducing their balance sheet. FOMC members know they are behind the curve, and they want to pay lip service to doing something before their terms end. Moreover, Janet Yellen, Stanley Fischer, and the other FOMC members are religiously devoted to the Phillips curve. That theory says unemployment this low will create wage-inflation pressure. That no one can see this pressure mounting seems not to matter: It exists in theory and therefore must be countered.
The attitude among central bankers, who are basically all Keynesians, is that messy reality should not impinge on elegant theory. You just have to glance at the math to recognize the brilliance of the Phillips curve!
It was Winston Churchill who said, “However beautiful the strategy, you should occasionally look at the results.” Fact is, the lack of wage growth among the bottom 70–80% of workers (the Unprotected class) constitutes a real weaknesses in the US economy. If you are a service worker, competition for your job has kept wages down.
The black-swan risk here is that the Fed will tighten too much, too soon. We know from recent FOMC minutes that some members have turned hawkish in part because they wanted to offset expected fiscal stimulus from the incoming administration. That stimulus has not been forthcoming, but the FOMC is still acting as if it will be.
What happens when the Fed raises interest rates in the early, uncertain stages of a recession instead of lowering them? I’m not sure we have any historical examples to review. Logic suggests the Fed will extinguish any inflation pressure that exists and push the economy in the opposite direction instead, into outright deflation.
Deflation in an economy as debt-burdened as ours is could be catastrophic. We would have to repay debt with cash that is gaining purchasing power instead of losing it to inflation. Americans have not seen this happen since the 1930s. It wasn’t fun then, and it would be even less fun now.
Worse, I doubt Trump’s FOMC appointees will make a difference. Trump appears to be far more interested in reducing the Fed’s regulatory role than he is in tweaking its monetary policies. I have no confidence that Yellen’s successor, whoever that turns out to be, will know what needs to be done or be able to do it fast enough.
Let me make an uncomfortable prediction: I think the Trump Fed – and since Trump will appoint at least six members of the FOMC in the coming year, it will be his Fed – will take us back down the path of massive quantitative easing and perhaps even to negative rates if we enter a recession. The urge to “do something,” or at least be seen as trying to do something, is just going to be too strong.
Black Swan #2: ECB Runs Out of Bullets
Last week, news reports said that the Greek government is preparing to issue new bonds for the first time in three years. “Issue bonds” is a polite way of saying “borrow more money,” something many bond investors think Greece is not yet ready to do.
Their opinions matter less than ECB chief Mario Draghi’s. Draghi is working hard to buy every kind of European paper except that of Greece. Adding Greece to the ECB bond purchases program would certainly help.
Relative to the size of the Eurozone economy, Draghi’s stimulus has been far more aggressive then the Fed’s QE. It has pushed both deeper, with negative interest rates, and wider, by including corporate bonds. If you are a major corporation in the Eurozone and the ECB hasn’t loaned you any money or bought your bonds yet, just wait. Small businesses, on the other hand, are being starved.
Such interventions rarely end well, but admittedly this one is faring better than most. Europe’s economy is recovering, at least on the surface, as the various populist movements and bank crises fade from view. But are these threats gone or just glossed over? The Brexit negotiations could also throw a wrench in the works.
Despite recent predictions by ECB watchers and the euro’s huge move up against the dollar on Friday, Anatole Kaletsky at Gavekal thinks Draghi is still far from reversing course. He expects that the first tightening steps won’t happen until 2018 and anticipates continued bond buying (at a slower pace) and near-zero rates for a long time after. But he also sees risk. Anatole explained in a recent report:
Firstly, Fed tapering occurred at a time when Europe and Japan were gearing up to expand monetary stimulus. But when the ECB tapers there won’t be another major central bank preparing a massive balance sheet expansion. It could still turn out, therefore, that the post-crisis recovery in economic activity and the appreciation of asset values was dependent on ever-larger doses of global monetary stimulus. If so, the prophets of doom were only wrong in that they overstated the importance of the Fed’s balance sheet, compared with the balance sheets of the ECB and Bank of Japan.
This is a genuine risk, and an analytical prediction about the future on which reasonable people can differ, unlike the factual observations above regarding the revealed behavior of the ECB, the Franco-German rapprochement and the historical experience of Fed tapering.
Secondly, it is likely that the euro will rise further against the US dollar if the ECB begins to taper and exits negative interest rates. A stronger euro will at some point become an obstacle to further gains in European equity indexes, which are dominated by export stocks.
Anatole makes an important point. The US’s tapering and now tightening coincided with the ECB’s and BOJ’s both opening their spigots. That meant worldwide liquidity was still ample. I don’t see the Fed returning that favor. Draghi and later Kuroda will have to normalize without a Fed backstop – and that may not work so well.
Black Swan #3: Chinese Debt Meltdown
China is by all appearances unstoppable. GDP growth has slowed down to 6.9%, according to official numbers. The numbers are likely inflated, but the boom is still underway. Reasonable estimates from knowledgeable observers still have China growing at 4–5%, which, given China’s size, is rather remarkable. The problem lies in the debt fueling the growth.
Ambrose Evans-Pritchard reported some shocking numbers in his July 17 Telegraph column. A report from the People’s Bank of China showed off-balance-sheet lending far higher than previously thought and accelerating quickly. (Interestingly, the Chinese have made all of this quite public. And President Xi has taken control of publicizing it.)
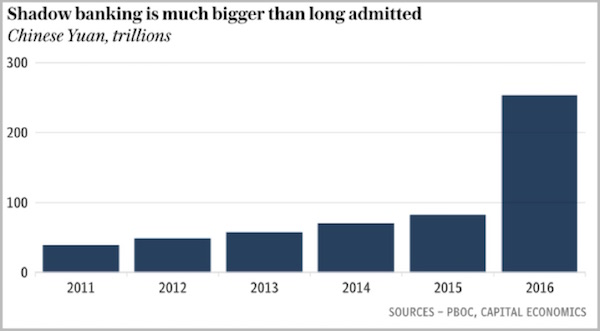
The huge increase last year probably reflects efforts to jump-start growth following the 2015 downturn. Banks poured fuel on the fire, because letting it go out would have been even worse. But they can’t stoke that blaze indefinitely.
President Xi Jinping has been trying to dial back credit growth in the state-owned banks for some time; but in the shadow banks that Xi doesn’t control, credit is growing at an astoundingly high rate, far offsetting any minor cutbacks that Xi has made.
Here are a few more juicy quotes from Ambrose:
President Xi Jinping called for a hard-headed campaign to curb systemic risk and to flush out “zombie companies”, warning over the weekend that financial stability was a matter of urgent national security.
It is the first time that a Chinese leader has chaired the National Finance Work Conference – held every five years to thrash out long-term plans – and is a sign of rising concern as debt reaches 280pc of GDP.
In a move that will send shivers up the spines of local party officials, he said they will be held accountable for the rest of their lives for debts that go wrong. Any failure to identify and tackle risks will be deemed “malfeasance”.
Ambrose then quotes Patrick Chovanec of Silvercrest Asset Management:
“The banks have been selling products saying it isn’t our risk. Investors have been buying them saying it’s not our risk either. They all think the government will save everything. So what the markets are pricing is what they think is political risk, not economic risk,” he said.
A market in which “they all think the government will save everything” is generally not one you want to own – but China has been an exception. It won’t remain one forever. The collapse, when it comes, could be earthshaking.
Chinese growth has been fueled by a near doubling of both GDP and debt over the last nine years:
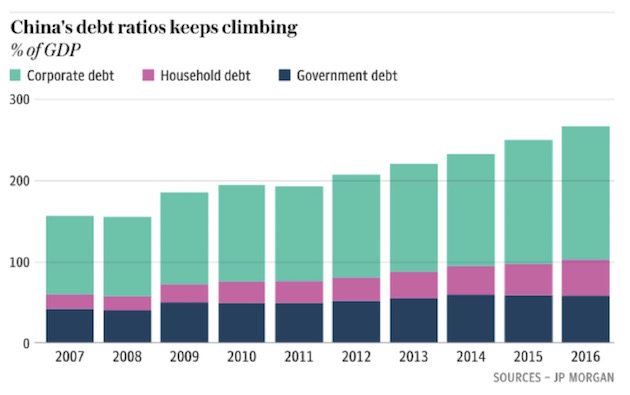
One reason why so many people are complacent about China is that they truly believe that “this time is different” applies to Chinese debt. Maybe in 10 years I will look back and say that it really was different, but I don’t think so. As is often the case with China, China’s current circumstances are without a true equal in the history of the world.
And if Xi is really serious about slowing the pace of growth (another form of tightening by a major world economy), that move would just add to overall global risk.
It is very possible that any of these black swans could trigger a recession in the US. And let’s be clear: The next US recession will be part of a major global recession and will result in massive new government debt build-up. It will not end well.
Let me remind you again that we’re hosting another webinar with my friend Marc Chaikin of Chaikin Analytics, on July 25, at 4:15 PM EST.
I’ve long been a fan of the Chaikin Analytics Power Gauge, so last year I told my team of analysts to try it out. A few weeks later they came back to me and said, “It’s great, we’re using it for everything!”
Because we’re so impressed with the Power Gauge system, we’d like to give you the chance to access it, too. You can click here for the free webinar “The Ultimate Stock Checklist & Best Small-Cap Stocks to Buy Today.”
Too Many Planes; Grand Lake Stream, Maine; Colorado; and Portugal
I will have to get on a few planes for one-day meetings this week. In two weeks I will be off to the annual Maine fishing trip, then back home for a few weeks until Shane and I head to the Colorado Rockies (Beaver Creek, actually) for an end-of-summer vacation. In late September we will fly to Lisbon, Portugal, for a series of presentations and meetings. I am really looking forward to going, as it is one of the last countries in Western Europe that I have never visited. (One weekend when I’m in Europe, I am simply going to get on the train and do lunch on Sunday in Luxembourg, then turn around and head right back, just so I can check that spot off on my map.)
I’m in Las Vegas now, speaking at Freedom Fest, but even more importantly meeting with friends. I find it hugely rewarding to be with George Gilder. David Brin arrives today. Steve Forbes is here, and many of us will be celebrating his 70th birthday tonight. I will be debating with Louis Navellier, Keith Fitzgerald, and Peter Schiff on the direction of the markets.
If you are interested in how I am approaching the markets, you can access a special report at my investment advisory website, MauldinSolutions.com, by giving us a few details about yourself. See what I think is the best way to approach markets today, using a variety of trading strategies rather than trying merely to diversify among asset classes. In a recession where all correlations go to one, diversifying your assets will just diversify your losses. That’s the outcome we want to avoid.
You have a great week and take some time to call or better yet meet with friends.
Your trying not to worry too much this summer analyst,

John Mauldin
subscribers@MauldinEconomics.com
 Three months ago (April) we covered the reasons we primarily invest in junior exploration companies. We promised to follow up with some criteria we follow in attempting to pick winners. Here are five things we look for when evaluating and selecting junior exploration companies.
Management has a track record and experience.
There is a decent number of executives in the junior industry that were part of or led a company to an acquisition. If they have done it before then they know what needs to be done in order to do it again. If management has not been involved in a transaction, check to see if they have discovered a deposit or expanded a resource through drilling. Also, seek out the executives that had ample experience at a major company.
Do not stop with the CEO. Also consider the track record and experience of the chief geologist. They are just as important.
Strong capital structure and a small retail float
The capital structure refers to the cash, shares outstanding and warrants and options. We are looking for companies with cash, tight share structures and tight floats. That means enough cash to move forward (without needing to raise multiple times) a low number of warrants and options and a small retail float.
The float is the number of shares available for trading after subtracting closely held shares. The smaller the retail float, the more amount of stock is tightly held (by insiders, institutions and large investors). Stocks with tighter retail floats can rise more quickly than stocks with larger retail floats. It’s basic supply and demand and the size of the retail float is just as important as the overall structure itself.
Industry sponsorship
Juniors can have industry sponsorship through joint ventures or investment. Has a major gold mining company invested in the junior or partnered with the junior on its project? That would certainly lend quite a bit of credibility to the junior and its project.
Note that this is only one criteria and not a declaration to follow every major company into every investment they make. They can get better terms than you and I and they make mistakes too.
The company has a deposit or could find a deposit a major would want
To be specific that means a project with multi million ounce potential and grade. We are looking for 2M-3M oz Au potential with 100K oz Au/yr production potential at a minimum. To be more specific, we want high margin potential projects. Something with marginal grade could be high margin and something with very good grade could only be marginal. Size and grade are a good starting point for high margin potential but one size does not fit all. Speaking of size, look for projects that have district-scale potential. In other words, look for very large land packages that could host more than one deposit.
Exploration companies are obviously further down on the food chain and not concerned with economic studies. However, in general we want projects that could have an internal rate of return of 15%-20% per year at $1100 to $1200 Gold.
Look for value and growth potential
Price is what you pay and value is what you get. You are either a contrarian or a victim. These are obviously quotes from investors much smarter than me. Buying high and selling higher can work in the conventional markets but it rarely works with respect to exploration companies. That could be because of the cyclicality of the industry as well as the much publicized “life cycle” that junior companies go through.
Valuing exploration companies is subjective and can be quite difficult. In short, we want to buy value but also growth potential. In other words, look for projects or deposits that have exploration upside. Companies can add value this way even if metals prices do not rise. The ideal situation is a junior that is undervalued but could grow its deposit materially.
Even though metals prices are down over the past 12 months, they are not preventing companies from being rewarded by adding value to their deposits or discovering new deposits. This reflects the turn in the industry cycle in late 2015 and that will not change even if metals prices retest their lows. We have a bearish outlook for the next six to nine months and if Gold breaks below $1200 it could create some very compelling values in the junior exploration sector.
Jordan Ro-Byrne
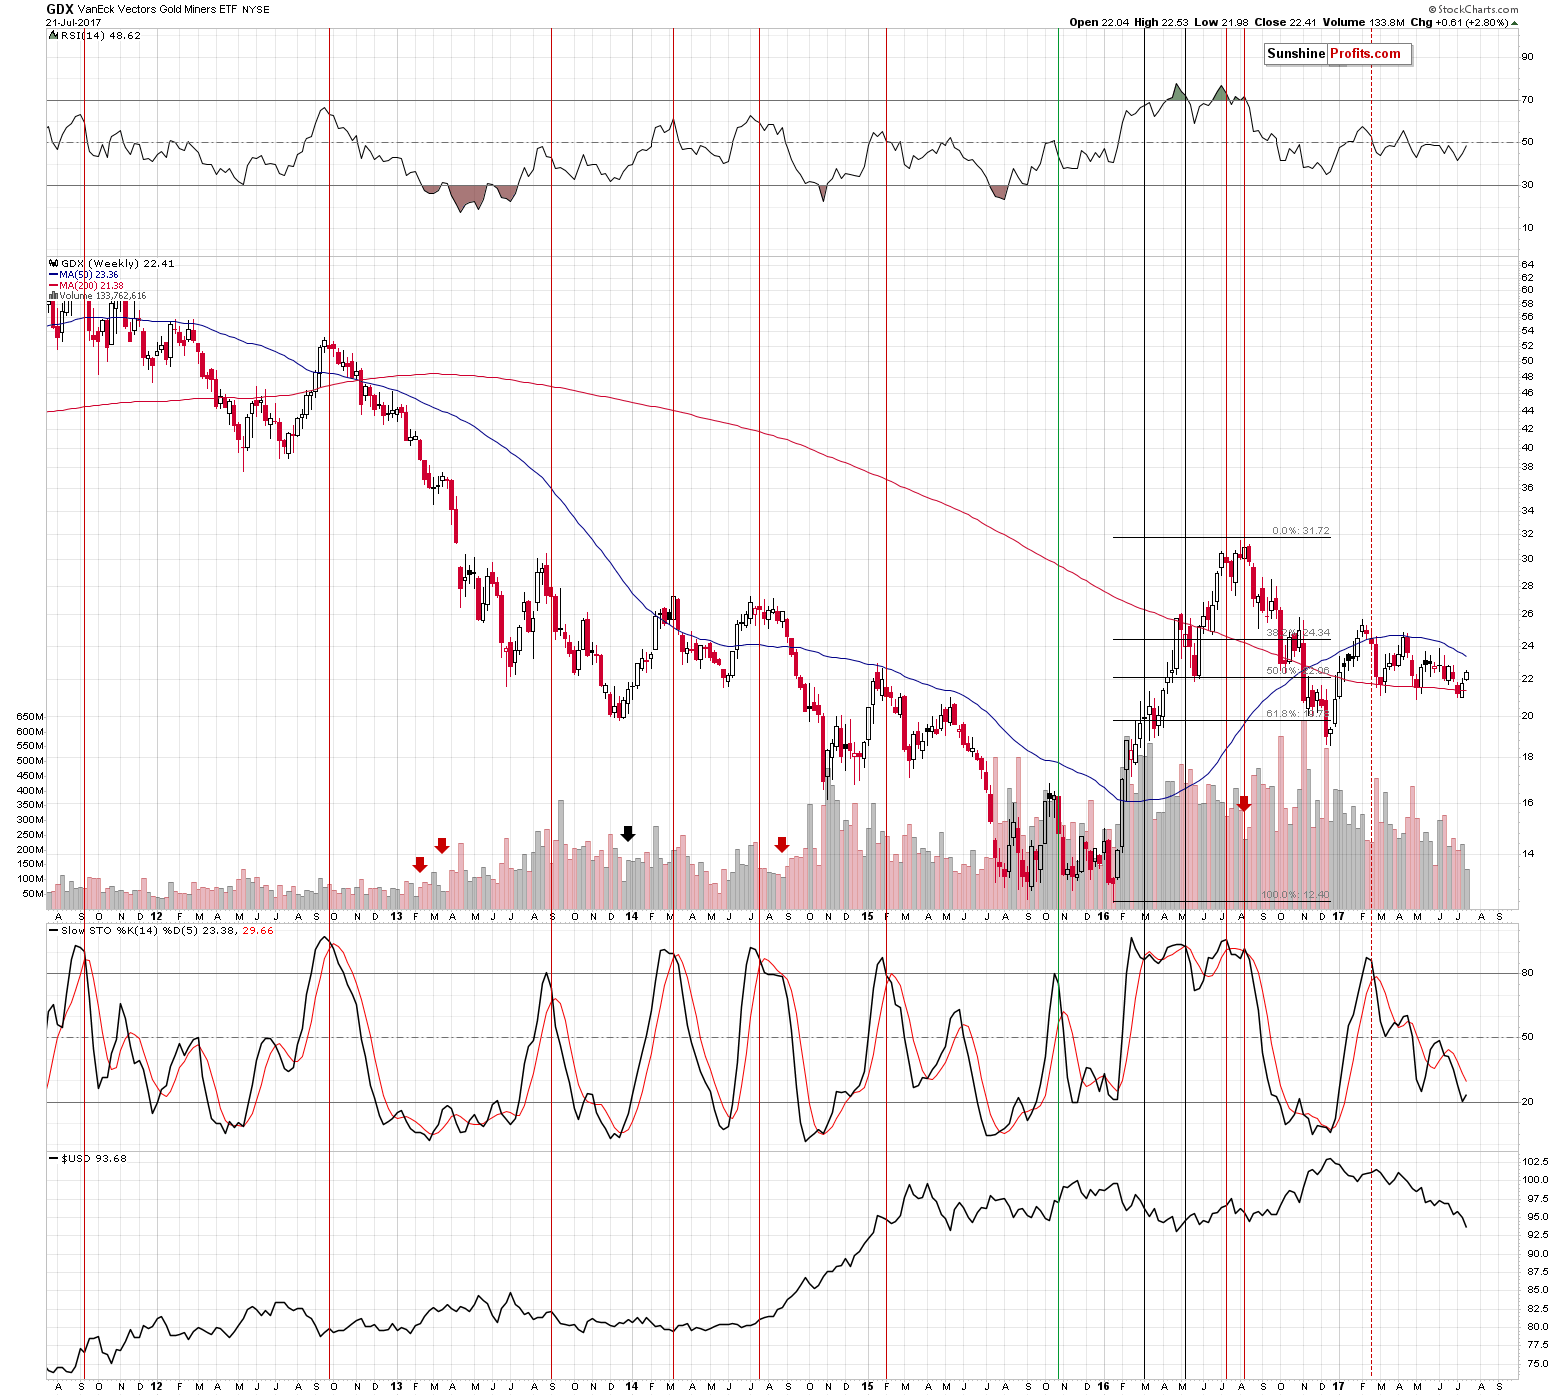
Briefly: In our opinion, full (150% of the regular full position) speculative short positions in gold, silver and mining stocks are justified from the risk/reward perspective at the moment of publishing this alert.
The biggest event of the previous week was the huge decline in the USD Index – the reaction of the precious metals market – especially the mining stocks – was very specific. What can we infer from the size and additional details of the metals and miners’ upswing?
Let’s take a look at the charts, starting with the USD Index (chart courtesy of http://stockcharts.com).
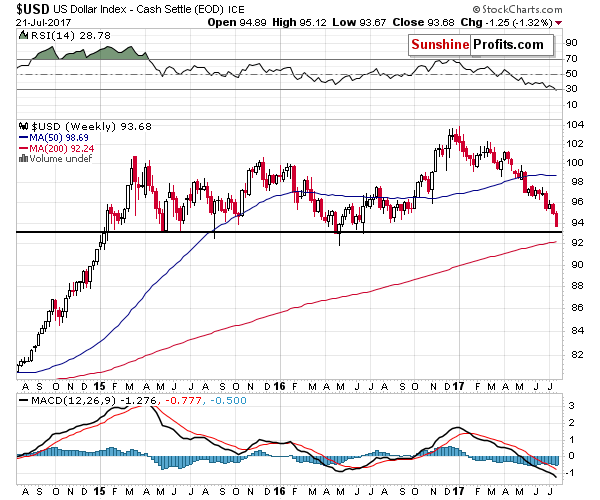
The USD Index broke below the late-2016 lows on Friday and there are a few things that we would like to stress. Firstly, the USD Index declined in an accelerated manner (reverse parabola), which is how the most volatile price swings end (remember the 2011 top in gold?). Secondly, the RSI indicator is the most oversold since the 2011 bottom (yes, the situation is so extreme at this point), while the fundamental picture still favors higher USD Index values (rising rates in the U.S. compared to expansive monetary policy in the EU and Japan, despite somewhat hawkish comments from Mario Draghi). Thirdly, while the USD broke through the short-term support levels, it is now approaching a long-term one – the 2015 and 2016 lows in terms of the weekly closing prices. They are just above the 93 level – about 0.6 below last week’s low. That’s only half of last week’s decline that would need to be seen for the USD to reach these key lows. In fact, just a repeat of Friday’s decline would almost be enough.
All of these factors point to a nearby reversal and the way that gold, silver, and – in particular – mining stocks have been reacting to the USD’s decline (to a limited extent) suggests that a reversal in the USD is likely to trigger a sharp decline in the precious metals sector.
Even if the USD was to repeat it’s Friday’s decline, would it be a good idea to bet on higher PM prices or even stay on the sidelines, especially given the recent show of volatility in silver?
All in all, our previous comments on the USD Index remain up-to-date:
Moving back to the current trend, let’s keep in mind that no market can move for long in a straight line up or down and there will be periodical corrections. Even within this short-term decline in the USD, there were corrective upswings. Let’s take a look at the most recent ones (one at the beginning of June and the second one at the end of June and the very beginning of July).
The USD Index moved higher by about an index point in each case – it turned out none of these rallies marked the end of the decline, but, the key question is how did the precious metals market reacted to these events. At the beginning of June, gold and silver declined substantially, then rallied back up a little when the USD resumed its downtrend, then declined again at the end of the June and it’s now moving back up as the USD continues to slide. Overall, however, gold is reacting strongly to the USD’s strength, even if it’s something temporary and relatively small, but it is reacting in a limited way to the USD’s short-term declines, even if they are significant. Overall, gold and silver remain in a downtrend even though the same thing is the case with the USD Index.
This means two things. Firstly, even if the short-term decline in the USD Index continues for some time, it will still be likely to be interrupted by corrective upswings, which will likely (just like was the case before) trigger bigger declines in the precious metals market – bigger than the preceding rallies.
Secondly, as soon as the USD Index forms the final bottom, and a big rally starts, gold and silver are likely to truly plunge – the size and sharpness of the decline in such a situation could be very significant.
Both things have one big implication for the precious metals investors – we could see either small rallies, or sizable declines, or enormous declines. This is a situation in which short positions appear appealing, not long ones.
Is there anything else that could point us to this direction besides the USD Index chart and comparing it to gold and silver prices? Yes.
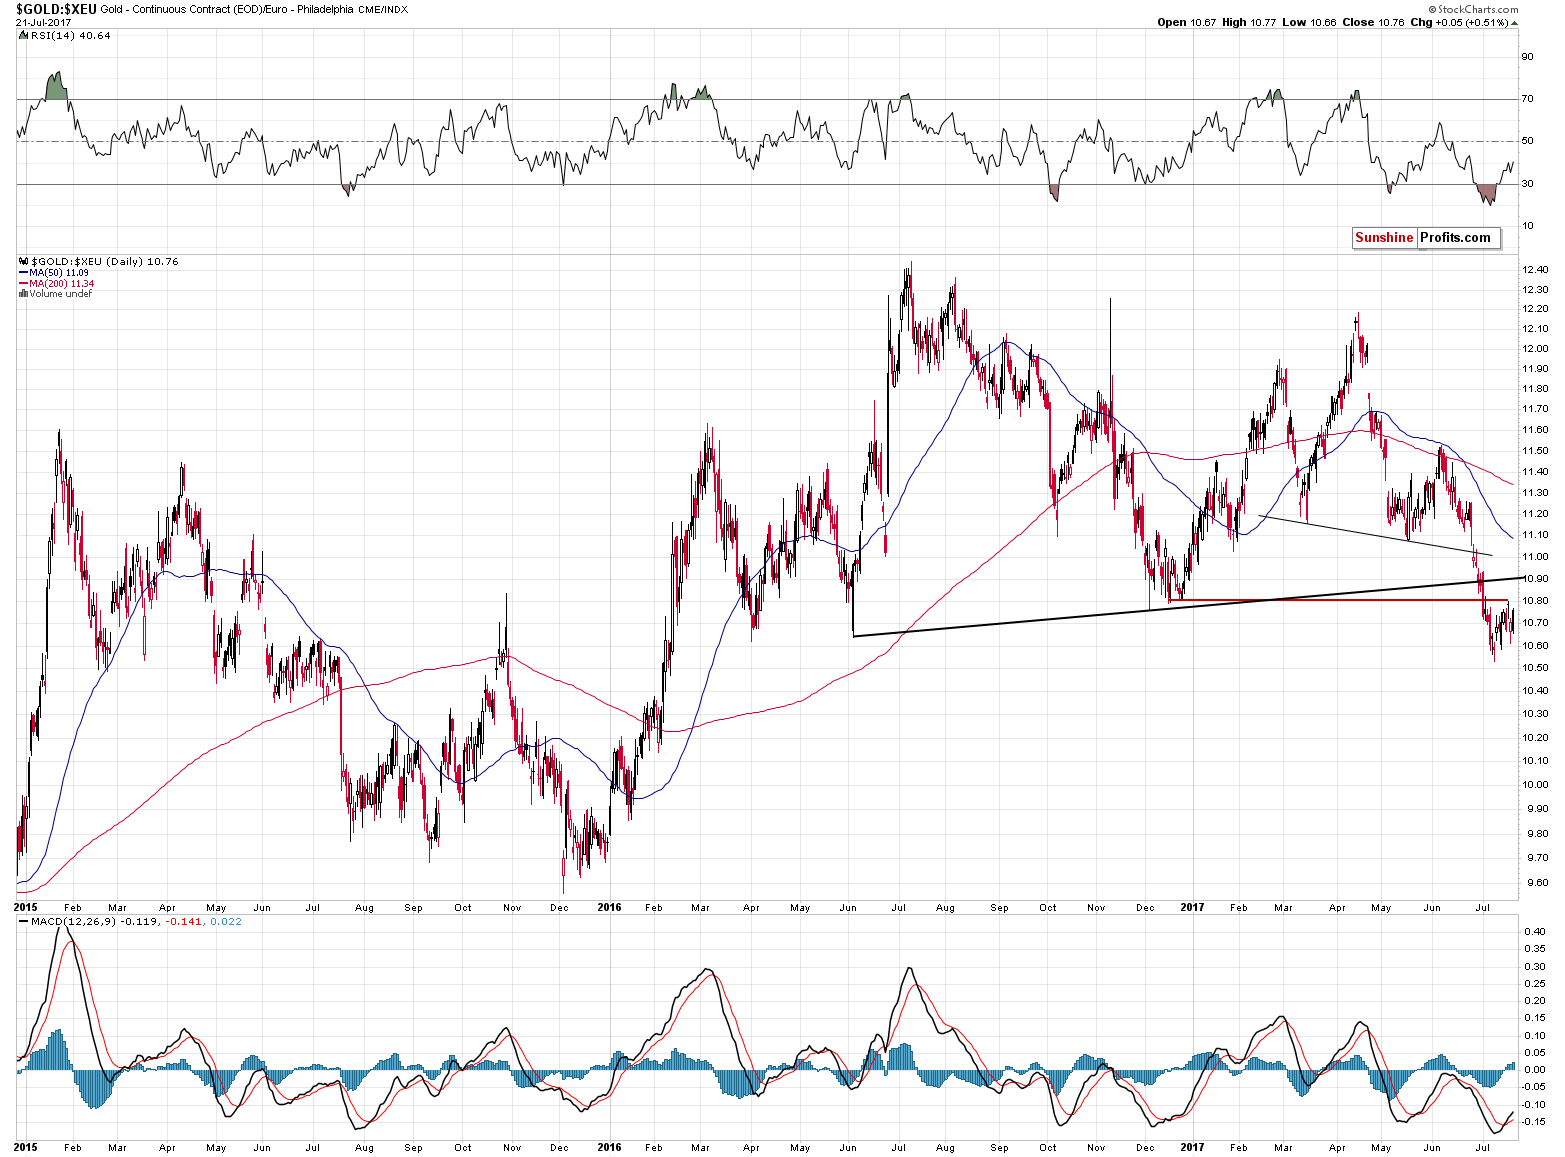
Friday’s session didn’t change the outlook in the case of gold’s price in terms of the euro and our previous comments remain up-to-date:
Gold priced in the euro has just verified its breakdown below the December 2016 low. The slide is now likely to continue. This means that gold’s underperformance relative to the USD Index is likely to continue and we could even see both decline simultaneously. That’s yet another reason for one not to view the decline in the USD Index as something significantly bearish.
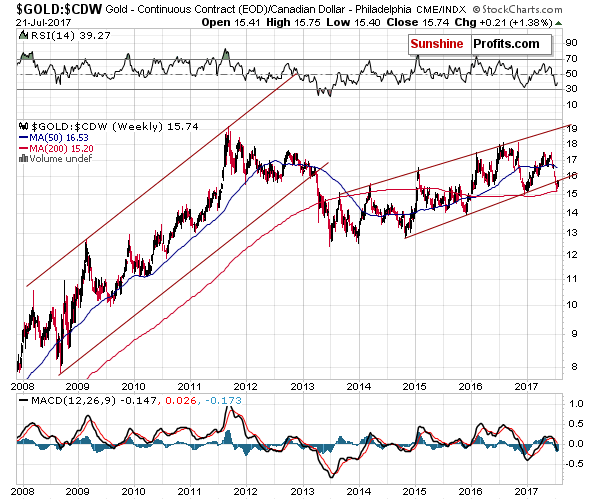
Gold’s performance in terms of the Canadian dollar is also bearish – the yellow metal broke below the long-term rising trend channel and verified this breakdown by moving back to it without breaking back above it. The breakdown was also confirmed in terms of weekly closing prices.
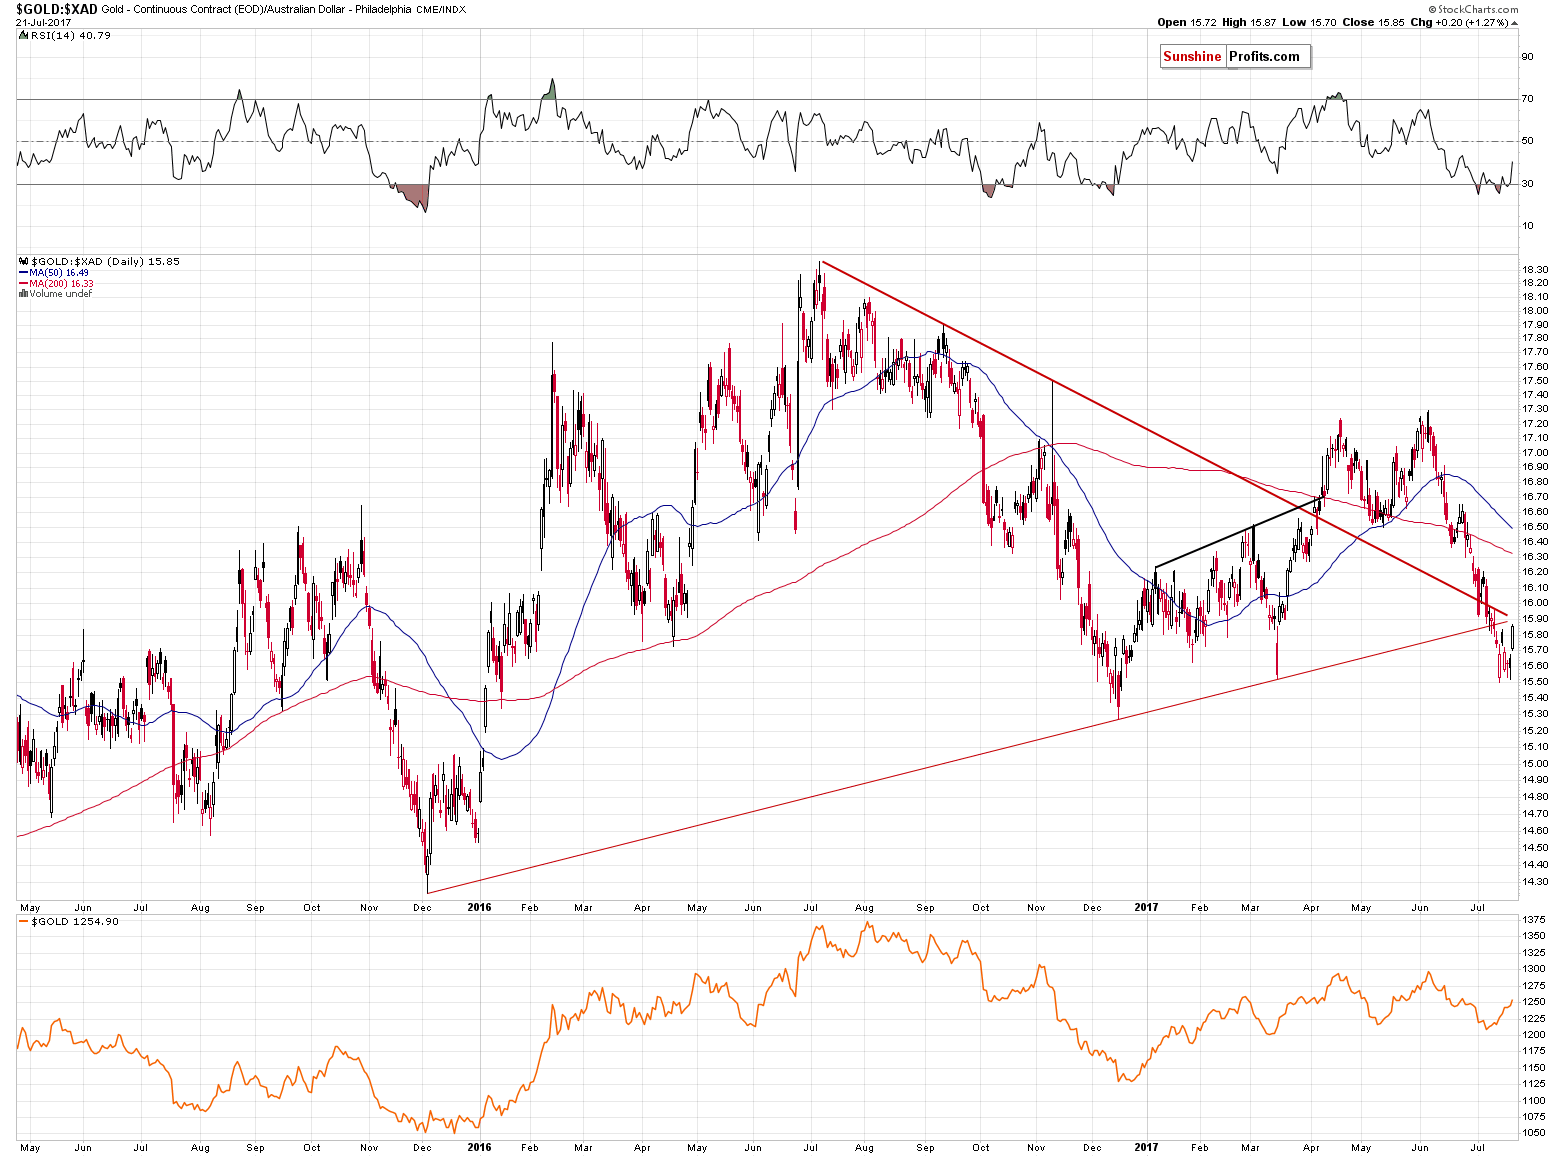
More or less the same is the case with gold priced in the Australian dollar. There was no trend channel in this case, but gold broke below 2 important support lines (one rising and one declining) anyway. Just like in the case of the breakdown in terms of the Canadian dollar, gold moved back to the previously broken lines but didn’t close the week back above them. The implications are bearish.
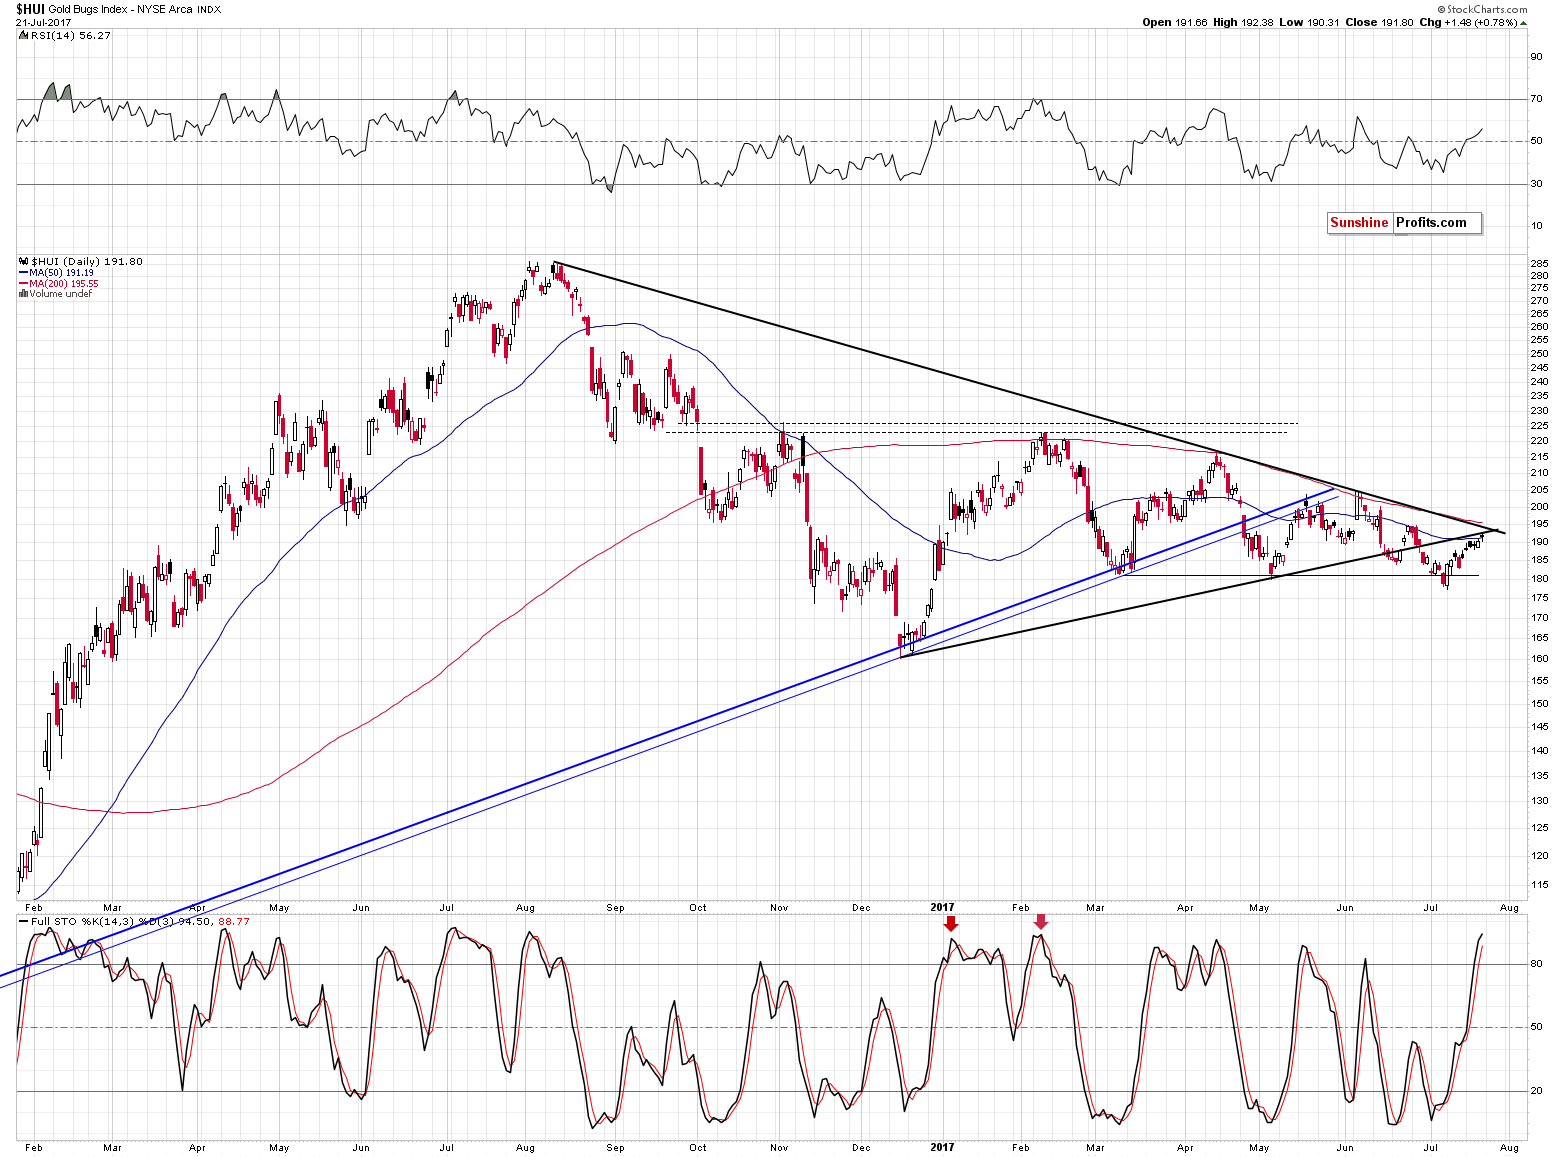
In the case of the gold stocks, we wrote the following on Friday:
The gold stocks’ reaction to yesterday’s decline in the USD and gold’s upswing was once again very weak. If a market doesn’t want to move in the way it “should” given what’s taking place in the case of its drivers (and there’s no doubt that the price of gold is the key driver behind gold stocks’ profits and thus prices), it is a strong indication that the market wants to move in the opposite direction and it’s waiting for a trigger.
For now, the trigger is absent as the USD Index continues to decline – however, the point is that since the USD Index is likely to reverse eventually which is likely to translate into a big plunge in miners and until it does… Miners don’t seem to be going anywhere. The nothing-or-big-decline situation is naturally a bearish one.
The above remains up-to-date as miners remain below two strong resistance lines – one declining one based on the August 2016, April 2017 and June 2017 highs and the second one based on the December 2016 and May 2017 lows. In a way, the entire July upswing in the miners was just a verification of the breakdown below the rising support black line.
The additional significant confirmation comes from the weekly volume readings.
The volume that we saw last week was extremely low, especially when compared to the sizes of previous volumes. Theoretically, it’s a strong bearish sign as it shows that the buying power is next to non-existent.
We marked similar situations with red arrows – as you see, the weekly upswings that took place on very low volume were usually followed by huge declines. The only exception that we can see on the above chart (1 out of 5) is not quite comparable as it was the session right at the bottom and the current one is the second after the bottom, which changes a lot – the volume should be picking up right now, but it isn’t. Back in December 2013 it was the first candlestick of the rally – so the sellers might have given up and the buyers simply were able to push the market higher. Besides, trading is generally limited in the second half of December each year as it’s the holiday season.
So, it seems that in all comparable cases, huge declines followed the low-volume rallies in mining stocks – will this time be any different? It doesn’t seem likely. The efficiency of this signal alone is something that makes the outlook very bearish for the following weeks.
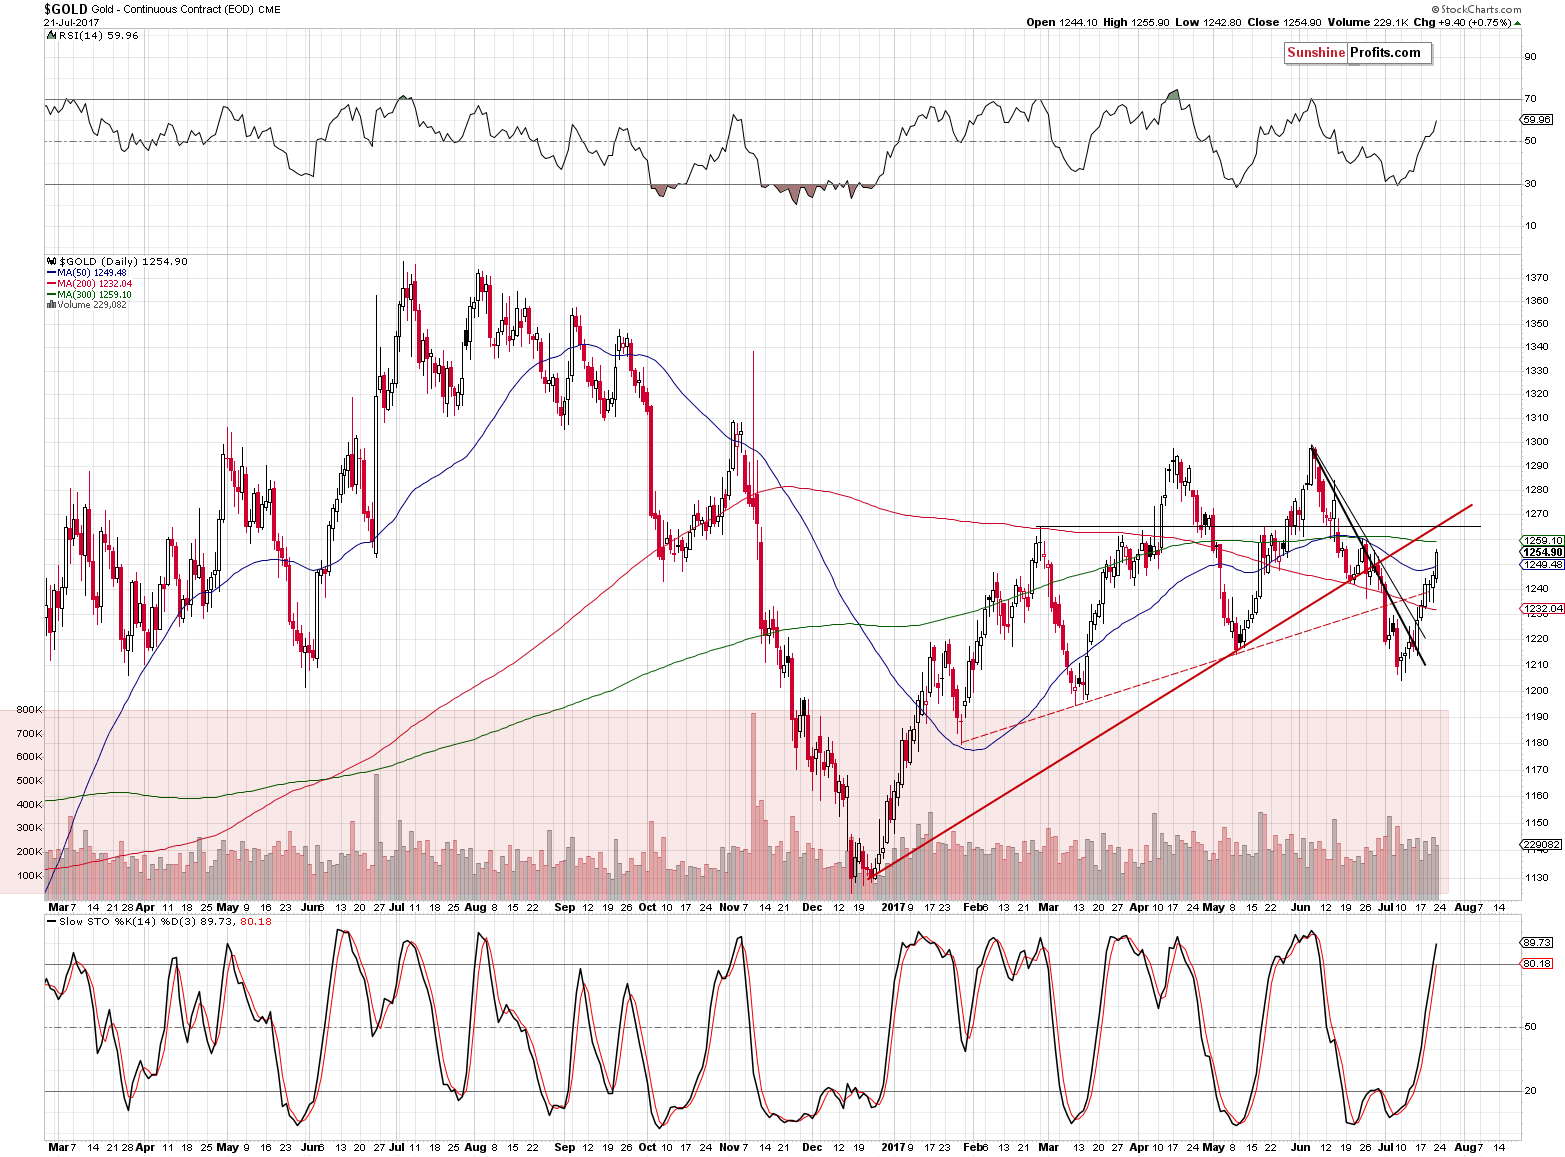
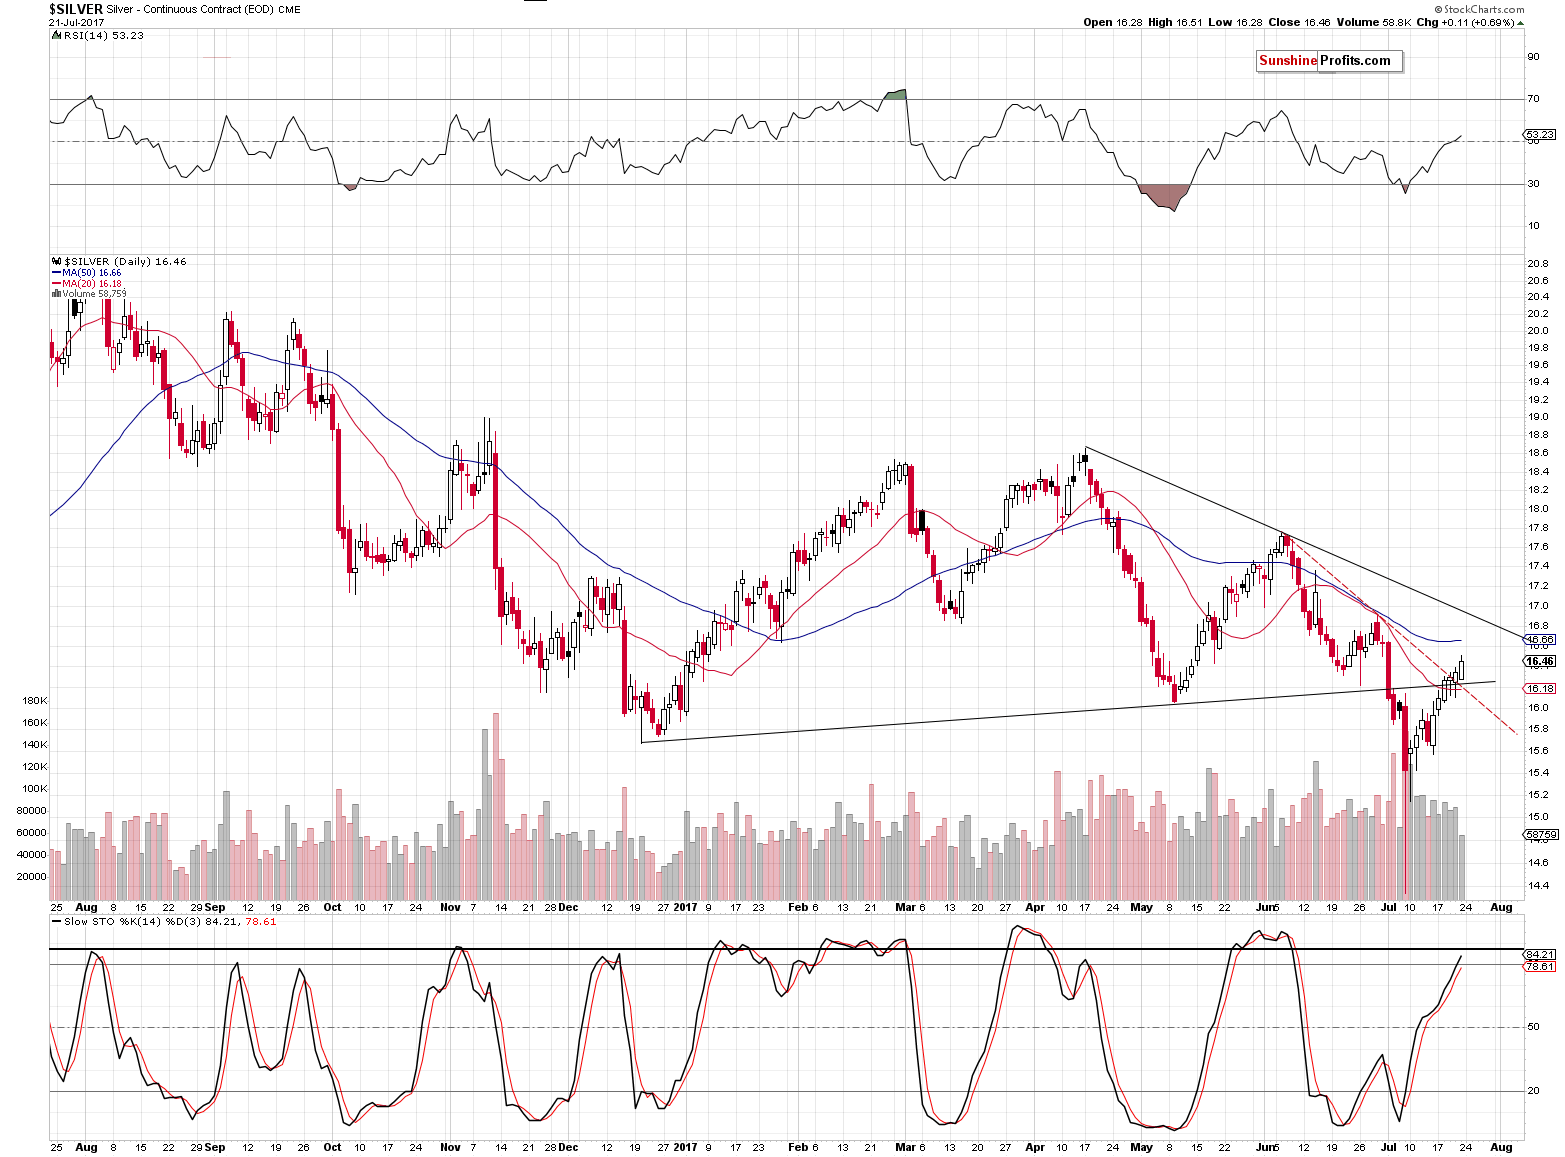
The precious metals are moving higher in terms of the USD, and their reaction continues to be limited – the moves may seem quite normal on the above charts, but gold and silver “should be” soaring given the reverse parabolic decline in the U.S. dollar.
Can gold and silver move higher temporarily? Yes, but very likely not much higher. Can gold and silver plunge shortly after reaching their tops and decline in a very volatile manner, similarly to what silver did recently? Naturally, that’s the key thing in the current situation – the downside potential is multiple times greater than the temporary upside potential.
Gold could move to $1,265 or so (the previous top and the rising support line), but would that really matter if gold plunged over $150 shortly thereafter? The analogous price level for silver would be $16.90 and everyone saw recently just how fast silver could decline once it’s time for it.
Summing up, last week’s sessions didn’t invalidate multiple bearish points that we had made in our previous alerts and – despite the bullish nature of the week (after all, gold, silver and mining stocks closed higher last week than on the previously) – it was yet another case of the metals and miners’ underperformance given the action in the USD Index. The breakdowns in gold prices, in terms of currencies other than the U.S. dollar, were confirmed and we saw a major sell signal from the mining stocks – they rallied on very small volume last week, and in practically all similar cases from the recent past, this meant that a big decline was about to be seen. Any strength here is likely to be only temporary.
As always, we will keep you – our subscribers – informed.
To summarize:
Trading capital (supplementary part of the portfolio; our opinion): Short positions (150% of the full position) in gold, silver and mining stocks are justified from the risk/reward perspective with the following stop-loss orders and initial target price levels / profit-take orders:
- Gold: initial target price level: $1,063; stop-loss: $1,317; initial target price for the DGLD ETN: $81.88; stop-loss for the DGLD ETN $44.57
- Silver: initial target price: $13.12; stop-loss: $19.22; initial target price for the DSLV ETN: $46.18; stop-loss for the DSLV ETN $17.93
- Mining stocks (price levels for the GDX ETF): initial target price: $9.34; stop-loss: $26.34; initial target price for the DUST ETF: $143.56; stop-loss for the DUST ETF $21.37
In case one wants to bet on junior mining stocks’ prices (we do not suggest doing so – we think senior mining stocks are more predictable in the case of short-term trades – if one wants to do it anyway, we provide the details), here are the stop-loss details and initial target prices:
- GDXJ ETF: initial target price: $14.13; stop-loss: $45.31
- JDST ETF: initial target price: $417.04; stop-loss: $43.12
Long-term capital (core part of the portfolio; our opinion): No positions (in other words: cash)
Insurance capital (core part of the portfolio; our opinion): Full position
Thank you.
Sincerely,
Przemyslaw Radomski, CFA
Founder, Editor-in-chief, Gold & Silver Fund Manager

Chart: Retail Apocalypse 2017
The steady rise of online retail sales should have surprised no one.
Back in 2000, less than 1% of retail sales came from e-commerce. However, online sales have climbed each and every year since then, even through the Great Recession. By 2009, e-commerce made up about 4.0% of total retail sales, and today the latest number we have is 8.3%.

Here’s another knowledge bomb: it’s going to keep growing for the foreseeable future. Huge surprise, right?
SIGNS OF A RECKONING
Retailers eye their competition relentlessly, and the sector also has notoriously thin margins.
The big retailers must have seen the “retail apocalypse” coming. The question is: what did they do about it?
Well, companies like Sears failed the shift to digital altogether – in fact, it is even widely speculated that the former behemoth might file for bankruptcy later this year.
The majority of other companies, on the other hand, are trying to combine “clicks and bricks” into a cohesive strategy. This sounds good in theory, but for established and sprawling brick and mortar retailers with excessive overhead costs, such tactics may not be enough to ward off this powerful secular trend. Target, for example, has had impressive growth in online sales, but they still only make up just 5% of total sales. As a result, the company’s robustness is also in doubt.
Wal-Mart took another route, which could potentially be the smartest one. The company hedged their bets by buying Jet.com, which was one of the fastest growing online retailers at the time. Later, they followed up by buying an online shoe retailerto help fill a perceived gap in footwear. Recent reports have surfaced, saying that these acquisitions are leading to staff shakeups, as the company re-orients its focus.
After all, going online is not just a tactic to boost sales in the new era of retailing. It has to be a mindset, and one that is central to the company’s strategy. Hopefully Wal-mart gets that, otherwise they will also be in trouble as well.
APOCALYPSE NOW
In the midst of all of this is what is described as the “retail apocalypse”.
There are two main metrics that are pretty black and white:
Number of Bankruptcies: We’re not even one-third through 2017, and we already have about as many retail bankruptcies as the previous year’s total. If they continue at the current pace, we could see over 50 retailers bankrupt by the end of the year.
Number of Store Closings: So far we’ve seen roughly 3,000 store closings announced in 2017, and Credit Suisse estimates that could hit 8,600 by the end of the year. That would easily surpass 2008’s total, which was 6,200 closings, to be the worst year in recent memory.
Here’s some of the companies that have already filed for bankruptcy:
- Gordmans Stores
- Gander Mountain
- Radioshack (again)
- HHGregg
- BCBG Max Azria
- Eastern Outfitters
- Wet Seal
- The Limited
- Vanity Shop of Grand Forks
- Payless Inc.
- MC Sports
And here are the store closings occurring as a result of the retail apocalypse:


-
I know Mike is a very solid investor and respect his opinions very much. So if he says pay attention to this or that - I will.
~ Dale G.
-
I've started managing my own investments so view Michael's site as a one-stop shop from which to get information and perspectives.
~ Dave E.
-
Michael offers easy reading, honest, common sense information that anyone can use in a practical manner.
~ der_al.
-
A sane voice in a scrambled investment world.
~ Ed R.
Inside Edge Pro Contributors

Greg Weldon

Josef Schachter

Tyler Bollhorn

Ryan Irvine

Paul Beattie

Martin Straith

Patrick Ceresna

Mark Leibovit

James Thorne

Victor Adair