
Timing & trends
Just a quick, happy update on the gold/silver COT reports. See last week’s post for a little more background.
Speculators are running scared in the paper precious metals markets. And that’s a good thing.
The past few months’ correction has finally led hedge funds and other technical/momentum traders to shed their long positions and load up on short bets. Meanwhile the Commercials, which tend to be right at big turning points, are becoming much more bullish.
Historically, the kind of internal structure now evolving in the futures market has signaled the start of a new upswing in prices. That may or may not hold this time around. But if it’s not a screaming buy, it is an indication that that day is getting closer.


via:


 We’ve had to wait 18 months for an opportunity as big as the one we saw late in 2015 to appear again in the Precious Metals sector. “Wait a minute”, I hear you say, “prices were generally lower back then at that low than they are now, so how can it be as big an opportunity, as leverage is reduced?”. Here are the reasons, one technical, the other fundamental. When prices rose out of the late 2015 low, which was the Head of the Head-and-Shoulders bottom shown to advantage on the 10-year chart for GDX below, they were destined to retrace to mark out the Right Shoulder of the pattern, which is what now has most investors very negative towards the sector again. This time they don’t have to – they can now rise out of this trough and proceed to break out upside from the entire pattern to embark on a mighty bullmarket. The fundamental reason is this – most investors have been taken in by the specious Central Bank talk about “normalizing interest rates” and scaling back their bloated balance sheets – but they haven’t got a cat in hell’s chance of doing this – why? – because debt (and associated derivatives) has expanded to such gargantuan levels, that any attempt to bring it under control will send interest rates skyrocketing. Because of this stark reality, they are left with only one option – to inflate the debt away by monetizing it, which means inflation. Once investors grasp the inevitability of this – and that this process will soon get underway with a vengeance, gold and silver will soar. That is what the charts that we are going to look at today are telling us, and it means that we may never see the bargains in the Precious Metals sector that are now available ever again – or at least not for a very long time. The latest COTs are telling us that gold and silver have hit bottom, or are very close to having done so, and that the time to buy the sector is now. Before proceeding to look at them we will start by looking at the latest 10-year chart for GDX, a reliable PM stocks proxy, to see where we are on the market clock, where we are in the PM stock price cycle.Our 10-year arithmetic chart for GDX shows a clear large Head-and-Shoulders bottom forming, with the price now in the process of completing the Right Shoulder trough of the pattern. Obviously, most would be investors in this sector either don’t know this pattern exists, or if they are aware of it, have written it off as a false H&S bottom, witness the rotten sentiment towards the sector, which is just what we want to see at this juncture. Indications that the pattern is genuine are provided by the strong volume on the rise out of the trough of the Head of the pattern, which we can expect to see again on the rise out of the Right Shoulder trough soon, and the outstandingly bullish COTs which we will soon look at.
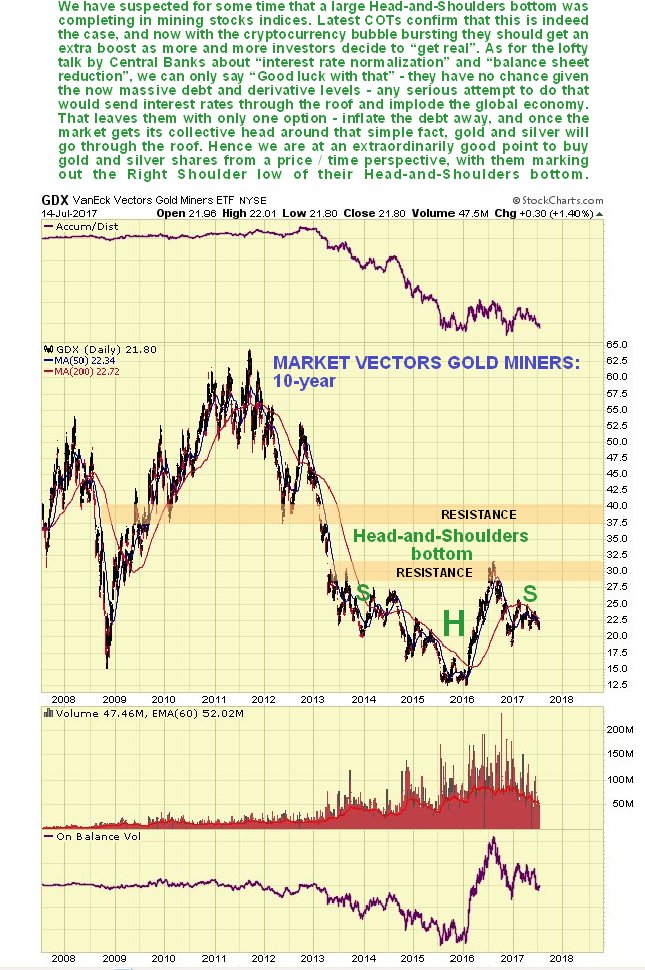
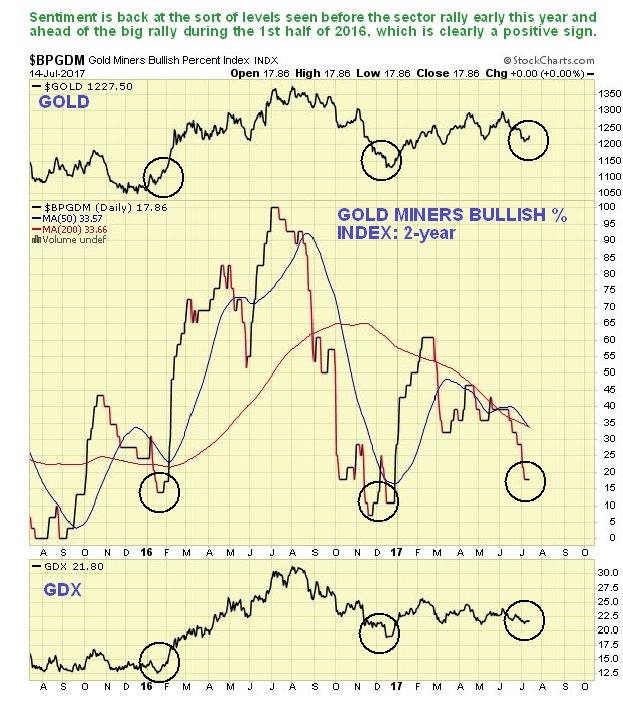
The rotten sentiment towards the PM sector is amply illustrated by the latest Gold Miners Bullish % chart. At just under 18% bullish, it is a little above the levels seen before the sector rally early this year, and at about the same level seen before the big rally during the 1st half of 2016. This clearly points to a sizeable advance by the sector soon.
Next we look at a 3-year chart for gold. At first sight this does not look very encouraging as it looks like there is room for gold to fall further to last December’s low, or further down to the December 2015 low, but of course, if gold is marking out a Head-and-Shoulders bottom in the manner of GDX, which it is, as can be seen on its 8-year chart in the last Gold Market update, then we would expect it to turn up from around where it is now. Now we will look at the latest COT to see why it is likely to.
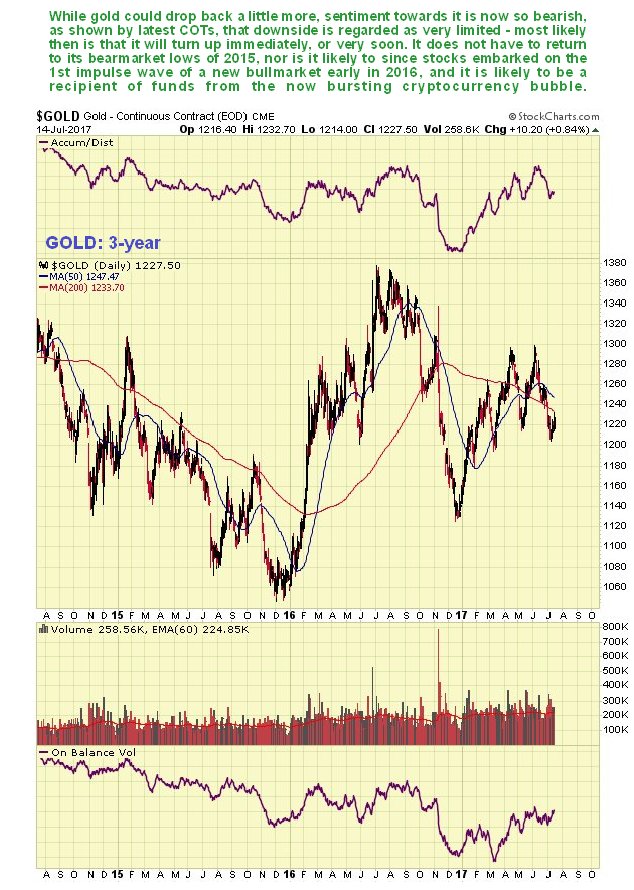
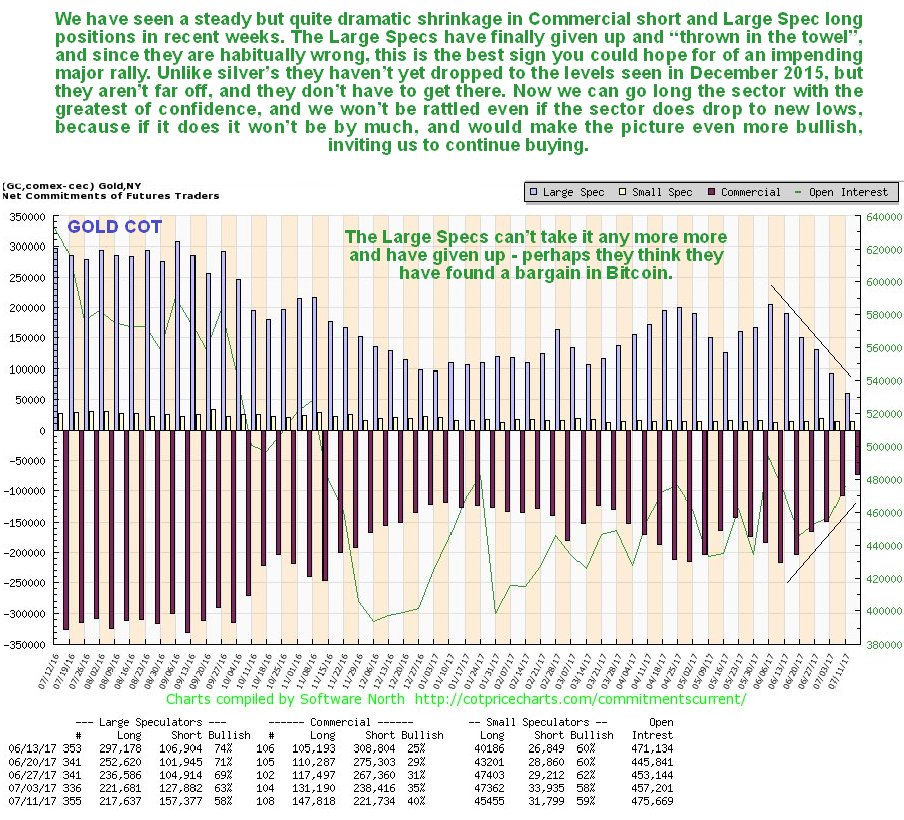
On gold’s latest COT chart we can see how Large Spec long positions have shrunk dramatically over the past 6 weeks to a low level, and since the Large Specs are habitually wrong, this was almost a necessary prerequisite to a strong advance. The question we want to answer is “Have they dropped back enough now to lead to a reversal and the start of a major new uptrend?” The answer to that is yes, they probably have. For one thing, silver’s COT readings have already dropped back to their levels at the low of December 2015, which provides circumstantial evidence that gold’s readings do not need to drop back any further. Secondly, we would not expect gold’s COT readings at the Right Shoulder low to drop back as low as they were at the low of the Head of the pattern, because that was the low for the cycle and the end of the bearmarket. Current readings are therefore thought to be low enough to synchronize with a reversal.
Click on chart to popup a larger clearer version.
Nevertheless, it is worth looking at the old gold COT chart for the period around the December 2015 low, which shows a rare and remarkable circumstance where Commercial short and Large Spec long positions had dropped back almost to zero – it doesn’t get more bullish than that for gold. While they may not be at zero now, they are getting close, close enough considering where we are in the cycle.
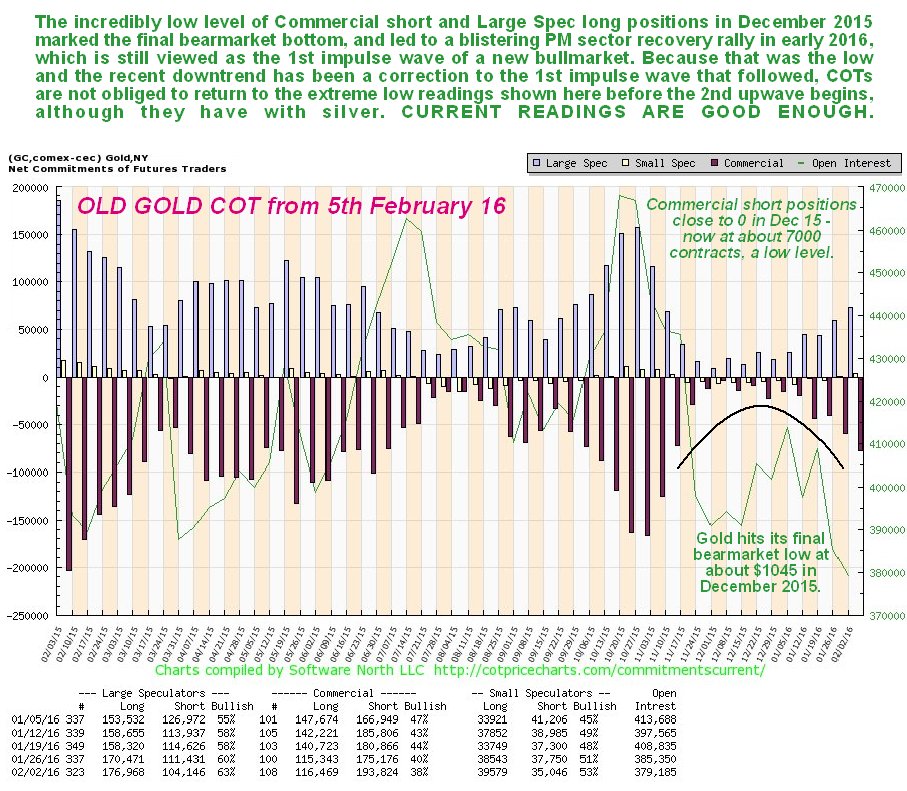
Click on chart to popup a larger clearer version.
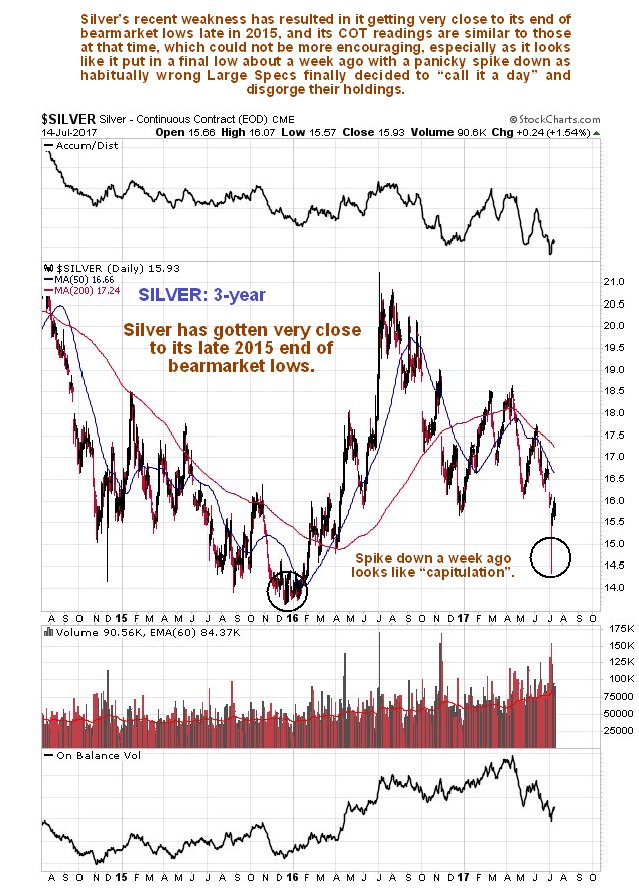
It is worth mentioning the cryptocurrency market briefly, because it has been siphoning off money, some of which might have otherwise been destined for the Precious Metals. This grotesque bubble is blowing apart right now, which should help the Precious Metals, and you may recall that we warned to steer clear of Bitcoin in the article Due to Popular Demand Maund DOES NOT cover Bitcoin posted within a day of its final peak. Frankly, it is hard to understand how anyone could prefer virtual money, which has a tendency to suddenly disappear like a mirage, to real money such as gold and silver. Now we turn to silver, where we will see that despite weaker price action recently, COTs are even more bullish than those for gold. While silver looks considerably weaker than gold, as it has dropped back close to its December 2015 lows, which gold hasn’t (it is still quite some way above them), we should remember that it is normal for silver to underperform gold in the late stages of bearmarkets and early stages of bullmarkets. As we observed in the last Silver Market update, the spike down about a week ago on high volume looks like a final “capitulation”.
The latest silver COT chart reveals that Commercial short and Large Spec long positions have shrunk steadily in recent weeks back to levels that are now very low indeed. In fact they are at the same levels as in December 15, as you will see by looking at the earlier COT chart stacked beneath the latest one below – and we know what happened after that – there was a blistering PM sector stock rally that saw some stocks make huge percentage gains, like Coeur d’Alene (now named Coeur Mining Inc) which rose more than 8-fold. Of course, we won’t see such big percentage gains this time round, at least not immediately, as we will be coming off a higher base, but we ought to later because the PM stocks sector indices should proceed to break out of the top of their respective Head-and-Shoulders bottom patterns to enter a major bullmarket growth phase.
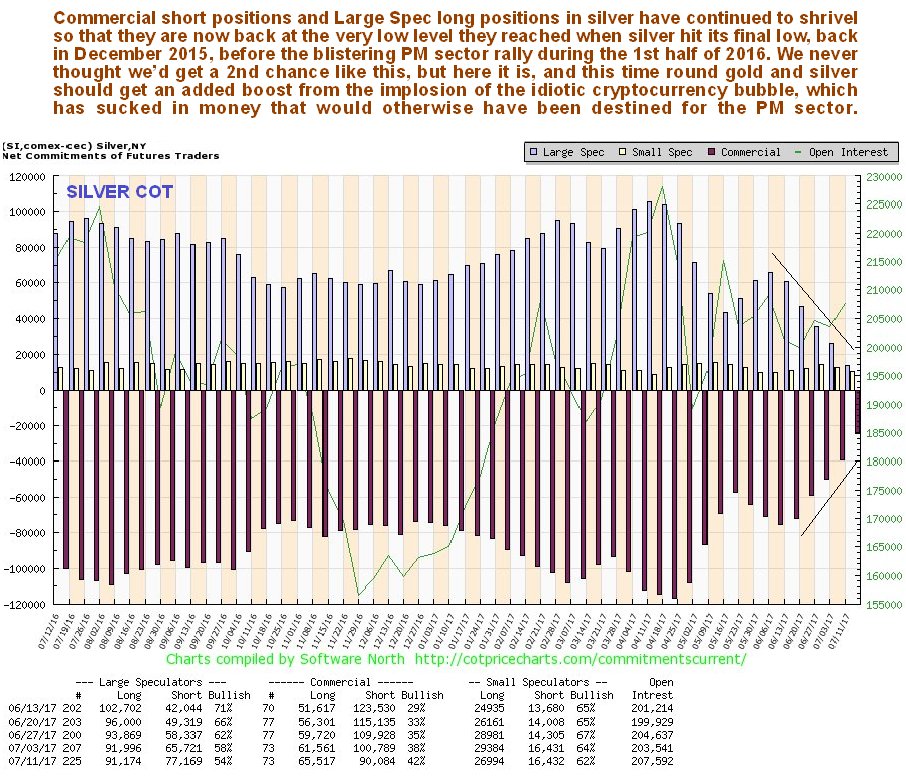
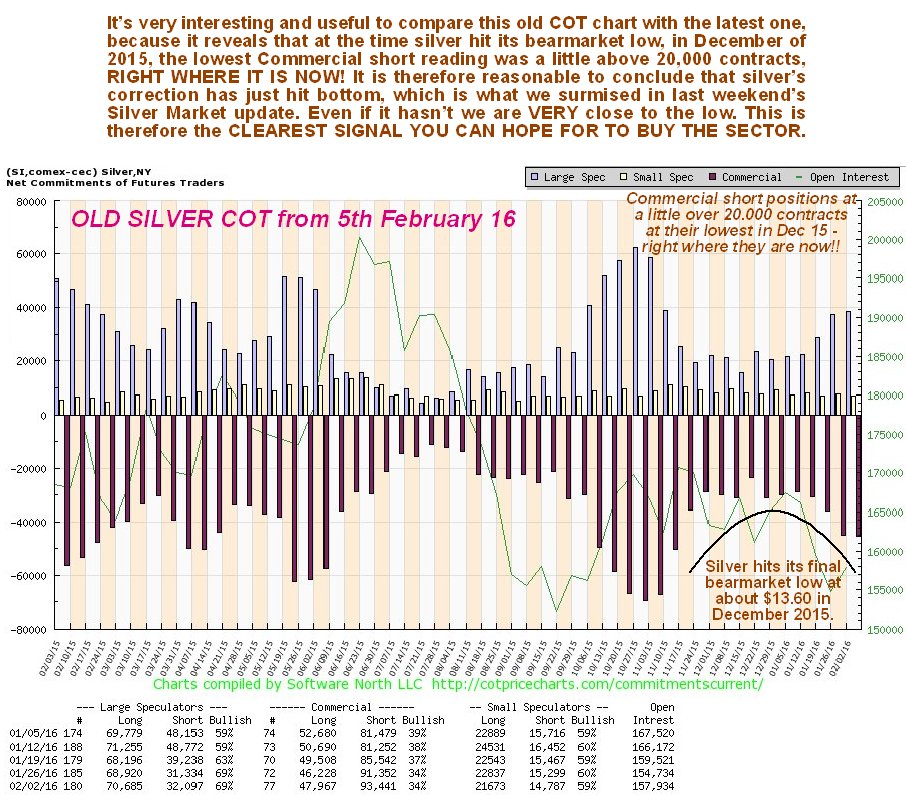
Click on charts to popup a larger clearer version.
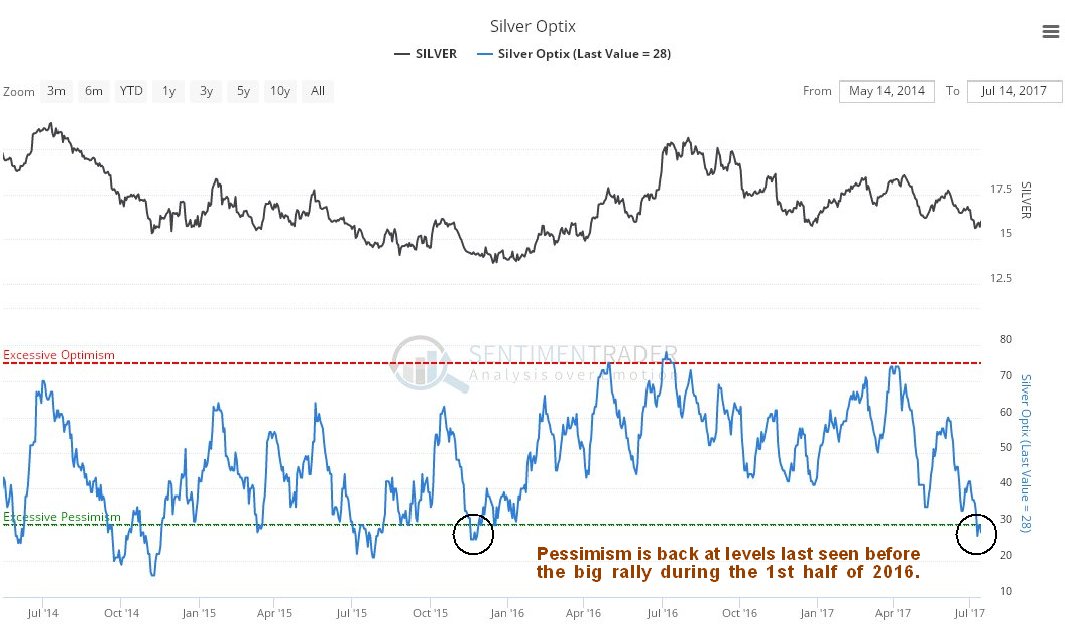
Finally we will take a quick look at the latest Silver Optix, or optimism chart, where we see that investors are at their most pessimistic towards the metal since the bottom of the bearmarket in 2015, just before a big sector rally. This obviously augurs well for the sector since the majority are always wrong.
Click on charts to popup a larger clearer version
With this gigantic opportunity staring us in the face, we will obviously be looking at a range of attractive Precious Metals stocks on the site very soon.
End of update.
Posted at 4.10 pm EDT on 15th July 17.
 In early May, 2017, we alerted our follwers to a trading opportunity that resulted in a nearly perfect Momentum Reversal Method (MRM) setup – this trade was MOBL (Mobileiron Inc). Now that the trade has completed, we wanted to share with you an example of how the MRM trading strategy works and how successful some of these setups can become. But first, lets take a bit of time to understand what ActiveTradingPartners.com is and how we provide benefit and services to our clients.
ActiveTradingPartners.com is a research and analytics firm that specialized in US Equities, ETFs and major Commodities analysis. Our objective is to continually provide updated research and analytics for our members as well as to actively deploy our specialized Momentum Reversal Method (MRM) trading strategy for our members use and benefit. As many of you may remember, on June 11 2017, we posted our research that the “NASDAQ would sell off” and the “VIX would SPIKE” on or near June 29th, 2017. How many of you would have loved to know that we predicted a 6% swing in the NASDAQ and a 52% swing in the VIX two weeks in advance on the EXACT DAY it happened?
What we are trying to illustrate to you is that we attempt to provide value beyond our trading signals and beyond our daily updates. We attempt to keep you aware of what is likely to happen in the global markets and how these swings can be advantageous for you as traders/investors. So, before we get sidetracked on the extras we provide, lets focus on this MOBL trade.
MOBL began to appear on our MRM alerts in early April 2017. As with many of the MRM type of setups, they begin can sometimes start to alert us to setups days or weeks in advance of the actual move. In this case, classic technical and Fibonacci analysis assisted in confirming our MRM trigger. The MRM setup was valid and we simply wanted to watch the MRM setup for signs of price volume/rotation. We often use this price/volume rotation trigger as a means of setting up entry functions for pending MRM triggers.
In early May 2017, the price/volume rotation trigger was complete and now we had a valid entry into MOBL with projected targets of $5.45 and $6.25. Our analysts identify the targets based on recent price action, where our entry is located and current price/volume rotation levels. In other words, if we believe the move will be short-term, then we will adjust our targets to focus on immediate objectives. If we believe the move will be a bit longer-term, then we will adjust our targets to focus on that objective.
Just to be clear, everything originates from the MRM trigger. We may see 20 or 30 of these triggers each week. From there, price confirmation MUST occur or have already happened in order for it to be considered for our ATP members. Additionally, we attempt to gauge the overall global markets in terms of risk parameters for each MRM setup/trigger. If the US majors or global markets are weak and fearful, then we’ll address that risk by being more selective of our MRM triggers and setups. If our analysts believe the US and global markets are going to continue to trend, then we may widen our risk parameters a bit more.
On May 11th, 2017, we issued a BUY Swing Trade Alert for MOBL @ $4.65 for a FULL Position. This exact alert read as follows:
Buy Symbol: MOBL
Max Buy Price: $4.85 or lower
Position Size: FULL
Stop loss: Close below $3.95
Target: $5.45, then $6.25 objective for a 17~35%+ swing potential
Enter FULL position below $4.85 today. A move above $5.35 is expected with a potential for a move above $6.50 later.
As you can see from these charts, we executed the MOBL trade flawlessly. The first target was hit only 6 trading days after entry for a +17% gain. The second target took a bit longer, but it was eventually hit 26 trading days after entry (about one month after entry). It was just prior to the second target being hit that our research team indicated that MOBL could run much higher and that we should alert our members that we are going to use Target #2 as a stop adjustment and attempt to let this position run. Typically, we get about 2~4 of these types of trades each calendar year for our members – you know, the big breakout runners that can turn into 30%, 50%, 120% or more.
In early May, 2017, we alerted our follwers to a trading opportunity that resulted in a nearly perfect Momentum Reversal Method (MRM) setup – this trade was MOBL (Mobileiron Inc). Now that the trade has completed, we wanted to share with you an example of how the MRM trading strategy works and how successful some of these setups can become. But first, lets take a bit of time to understand what ActiveTradingPartners.com is and how we provide benefit and services to our clients.
ActiveTradingPartners.com is a research and analytics firm that specialized in US Equities, ETFs and major Commodities analysis. Our objective is to continually provide updated research and analytics for our members as well as to actively deploy our specialized Momentum Reversal Method (MRM) trading strategy for our members use and benefit. As many of you may remember, on June 11 2017, we posted our research that the “NASDAQ would sell off” and the “VIX would SPIKE” on or near June 29th, 2017. How many of you would have loved to know that we predicted a 6% swing in the NASDAQ and a 52% swing in the VIX two weeks in advance on the EXACT DAY it happened?
What we are trying to illustrate to you is that we attempt to provide value beyond our trading signals and beyond our daily updates. We attempt to keep you aware of what is likely to happen in the global markets and how these swings can be advantageous for you as traders/investors. So, before we get sidetracked on the extras we provide, lets focus on this MOBL trade.
MOBL began to appear on our MRM alerts in early April 2017. As with many of the MRM type of setups, they begin can sometimes start to alert us to setups days or weeks in advance of the actual move. In this case, classic technical and Fibonacci analysis assisted in confirming our MRM trigger. The MRM setup was valid and we simply wanted to watch the MRM setup for signs of price volume/rotation. We often use this price/volume rotation trigger as a means of setting up entry functions for pending MRM triggers.
In early May 2017, the price/volume rotation trigger was complete and now we had a valid entry into MOBL with projected targets of $5.45 and $6.25. Our analysts identify the targets based on recent price action, where our entry is located and current price/volume rotation levels. In other words, if we believe the move will be short-term, then we will adjust our targets to focus on immediate objectives. If we believe the move will be a bit longer-term, then we will adjust our targets to focus on that objective.
Just to be clear, everything originates from the MRM trigger. We may see 20 or 30 of these triggers each week. From there, price confirmation MUST occur or have already happened in order for it to be considered for our ATP members. Additionally, we attempt to gauge the overall global markets in terms of risk parameters for each MRM setup/trigger. If the US majors or global markets are weak and fearful, then we’ll address that risk by being more selective of our MRM triggers and setups. If our analysts believe the US and global markets are going to continue to trend, then we may widen our risk parameters a bit more.
On May 11th, 2017, we issued a BUY Swing Trade Alert for MOBL @ $4.65 for a FULL Position. This exact alert read as follows:
Buy Symbol: MOBL
Max Buy Price: $4.85 or lower
Position Size: FULL
Stop loss: Close below $3.95
Target: $5.45, then $6.25 objective for a 17~35%+ swing potential
Enter FULL position below $4.85 today. A move above $5.35 is expected with a potential for a move above $6.50 later.
As you can see from these charts, we executed the MOBL trade flawlessly. The first target was hit only 6 trading days after entry for a +17% gain. The second target took a bit longer, but it was eventually hit 26 trading days after entry (about one month after entry). It was just prior to the second target being hit that our research team indicated that MOBL could run much higher and that we should alert our members that we are going to use Target #2 as a stop adjustment and attempt to let this position run. Typically, we get about 2~4 of these types of trades each calendar year for our members – you know, the big breakout runners that can turn into 30%, 50%, 120% or more.

When all was said and done, Our VIX/NASDAQ analysis was perfect and the rotation in the tech markets resulted in our MOBL trade getting stopped out July 3rd, 2017 @ $5.85 for a +25.6% gain. This single trade resulted in a +$4000 total return for our members – this one trade will cover their ActiveTradingPartners.com membership for almost FOUR YEARS. Believe it or not, we are expecting MOBL to generate another MRM setup soon that could allow us to re-enter this trade for the next run higher.


A 5,800 square km section of the Larsen C ice shelf split off the continent sometime between Monday and Wednesday, according to a release from Project Midas, which has been keeping an eye on it. The iceberg’s split has been expected for quite some time, and although it’s certainly a big chunk, it doesn’t set the record for biggest ‘berg to break free from Antarctica… CLICK HERE for the complete article


A couple of articles at the Motley Fool caught our eye today. One discussing the potential upside of oilsands behemoth Cenovus Energy, the other the volatile rollcoaster that is Crescent Energy. Interesting to read at the same time:
Cenovus Divestitures on the Horizon: Time to Buy? by Joey Frenette
Can Crescent Point’s Share Price Double? by Kay Ng

-
I know Mike is a very solid investor and respect his opinions very much. So if he says pay attention to this or that - I will.
~ Dale G.
-
I've started managing my own investments so view Michael's site as a one-stop shop from which to get information and perspectives.
~ Dave E.
-
Michael offers easy reading, honest, common sense information that anyone can use in a practical manner.
~ der_al.
-
A sane voice in a scrambled investment world.
~ Ed R.
Inside Edge Pro Contributors

Greg Weldon

Josef Schachter

Tyler Bollhorn

Ryan Irvine

Paul Beattie

Martin Straith

Patrick Ceresna

Mark Leibovit

James Thorne

Victor Adair