
Stocks & Equities
 Cobalt prices continue to rise on increasing demand for electric vehicles. Tesla (NADASQ:TSLA) remains a hot topic, and many investors are closely watching for the company’s next move — most recently, CEO Elon Musk confirmed that production of Model 3 cars will start on Friday (July 7), and should reach 20,000 units per month by December.
Mass production of lithium-ion batteries will be needed to power these electric cars, which are forecast to number 3.1 million in 2021, according to UBS (NYSE:UBS). And as demand for batteries surges, prices for metals such as cobalt are also expected to soar. In fact, Benchmark Mineral Intelligence analyst Caspar Rawlessaid recently that by 2020 cobalt demand will increase to 76,000 tonnes from 46,000 tonnes in 2016.
In light of those developments, investors interested in the cobalt space are growing more and more interested in cobalt stocks. To help provide a picture of which cobalt-focused companies are making progress this year, we’ve put together a brief overview of the three cobalt stocks on the TSX that have seen the largest share price gains year-to-date. Read on to learn what they’ve been up to in 2017.
1. Katanga Mining (TSX:KAT)
Current price: $0.58; year-to-date gain: 314.29 percent
Major miner Glencore (LSE:GLEN) increased its interest in Katanga Mining to about 86.33 percent earlier this year. The company operates a large-scale copper-cobalt mine complex in the Democratic Republic of Congo through two joint ventures; the joint ventures are called Kamoto Copper Company and DRC Copper and Cobalt Project.
In 2015, the company announced the decision to suspend the processing of copper and cobalt during the construction phase of its whole ore leach project. The suspension continued through the first two quarters of 2017, and production is not expected to resume until the project is commissioned; that process is expected to commence in Q4 2017.
2. eCobalt Solutions (TSX:ECS)
Current price: $1.17; year-to-date gain: 116.67 percent
eCobalt Solutions is focused on providing battery-grade cobalt salts that are ethically sourced, environmentally sound and produced safely and responsibly in the US. eCobalt’s primary asset is its Idaho cobalt project located in Lemhi County, Idaho.
In the second quarter of 2017, the company continued working on the feasibility study for its Idaho project. In June, eCobalt provided an operational update to its shareholders, noting that it has made progress in several areas.
3. Fortune Minerals (TSX:FT)
Current price: $0.20; year-to-date gain: 60 percent
Fortune Minerals expects to benefit from the development of its NICO cobalt-gold-bismuth-copper project, located in Canada’s Northwest Territories. The plan is for bulk concentrates from NICO to be shipped to a planned metals processing plant in Saskatchewan. The company is positioned to become a Canadian producer of battery-grade cobalt chemicals with gold and bismuth co-products.
In March, the company closed a bought-deal financing for $6,450,000, and said it expects to use the proceeds for NICO. In April, the company provided an update on its feasibility study for the project.
The data for this article was retrieved on July 5, 2017 using The Globe and Mail’s market data filter. Only TSX-listed cobalt companies with market capitalizations greater than $50 million are included.

Briefly: In our opinion, full (100% of the regular full position) speculative short positions in gold, silver and mining stocks are justified from the risk/reward perspective at the moment of publishing this alert.
Gold and silver didn’t continue Monday’s plunge, but they didn’t erase it either. Have we just seen a reversal or just a normal, healthy pause after a sharp move?
The former seems more likely and the price levels that were reached (and those that were not) provide the details. Let’s move right to the charts (chart courtesy of http://stockcharts.com).
Gold
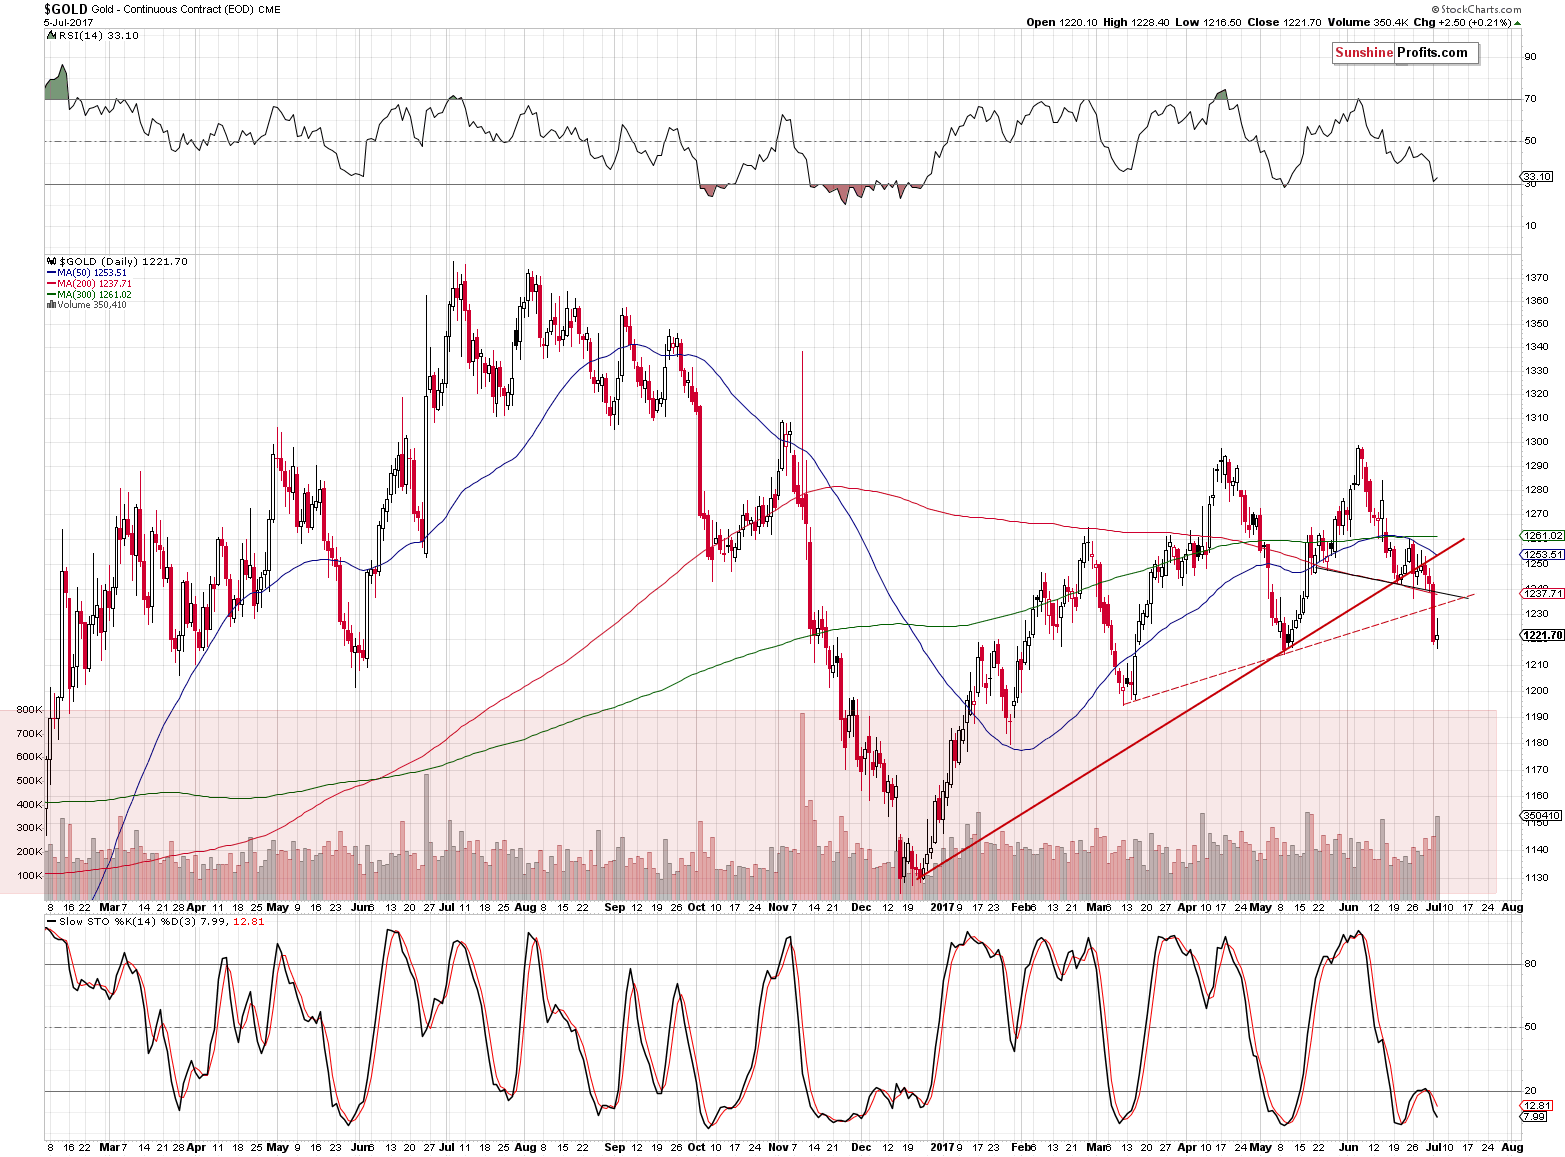
Gold moved back up on an intra-day basis, but finally ended the session without significant changes. At the moment of writing these words, gold is trading at about $1,223, so the situation didn’t change much overnight either. Please note that the volume that accompanied yesterday’s back and forth movement was significant, but the same was the case on June 14th – back then it was only a pause within the decline. Consequently, it doesn’t seem that the sizable volume is a bullish sign at this time.
The RSI indicator is close to 30, however, the comeback of the regular gold-USD link and the situation in the USD and Euro Indices seems to be much more important. After all, if gold is to move below the 2015 low this winter, then it’s about time it started a bigger decline, and during bigger moves, the daily RSI can stay below 30 for prolonged periods (November and December 2016 serve as examples).
Silver
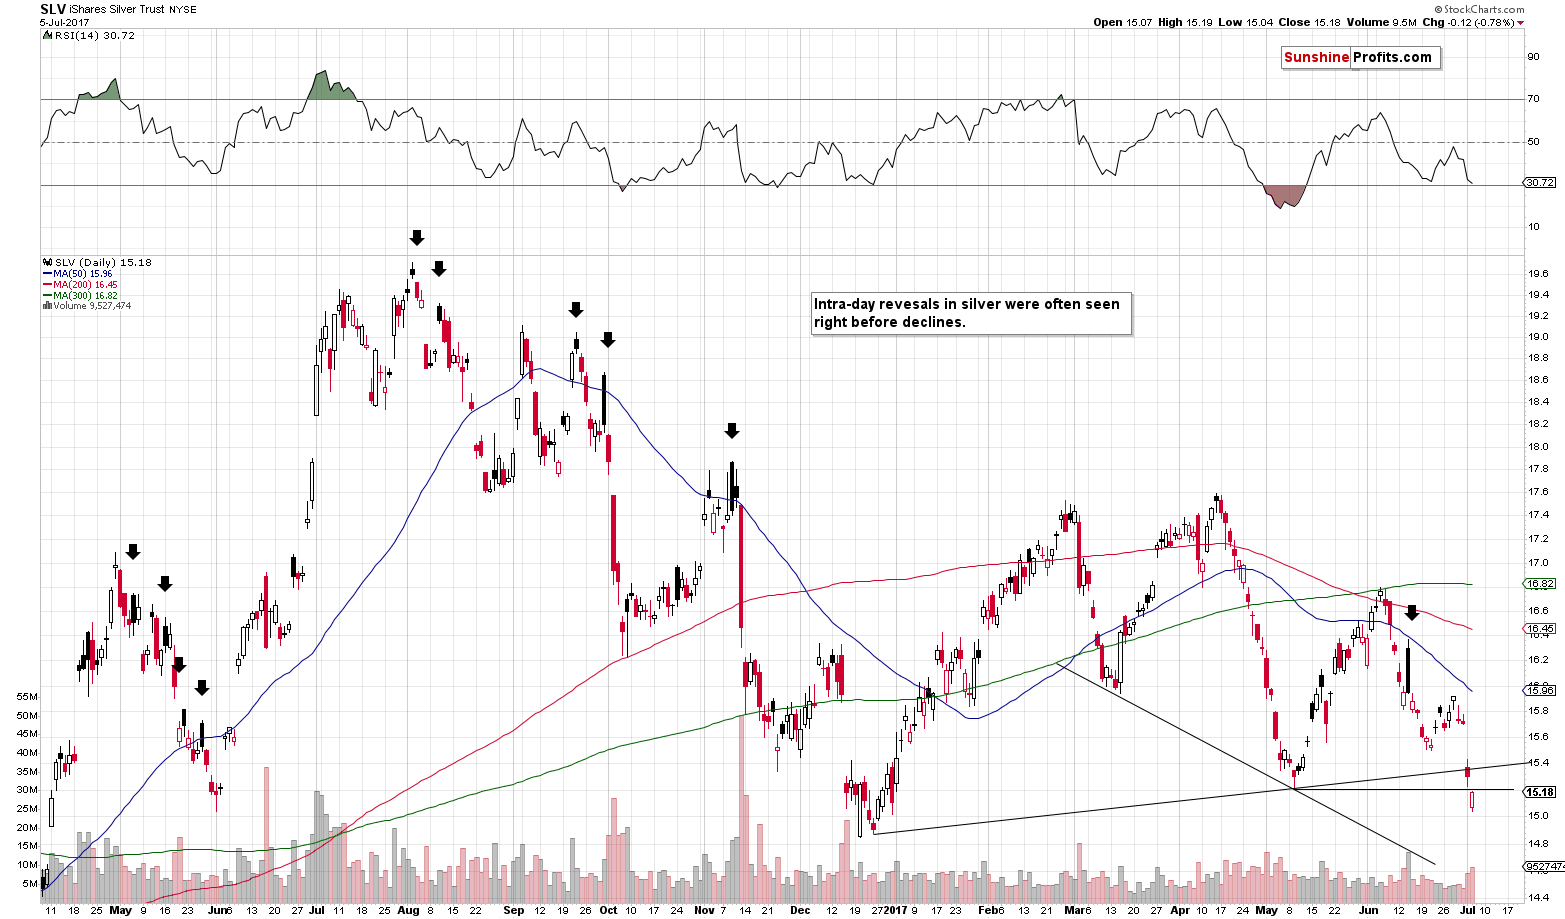
The SLV ETF chart shows that silver moved a bit higher, but not above any important support/resistance line that it had previously broken. It remains below the May low and below the rising resistance line. Consequently, it doesn’t seem that anything changed based on yesterday’s session.
Yen
In yesterday’s alert, we wrote the following on the Japanese yen:
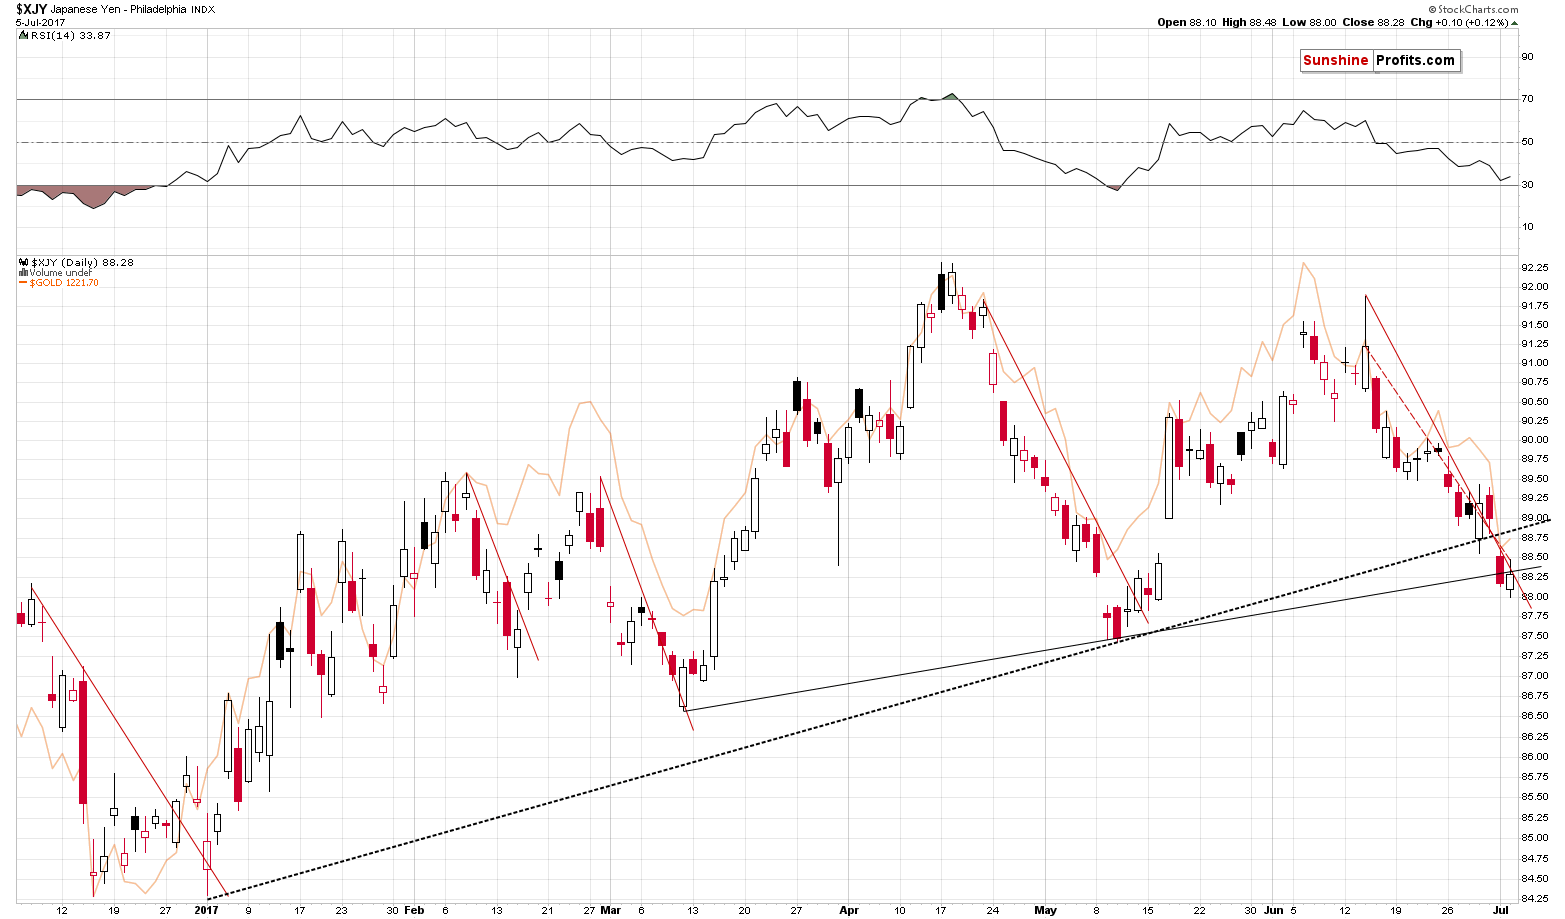
The yen did something unlikely – even though it had moved to support levels and broke above the resistance line (and it still seems that taking profits from the trading position in this currency pair was justified), it declined sharply on Monday, breaking through (and closing below) 3 support lines: the short-term one based on the recent tops and 2 medium-term ones based on previous lows. The short-term outlook for the Japanese yen has just deteriorated substantially.
(…) the change in the short-term outlook implies that the 2017 corrective upswing is over and that the yen can now move substantially lower (below the 2016 low and quite possibly below the 2015 low as well). Given the strong gold-yen link, the above has profoundly bearish implications for the precious metals market.
During yesterday’s session, the yen moved somewhat higher, but not above any important resistance level. Consequently, nothing changed from the technical point of view and the outlook for the yen – and for gold – remains bearish.
Gold to S&P Ratio
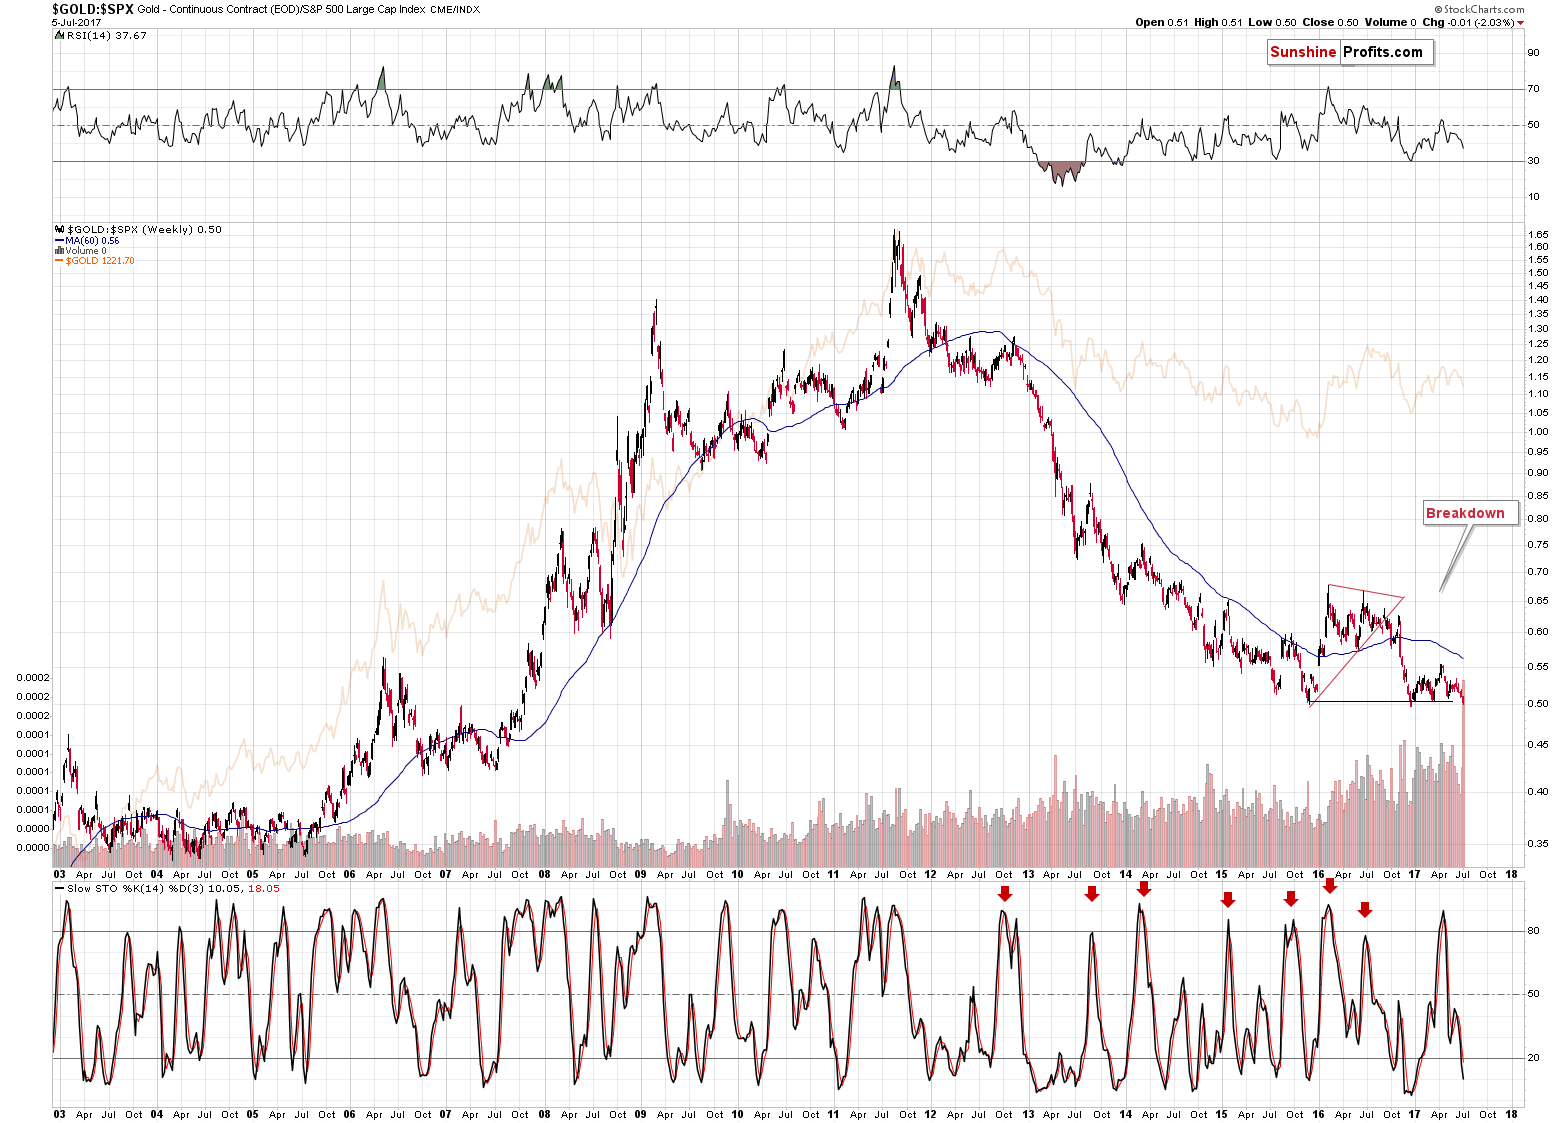
Finally, we would like to remind you of a very specific situation in the ratio between gold and the broad stock market. This ratio moves along with gold and visible divergences can tell a lot about gold’s next big move.
In early 2011, the ratio was reluctant to break above the previous high and it only did so by an insignificant amount – this divergence heralded declines and we have indeed seen a major top.
In the second half of 2012, the ratio barely moved higher even though gold moved quite close to its 2011 top. This major divergence indicated trouble ahead and that’s exactly what the gold market got – the yellow metal declined very substantially in the following months.
We are currently once again in a situation in which the ratio moved lower and it appears ready to break to much lower levels. Will gold follow? That’s exactly what happened in the previous cases, so why should this time be any different?
The ratio formed a very specific price pattern (actually two patterns) and it’s about to complete them. The ratio formed a head-and-shoulders pattern (this year’s performance) as a right shoulder of a bigger head-and-shoulders pattern (the second half of 2015 being the left shoulder and the 2016 performance being the head). Once gold moves lower while stocks rally, the ratio is likely to plunge further and based on the mentioned patterns, the move is not likely to be minor. The target based on the size of the head suggests a repeat of the 2016 decline in the ratio – or a bigger decline, which could correspond to a move to the ratio’s 2003-2005 lows. What could the gold price do? It could repeat what happened during the previous big slide of the ratio – the 2013 decline. This methodology would imply gold at about $900, which is in tune with our downside target for gold based on other techniques.
Summing up, it seems that yesterday’s price move was a natural pause after a sharp decline and not a major reversal. The short-term outlook remains bearish.
Most importantly, however, please keep in mind that the biggest buying opportunity for the precious metals is likely just months (not years) away.
As always, we will keep you – our subscribers – informed.
To summarize:
Trading capital (supplementary part of the portfolio; our opinion): Short positions (100% of the full position) in gold, silver and mining stocks are justified from the risk/reward perspective with the following stop-loss orders and initial target price levels / profit-take orders:
- Gold: exit-profit-take level: $1,063; stop-loss: $1,317; initial target price for the DGLD ETN: $81.88; stop-loss for the DGLD ETN $44.57
- Silver: initial target price: $13.12; stop-loss: $19.22; initial target price for the DSLV ETN: $46.18; stop-loss for the DSLV ETN $17.93
- Mining stocks (price levels for the GDX ETF): initial target price: $9.34; stop-loss: $26.34; initial target price for the DUST ETF: $143.56; stop-loss for the DUST ETF $21.37
In case one wants to bet on junior mining stocks’ prices (we do not suggest doing so – we think senior mining stocks are more predictable in the case of short-term trades – if one wants to do it anyway, we provide the details), here are the stop-loss details and initial target prices:
- GDXJ ETF: initial target price: $14.13; stop-loss: $45.31
- JNUG ETF: initial target price: $417.04; stop-loss: $43.12
Long-term capital (core part of the portfolio; our opinion): No positions (in other words: cash)
Insurance capital (core part of the portfolio; our opinion): Full position
Please note that the in the trading section we describe the situation for the day that the alert is posted. In other words, it we are writing about a speculative position, it means that it is up-to-date on the day it was posted. We are also featuring the initial target prices, so that you can decide whether keeping a position on a given day is something that is in tune with your approach (some moves are too small for medium-term traders and some might appear too big for day-traders).
Plus, you might want to read why our stop-loss orders are usually relatively far from the current price.
Please note that a full position doesn’t mean using all of the capital for a given trade. You will find details on our thoughts on gold portfolio structuring in the Key Insights section on our website.
As a reminder – “initial target price” means exactly that – an “initial” one, it’s not a price level at which we suggest closing positions. If this becomes the case (like it did in the previous trade) we will refer to these levels as levels of exit orders (exactly as we’ve done previously). Stop-loss levels, however, are naturally not “initial”, but something that, in our opinion, might be entered as an order.
Since it is impossible to synchronize target prices and stop-loss levels for all the ETFs and ETNs with the main markets that we provide these levels for (gold, silver and mining stocks – the GDX ETF), the stop-loss levels and target prices for other ETNs and ETF (among other: UGLD, DGLD, USLV, DSLV, NUGT, DUST, JNUG, JDST) are provided as supplementary, and not as “final”. This means that if a stop-loss or a target level is reached for any of the “additional instruments” (DGLD for instance), but not for the “main instrument” (gold in this case), we will view positions in both gold and DGLD as still open and the stop-loss for DGLD would have to be moved lower. On the other hand, if gold moves to a stop-loss level but DGLD doesn’t, then we will view both positions (in gold and DGLD) as closed. In other words, since it’s not possible to be 100% certain that each related instrument moves to a given level when the underlying instrument does, we can’t provide levels that would be binding. The levels that we do provide are our best estimate of the levels that will correspond to the levels in the underlying assets, but it will be the underlying assets that one will need to focus on regarding the signs pointing to closing a given position or keeping it open. We might adjust the levels in the “additional instruments” without adjusting the levels in the “main instruments”, which will simply mean that we have improved our estimation of these levels, not that we changed our outlook on the markets. We are already working on a tool that would update these levels on a daily basis for the most popular ETFs, ETNs and individual mining stocks.
Our preferred ways to invest in and to trade gold along with the reasoning can be found in the how to buy gold section. Additionally, our preferred ETFs and ETNs can be found in our Gold & Silver ETF Ranking.
As always, we’ll keep you – our subscribers – updated should our views on the market change. We will continue to send out Gold & Silver Trading Alerts on each trading day and we will send additional Alerts whenever appropriate.
The trading position presented above is the netted version of positions based on subjective signals (opinion) from your Editor, and the Tools and Indicators.
The past decade’s historically low interest rates convinced millions of Americans to buy cars they could only afford with hyper-cheap credit. This made auto sales one of the drivers of the recovery, but it also left far too many people with underwater “car mortgages” that will limit their spending on other things and prevent them from buying their next car until sometime in the 2020s.
Like all artificial (that is, credit-driven) booms, this had to end eventually, and it’s looking like now is the time:
U.S. Auto Makers Post Sharp Sales Decline in June
(Wall Street Journal) – Detroit’s car companies reported steep sales declines in June, capping a bumpy first half of the year for the U.S. auto industry and setting a bleak tone for the summer selling season.
The reports, released Monday, come as analysts expect overall auto sales to have fallen more than 2% in June compared with the prior year, according to JD Power. The firm said the industry’s selling pace hit its lowest point since 2014 over the first six months of 2017, and traffic at dealerships—measured by retail sales—fell to a five-year nadir in June.
Edmunds.com, a consumer-research company, said buyers are stretching more than ever to afford cars and trucks that are growing increasingly more expensive due to a barrage of safety gear and connectivity options. The firm estimates the average auto-loan length reached a high of 69.3 months in June, with the average amount of financing reaching $30,945, up $631 from May.
General Motors Co. GM +2.91% said U.S. sales fell 5% to 243,155 vehicles, while Ford Motor Co. F +4.07% said sales totaled 227,979 vehicles, down 5.1% from a year earlier, and Fiat Chrysler Automobiles N.V. posted a 7% decline to 187,348 vehicles.
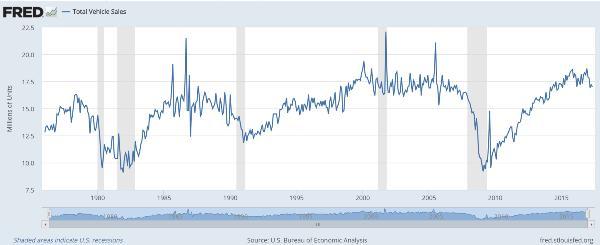
The following charts show a steady rise in car sales and inventories from their 2009 low to a 2015-2016 peak. If they’ve shifted into a cyclical decline the bottom, based on history, is a long way down.

Meanwhile, the cheap lease deals of the past few years are starting to run off, producing a tidal wave of nearly-new used cars to compete with much more expensive new ones. The result: falling used car prices that will, over time, cut demand for new cars even further.
Used cars are getting cheaper: CarMax
(Fox News) – CarMax (KMX), the nation’s largest used-car retailer, reported a decline in selling prices during its fiscal first quarter.
Used-car prices are expected to decline this year, as vehicles leased during the U.S. auto sales boom in recent years begin to hit the market. Manufacturers and dealers are closely watching price trends because cheaper used cars could soften demand for new vehicles .
CarMax CEO Bill Nash said Wednesday the Richmond, Virginia-based dealership chain has already seen an influx of off-lease vehicles, which is driving prices lower.
“As more of them come in, prices will continue to drop,” Nash told analysts during a conference call.
The trend put downward pressure on CarMax’s average selling prices for the first quarter, offsetting a high mix of more expensive pickup trucks and SUVs. CarMax sold used vehicles for $19,478 on average, a 1.9% drop from the year-ago quarter’s average selling price of $19,858. Prices for wholesale vehicles also fell 2.9% to $5,113.
This is obviously bad news for an economy dependent on people buying stuff they don’t need with money they don’t have. So other things being equal, expect disappointing numbers for GDP, inflation, wages, etc., going forward as this major industry morphs from tailwind to headwind.
And expect the process of interest rate normalization to become an even harder sell for the Fed, which needs a boom to justify making loans more expensive for tomorrow’s car and house buyers. As the saying goes, it’s inflate or die.
It appears the US Dollar has bottomed following an intermediate degree correction. This suggests that the dollar will rally for 6-8 weeks while gold heads lower. Gold has decisively broken down through its 200 dma. Traders are in a bull market mentality and will try to buy gold’s dips until sentiment becomes bearish. Expect gold to continue lower over the next 4- 8 weeks.


 What we have is a totally propped-up market based upon debt. Energy isn’t producing positive growth, really. So instead of having real economic growth, we have inflated economic growth and inflated asset values.
When growth starts to decline, I think we’re going to see the valuations of assets decline considerably. It’s anyone’s guess how quickly they can fall, but according to what I have been looking at, I think we are going to see a 50% decrease in real estate values right off the bat. I am not saying this will happen in a day, but the first wave will be a 30-50% decrease in real estate values when the markets really start to crack. They are already at the edge of the cliff — and I see prices falling down the cliff, struggling to recover, and then falling even further. Actually, I predict within the next 5-10 years, we can easily see a 75% or more reduction in real estate values.
This was part of my interview with Chris Martenson at Peak Prosperity. During the interview Chris and I discussed how the disintegrating energy industry would negatively impact the value of most assets…. Stocks, Bonds and Real Estate, while the precious metals would ultimately be the higher quality safe haven and store of value.
Out of all the analysts in the alternative media, I find that Chris Martenson’s work at Peak Prosperity gets closer to the root of the problem as it pertains to the future of our financial system and economic markets. This is due to the fact that Chris focuses on energy and the Falling EROI – Energy Returned On Investment.
Unfortunately, most precious metals and resource analysts overlook energy. Thus, their analysis is likely flawed because they view the future as a continuation of “business as usual”, once the debts and leverage are taken out of the system. This is an incorrect assumption, because the debt and leverage actually have allowed our financial system and markets to continue to function well beyond its expiration date. Getting rid of the debt and leverage would cause a collapse of the system… one that we will be unable to grow back out of.
Lastly, I believe it is important to continue focusing on the information and data as it changes. This will provide the investor-public with a guideline as to the timing of the upcoming disintegration of our highly leveraged debt based financial market.
You can also access my interview with Chris here: Steve St. Angelo: Prepare For Asset Price Declines Of 50-75%
Also, if you have not watched Chris Martenson’s CRASH COARSE, I would highly recommend it.


-
I know Mike is a very solid investor and respect his opinions very much. So if he says pay attention to this or that - I will.
~ Dale G.
-
I've started managing my own investments so view Michael's site as a one-stop shop from which to get information and perspectives.
~ Dave E.
-
Michael offers easy reading, honest, common sense information that anyone can use in a practical manner.
~ der_al.
-
A sane voice in a scrambled investment world.
~ Ed R.
Inside Edge Pro Contributors

Greg Weldon

Josef Schachter

Tyler Bollhorn

Ryan Irvine

Paul Beattie

Martin Straith

Patrick Ceresna

Mark Leibovit

James Thorne

Victor Adair