
Gold & Precious Metals
June 25th/2017 – Gold and especially gold mining stocks rebounded on Wednesday and trended higher into the weekend. This is giving some investors renewed hopes that the bull market that began roughly 18 months ago is about to reassert itself. We cannot know for sure yet but what we can say is precious metals are nearing a big move. Gold and gold stocks have traded in tight ranges which will compress further while volatility indicators approach multi-year lows. This is the setup for a break and then a powerful move with increasing momentum and volatility.
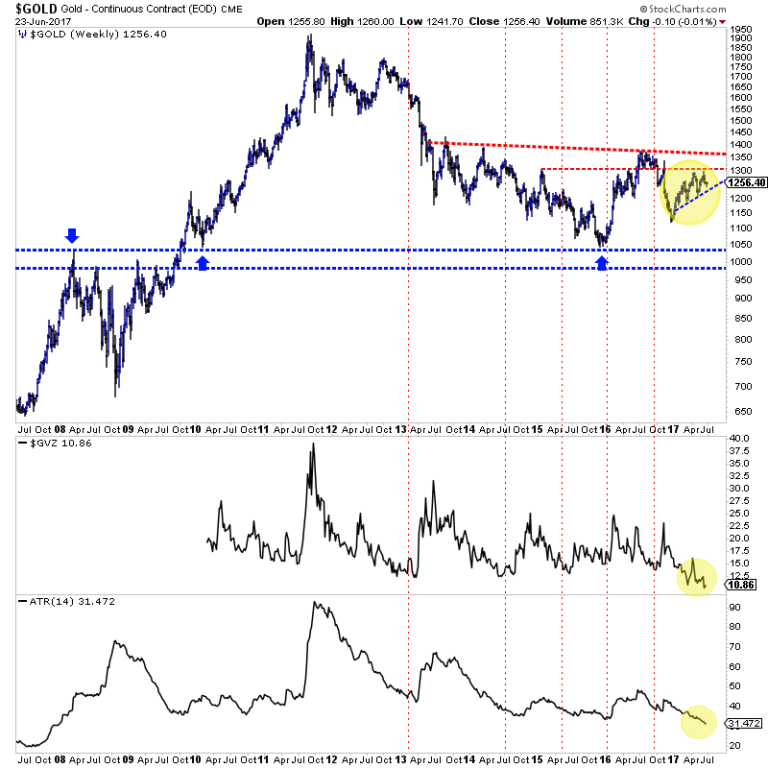
First let’s take a look at Gold. Its weekly bar chart is shown (going back 10 years) with two volatility indicators at the bottom. One is the GVZ contract and one is the average true range (ATR) indicator. The ATR indicator is at a 10-year low while GVZ is near an 8-year low. Gold has tested major resistance ($1300) twice and failed both times. If Gold loses its 2017 uptrend (support is around $1230) then it is susceptible to an accelerated decline with increasing volatility and momentum. On the other hand, if Gold could bust through $1300 and then consolidate around $1350, it could setup that anticipated breakout through $1350-$1375.
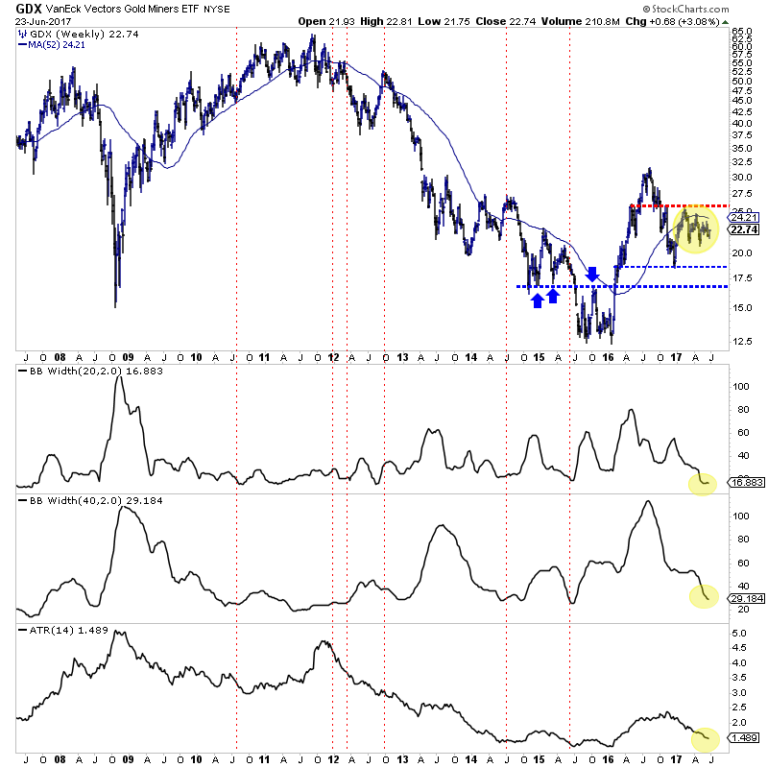
Turning to the gold stocks, we plot a 10-year bar chart of GDX along with the ATR indicator and the bollinger band width for two periods (20 and 40 weeks). These volatility indicators are trending down and approaching multi-year lows. This is not a surprise as GDX has traded in a tighter and tighter range since January 2017. Specifically, GDX has traded in a descending triangle pattern which, if GDX breaks $21 to the downside has a downside target of $17. The bullish outcome would entail GDX rallying to $25 and then breaking higher after a consolidation.
The bulls are cheering this latest rebound but they have a lot more work to do if the next big move is going to be higher. First things first, Gold needs to break $1300 and GDX needs to retest $25 again. The short-term trend could be higher now but until the Gold sector can attain those marks then the bias for the next big move (due to among other reasons the relative weakness in Silver and gold stocks) should remain to the downside. That is why we remain cautious.
Jordan Roy-Byrne CMT, MFTA
For professional guidance and our favorite junior exploration companies go HERE

Todd Market Forecast for Tuesday June 27, 2017 6:00 P.M. Eastern, 3:00 Pacific.
DOW – 99 on 850 net declines
NASDAQ COMP – 101 on 900 net declines
SHORT TERM TREND Bullish
INTERMEDIATE TERM Bullish
STOCKS: Our short term gauges have a very good record, but they’re not perfect. This is especially true if an unexpected event hits the markets.
Today, news that the Senate would not vote on the Republican health care bill until after the 4th of July called into question the Trump agenda which had supported the markets. It obviously means that Senate leaders are having trouble lining up votes.
In addition, Mario Draghi of the ECB made some comments about inflation that sent European and U.S. bonds sharply lower and European stocks were also hit.
But help may be on the way. Check the chart.
GOLD: Gold could only manage a gain of $4, in spite of the dollar’s collapse. This should get interesting.
CHART Five day RSI is back to oversold levels. This is normally a positive for the next couple of weeks.

BOTTOM LINE: (Trading)
Our intermediate term system is on a buy.
System 7 We are in cash. Stay there.
System 8 We are long the SSO from 91.04. If the S&P 500 is lower at 12:45 EST on Wednesday, sell at the close. More in “interesting stuff” section below.
System 9 We are in cash. Stay there.
NEWS AND FUNDAMENTALS: The Case-Shiller Home Price Index rose 0.3%, less than the expected rise of 0.6%. Consumer confidence came in at 118.9, better than last month’s 117.6. On Wednesday we get the trade deficit and oil inventories.
INTERESTING STUFF: I have been using the breadth statistics, in other words, the advancing issues vs declining issues for exiting our trading positions. —–However, these stats aren’t readily available to everyone so we will move more toward looking at the S&P 500 change.
Advance – decline stats used to be on CNBC and other financial stations, but have become less available in recent years. This is good. Breadth indicators are very effective, but especially so if fewer people are using them. —–And we will continue to utilize them in our analysis.
NEWS AND FUNDAMENTALS: The Case-Shiller Home Price Index rose 0.3%, less than the expected rise of 0.6%. Consumer confidence came in at 118.9, better than last month’s 117.6. On Wednesday we get the trade deficit and oil inventories.
TORONTO EXCHAN GE: Toronto was down 35
BONDS: Bonds were down sharply.
THE REST: The dollar collapsed on Tuesday. Crude oil surged.
Bonds –Change to bearish as of June 27.
U.S. dollar -Change to bearish as of June 27.
Euro — Change to bullish as of June 27.
Gold —-Bullish as of June 23.
Silver—- Bullish as of June 23.
Crude oil —- Change to bullish as of June 27.
Toronto Stock Exchange—- Bearish as of June 14, 2017.
We are on a long term buy signal for the markets of the U.S., Canada, Britain, Germany and France.

Monetary conditions (+2 means the Fed is actively dropping rates; +1 means a bias toward easing. 0 means neutral, -1 means a bias toward tightening, -2 means actively raising rates). RSI (30 or below is oversold, 80 or above is overbought). McClellan Oscillator ( minus 100 is oversold. Plus 100 is overbought). Composite Gauge (5 or below is negative, 13 or above is positive). Composite Gauge five day m.a. (8.0 or below is overbought. 13.0 or above is oversold). CBOE Put Call Ratio ( .80 or below is a negative. 1.00 or above is a positive). Volatility Index, VIX (low teens bearish, high twenties bullish), VIX % single day change. + 5 or greater bullish. -5 or less, bearish. VIX % change 5 day m.a. +3.0 or above bullish, -3.0 or below, bearish. Advances minus declines three day m.a.( +500 is bearish. – 500 is bullish). Supply Demand 5 day m.a. (.45 or below is a positive. .80 or above is a negative). Trading Index (TRIN) 1.40 or above bullish. No level for bearish.
No guarantees are made. Traders can and do lose money. The publisher may take positions in recommended securities.

Quotable
“I sneezed and lost sight of the skylark.” –Yayu (taken from Zen in the Markets)
Commentary & Analysis
US dollar getting hammered; the pound still an open question on the spread…
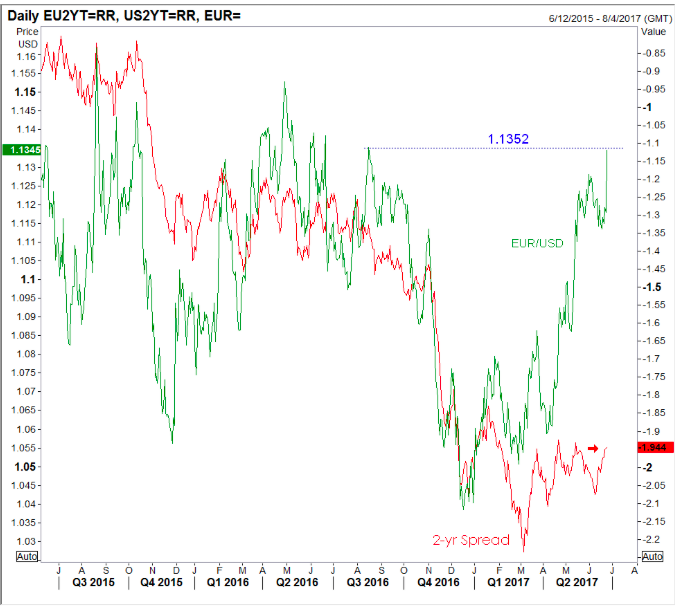
Today, real world developments in the form of an extremely surprising bullish speech from European Central Bank President Mario Draghi triggered prevailing expectations in a very positive way for the euro—it is soaring against the dollar.
The Eurozone-United States 2- year yield spread is sharply higher with the currency; i.e. the eurozone’s 2-year yields are rising sharply today, faster than US 2-year yields, as the players show their expectation the ECB will hike sooner rather than later thanks to Mr. Draghi’s talk. The chart shows the price of EUR/USD versus the 2-year Spread…
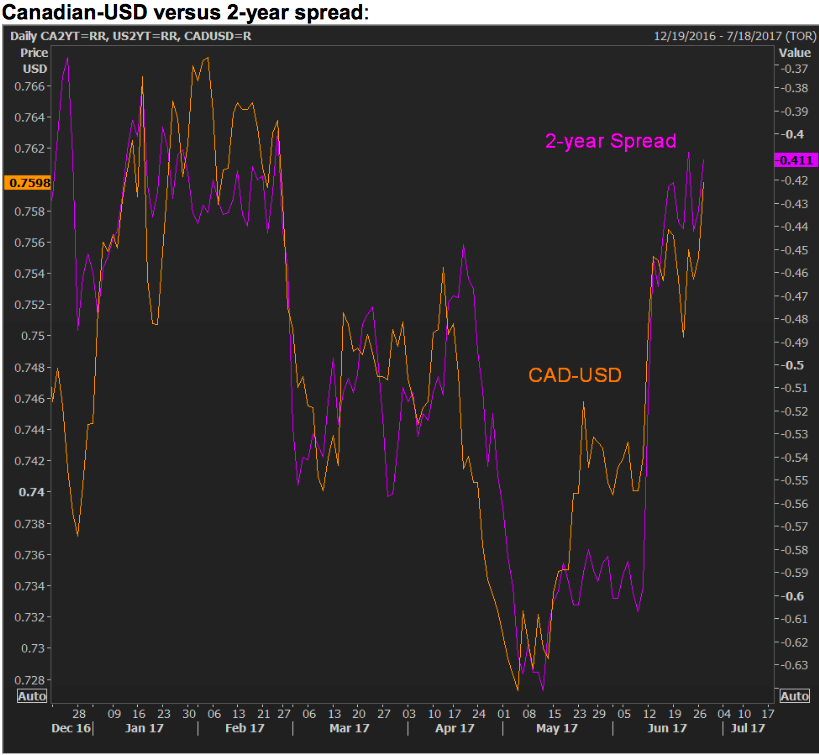
Interestingly, the major currencies rising sharply today against the US dollar, including CAD and the British pound, are doing so on the back of an rising 2-year spreads relative to the United States.
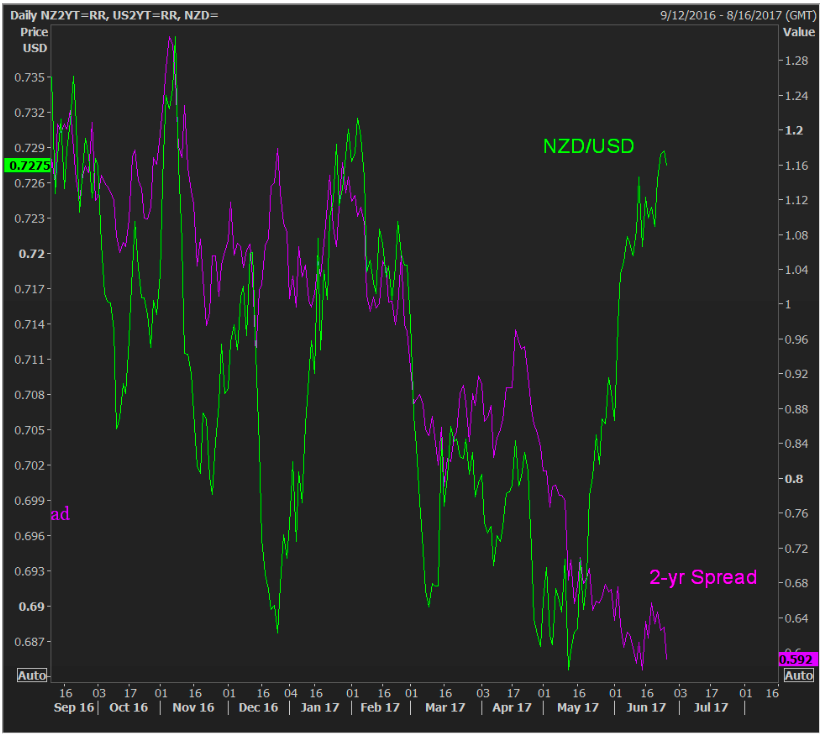
And a currency trading lower is the one with a falling spread against the US—the New Zealand Dollar:
…ditto for the Japanese yen; it is weaker on a lower relative spread in Japan compared to the United States.
But what shouldn’t be lost here is the fact US rates rose sharply today. Below a chart benchmark us yields for 2’s/10’s/30’ (8-hour chart):
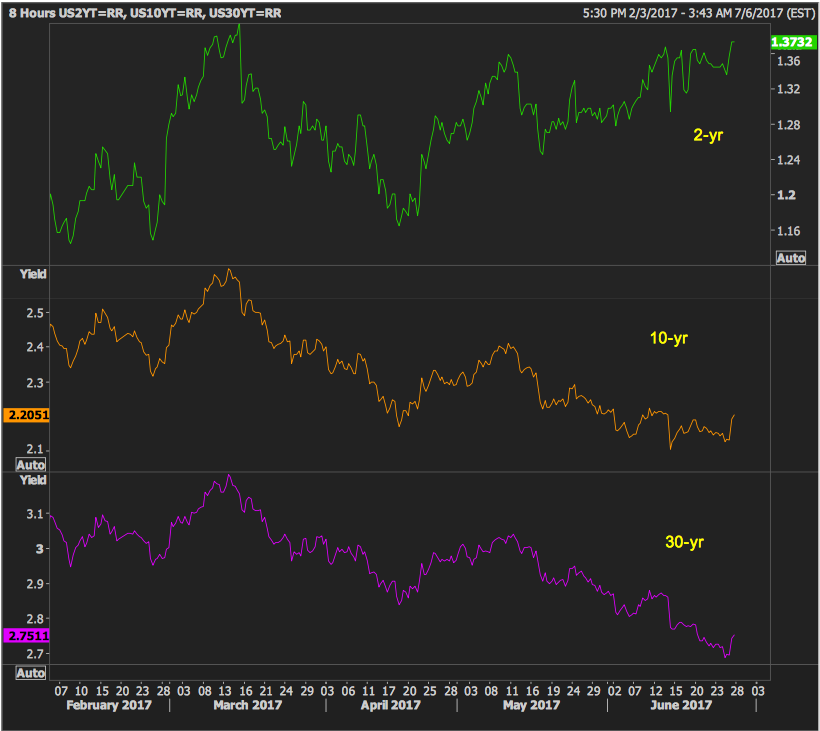
And the move in the long-end was greater than the short end; leading to a widening of the spread between US 10’s vs 2’s (see next page).
This is important, possibly for two reasons: 1) The 10-2 spread is viewed as an important barometer for US growth; i.e. a falling spread indicates a slowdown; and a rising spread vice versa; and 2) this spread has been highly correlated with the US dollar lately, as you can see in the chart below.
The 10-2 spread (gold line) the US dollar index (purple line): Despite a rise in the spread here, the US dollar made a fresh new low.
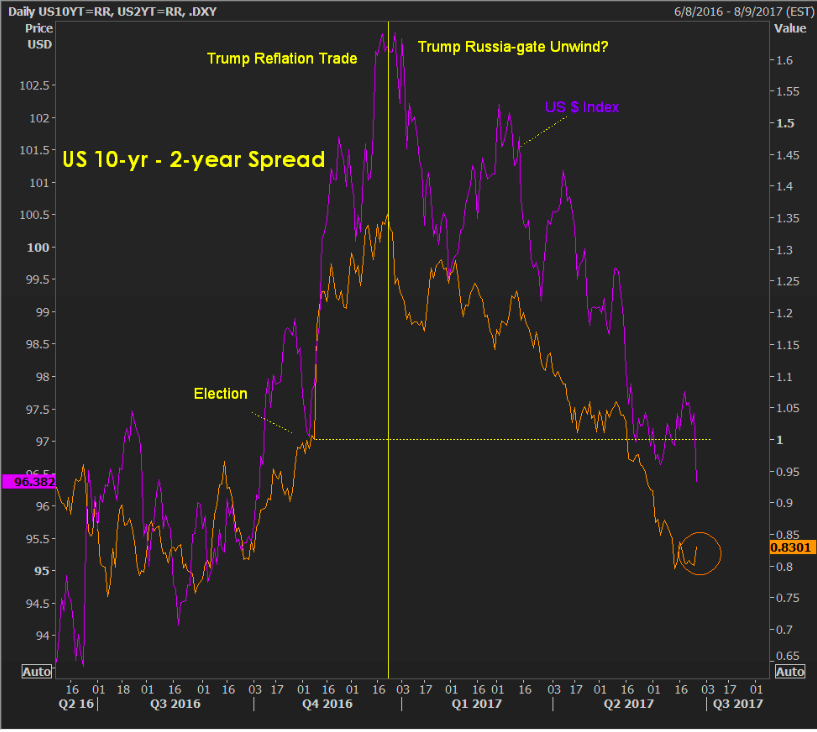
So, despite the complete hammering of the dollar index, primarily because of the euro’s rally (it represents about 57% of the index value) just maybe the dollar isn’t quite done yet.
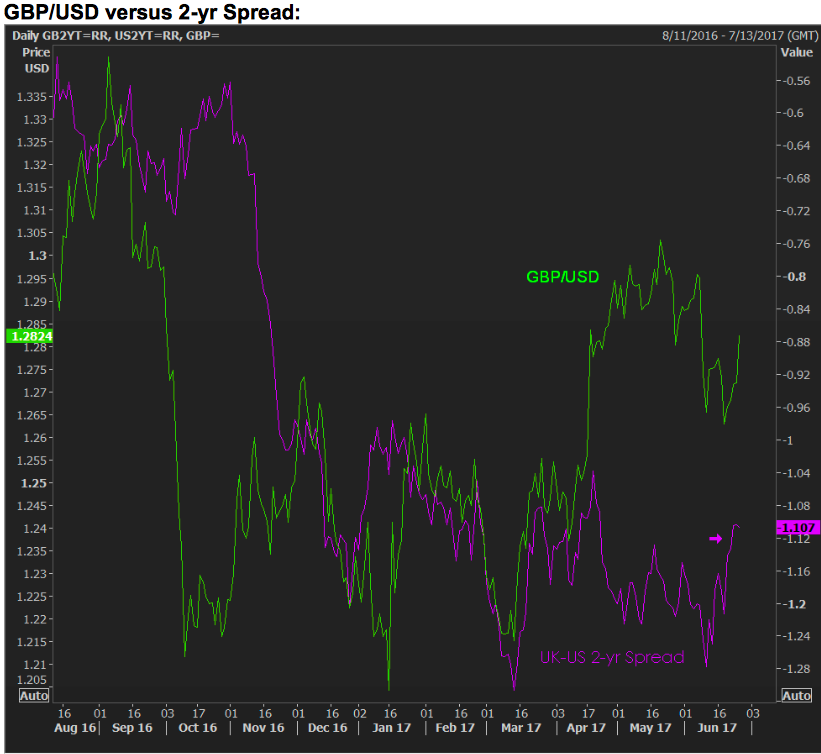
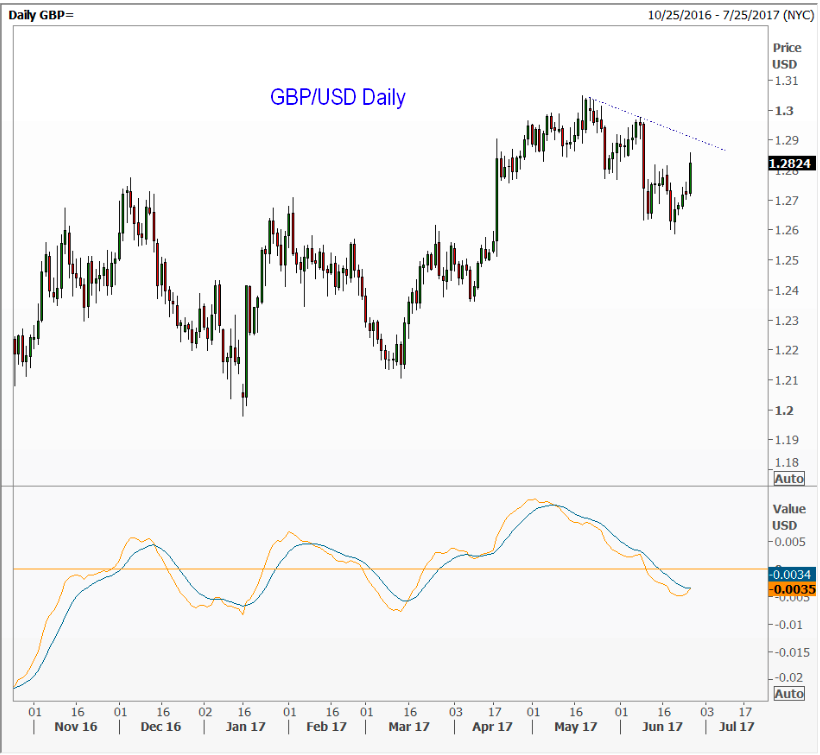
I think traders are right to more bullish expectations about both the ECB and Canadian central banks’ future rate view, as both economies have been putting in better than expected numbers. But the question remains wide open for the Bank of England.
Yields did rise today in the UK, but the news wasn’t exactly stellar—the BOE wants banks to hold a greater capital buffer given the risks in the economy. This says the economy is not very strong and therefore likely rate hikes from the bank may be pushed out further than market players now expect.
So, despite being blown out of our short GBP/USD position, we will be watching to see if Mr. Market decides to do a re-think when it comes to the UK-US yield spread. If it does, and the UK-US spread falls while the US 10 vs 2 spread rises, the pound might be vulnerable again.
Jack Crooks
President, Black Swan Capital
www.blackswantrading.com 772-349-6883
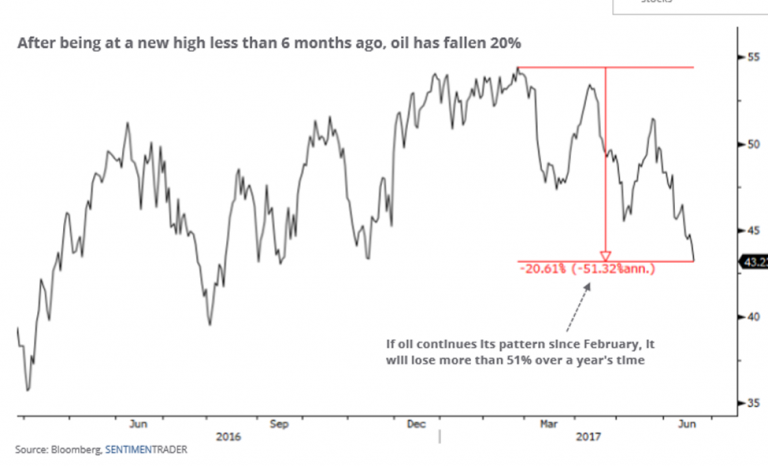
The newest bear market is in crude oil. The definition of a bear market is when an ‘asset class’ is down more than 20% from its recent high: (Bear Market Rally Definition Investopedia). It has been more than five years since the market fell so hard so fast from its’ high. Two months later, it was even lower. During the past 20 years, the SPX has struggled when oil fell into a bear market!

WTI Crude Oil Now Technically Bearish

Most oil companies are now adjusting to “lower for longer.”
The Wall Street Journal reports that “most in the oil industry are resigned to low prices for years to come, recognizing that a range of $50 to $60 might be a semi-permanent equilibrium.”
Between 2014 and 2015, 105 oil producers and 120 oilfield service companies went through bankruptcy.
Conclusion:
In short, these extreme price movements and key support levels can provide some fantastic opportunities to trade oil like my last trade in SCO for a 21% move a couple weeks ago. If you want to get involved in the next oil ETF trade subscribe here: www.TheGoldAndOilGuy.com
Chris Vermeulen

-
I know Mike is a very solid investor and respect his opinions very much. So if he says pay attention to this or that - I will.
~ Dale G.
-
I've started managing my own investments so view Michael's site as a one-stop shop from which to get information and perspectives.
~ Dave E.
-
Michael offers easy reading, honest, common sense information that anyone can use in a practical manner.
~ der_al.
-
A sane voice in a scrambled investment world.
~ Ed R.
Inside Edge Pro Contributors

Greg Weldon

Josef Schachter

Tyler Bollhorn

Ryan Irvine

Paul Beattie

Martin Straith

Patrick Ceresna

Mark Leibovit

James Thorne

Victor Adair