
Timing & trends
 In this week’s issue:

In This Week’s Issue:
– Stockscores’ Market Minutes Video – The Profit is in the Patience
– Stockscores Trader Training – Fussy Traders Do Better
– Stock Features of the Week – Stockscores Simple Weekly, under $10
Stockscores Market Minutes – Prioritize Your Trades
Your winners have to pay for your inevitable losers. This week, I discuss the importance of having patience with your winners and how to know when it is time to exit them. Then, my weekly market analysis which highlights why June has been a poor month for short term trading. Finally, my trade of the week on CPRX. Click Here to Watch
To get instant updates when I upload a new video, subscribe to the Stockscores YouTube Channel
Trader Training – Fussy Traders Do Better
Traders, particularly those who need to make money rather than those who would like to make money, tend to have a fear of missing out. They hear about a trading idea or find an opportunity with their own effort and make the trade with less thought than they might put into buying a microwave. They can invest thousands of dollars on an impulse, much like the drunken gambler who throws down $1000 on Five Red.
One reason for this sort of reckless approach to trading is the belief that trading ideas are like gifts. They only come along from time to time and you should feel grateful for the opportunity. If you spend 10 hours researching a company or receive the occasional bit of insight from someone who should know more than the rest of us, it’s easy to understand why you wouldn’t want to let a seemingly promising trade slip through your fingers. The problem is that this gratitude for trading ideas leads you to lower your standards and place trades that are not much more than a gamble.
Have you ever made a trade and then, just a few minutes or days later, asked yourself what the heck you were thinking? If you are normal, then it’s likely that you have because it is easy to focus on the dream of making a profit. You should focus your attention on the trading situation as it has been presented to you by the market rather than the words of an expert. Some trading opportunities are so well marketed that it’s hard to see the truth because you fixate on the profit potential that has been dangled before you as the prize.
It is critical to only take trades that meet the criteria of a strategy that you have found to have a positive expected value. Rather than look for a reason to take the trade, which is easy, look for a reason not to. Ask yourself, “If I buy this stock, who will be selling to me, and what does she know that I don’t know?” Looking at the other side of the argument will often highlight considerations that you have missed.
Being fussy is a lot easier when you recognize that the market-even a slow market-will give you opportunities. The markets have been pretty quiet this year but there are still stocks outperforming the market every day.
And if you can’t find a trade today, tomorrow or in the next week, eventually you will. There is always another bus coming down the road. If you miss one, just wait for the next.
I have found that you will actually make more money by trading less. If you maintain a very high standard for what trades you make, you will always pass on some trades that end up doing very well. By being selective, however, you will also avoid many marginal trades that would tie up your capital and then incur a loss. By being fussy and trading less, you end up taking only the very best trades and your results will be better overall.
It is easy to be fussy when the market is strong and there are lots of opportunities. It’s like fishing when every time you cast your line you get a bite. With that kind of success, you will quickly throw back any fish that is too small because you know there’s going to be something better coming along soon. You only take the best of the best.
When the fish stop biting and you spend hours with no bounty, you take the first fish that grabs your hook. It could be a tiny fish that you would never keep on even an average day, but with your desire to catch something, you keep it anyway. It would be better to have just not gone fishing at all.
You’ll do the same thing when trading a slow market. Eager to make a profit, you will take trades that show some potential even if they don’t meet all of your requirements. You will work hard to uncover a trade rather than wait for the obvious no-brainer trades that you take when the market is in a giving mood.
I like to say that in trading, when the going gets tough, the tough get lazy. You can’t control the market, so if the market is not giving you opportunities, it’s better to do nothing. Your hard work will not change what the market does.
This is hard for many people who have been programmed to relate hard work to success. If you try harder than the next person in a sport, you should get a better result. If you study harder for an exam, you should get a better mark. If you work longer hours at your job, you should make more money. In the stock market, if you work harder to find good trades, you will probably lose money.
The best trades are easy to find. Working hard to uncover something leads you to find questionable trades that you have to talk yourself into. It’s better to walk away when you have doubts.
This is not to say that hard work is not rewarded in trading. Traders who work hard at practicing their analytical skills or developing new strategies will be rewarded. People who devote their time and effort to improving their emotional control will be better traders. These are things that you can control and affect with hard work, but hard work won’t change what the stock market does.

The trading action in the lower priced stocks is improving so I ran the Simple Weekly scans on Stockscores for stocks under $10, focused on the 3 year weekly charts in search of the right patterns. Below are two stocks that I think have good potential:

1. BDSI
BDSI has endured a long and ugly slide from $18 down to under $2 but is starting to move up again with a pick up in volume last week and some abnormal price action. Support at $2.20.

2. KIN
KIN is making a nice up and handle break on the weekly, support at $6.80.

References
- Get the Stockscore on any of over 20,000 North American stocks.
- Background on the theories used by Stockscores.
- Strategies that can help you find new opportunities.
- Scan the market using extensive filter criteria.
- Build a portfolio of stocks and view a slide show of their charts.
- See which sectors are leading the market, and their components.
Disclaimer
This is not an investment advisory, and should not be used to make investment decisions. Information in Stockscores Perspectives is often opinionated and should be considered for information purposes only. No stock exchange anywhere has approved or disapproved of the information contained herein. There is no express or implied solicitation to buy or sell securities. The writers and editors of Perspectives may have positions in the stocks discussed above and may trade in the stocks mentioned. Don’t consider buying or selling any stock without conducting your own due diligence.

Yesterday, there was a flash crash in the gold market. What happened and what does it mean?
Monday was a very interesting day for the gold market, as the price of gold plunged almost $20 after 1.8 million ounces of the yellow metal were sold in one minute. Gold futures fell as much as 1.6 percent to $1,236.50 an ounce on the Comex at the Asian close. The drop was unexpected as no new fundamentals justified it. On the contrary, orders for U.S. durable goods fell 1.1 percent in May, the second monthly decline in a row, while the Chicago Fed National Activity Index tumbled to -0.26. And the volume in New York spiked to 1.8 million ounces, an unprecedented level not reached even after the Brexit vote or Trump’s victory in the presidential election.
Hence, the plunge was a mystery. It could be a technical sell or central bank intervention. Or somebody just wanted to exit from the market. But why would he or she want to sell gold during limited participation? Hence, the fat finger order is taking the blame. But some analysts remained skeptical – this had to be a double fat finger, as silver also plunged. And why did the precious metals prices not rebound after an erroneous order hit the market (see the chart below)?
Chart 1: Price of gold over the last three days.
The truth is that no one has a clue what really happened. It could be a fat finger, but someone could take a shot or pull out to satisfy a margin call. Anyway, from the fundamental point of view, nothing changed, so one could reasonably expect a return to the pre-crash price, especially that gold showed resilience, given the volume of sales. However, the yellow metal has already been in a downward trend since the recent FOMC meeting, so a full rebound should not happen. Stay tuned!
If you enjoyed the above analysis, we invite you to check out our other services. We focus on fundamental analysis in our monthly Market Overview reports and we provide daily Gold & Silver Trading Alerts with clear buy and sell signals. If you’re not ready to subscribe yet and are not on our mailing list yet, we urge you to join our gold newsletter today. It’s free and if you don’t like it, you can easily unsubscribe.
Disclaimer: Please note that the aim of the above analysis is to discuss the likely long-term impact of the featured phenomenon on the price of gold and this analysis does not indicate (nor does it aim to do so) whether gold is likely to move higher or lower in the short- or medium term. In order to determine the latter, many additional factors need to be considered (i.e. sentiment, chart patterns, cycles, indicators, ratios, self-similar patterns and more) and we are taking them into account (and discussing the short- and medium-term outlook) in our trading alerts.
Thank you.
Arkadiusz Sieron
Sunshine Profits‘ Gold News Monitor and Market Overview Editor

 Summary
The opioid abuse epidemic is destroying American lives, families and the fabric of American communities.
The action taken to address the crisis by socio-political-legal means has placed both pain patients and companies at risk of sanctions.
There are companies engaged in the development of abuse-deterrent opioids that can not only help reduce the abuse potential but also offer an opportunity for the informed investor.
The Opioid Abuse Epidemic is real and in an attempt to ameliorate the crisis, whether well-meaning or self-serving, doctors are reducing patient access to pain drugs. The evidence makes it clear that those actions are doing harm to millions of Americans who were on long-term opioids. As a result, some are seeking to buy their drugs on the black-market, risking overdose, and others have committed suicide when unable to stem the pain.
….also from Seeking Alpha:
Dollar Turns Positive Despite Downbeat Economic Data

As the Mainstream financial media continues to promote the biggest market bubble in history, only a small fraction of investors are prepared for the disaster when it finally POPS. The markets are so insane today, it seems as if fundamentals don’t matter any more. However, they actually do if we look at the numbers closely.
In order to invest in the correct assets going forward, one must choose between those with a low RISK and high REWARD versus assets with a high RISK and low REWARD. While this may seem like common sense, I can assure you, the market makes no sense whatsoever today. And most investors are doing quite the opposite. Go figure.
If we look at the following charts in this article, we can clearly see which of the following assets, the DOW JONES, GOLD or SILVER, enjoy the lowest risk and highest reward.
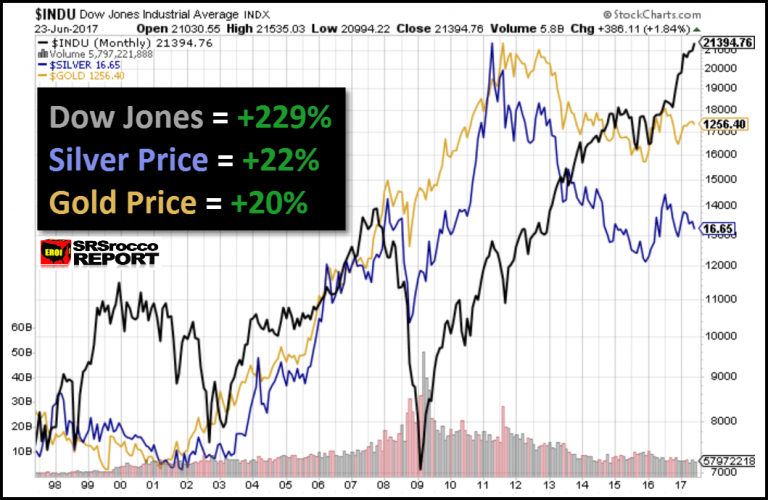
This chart shows the price action of the Dow Jones Index, gold and silver. Since its low in 2009, the Dow Jones Index is up 229%, from 6,500 to 21,400 currently. Even though the Dow Jones Index experienced a brief 17% correction in 2011, it hasn’t endured a healthy 30-50% market correction in over eight years. It is most certainly overdue.
However, after the precious metals prices peaked in 2011 and then declined, silver is only up 22% from its low in 2015 and gold is up 20%. Thus, the Dow Jones Index has surged higher for eight straight years, while gold and silver are still down considerably from their peak prices in 2011.
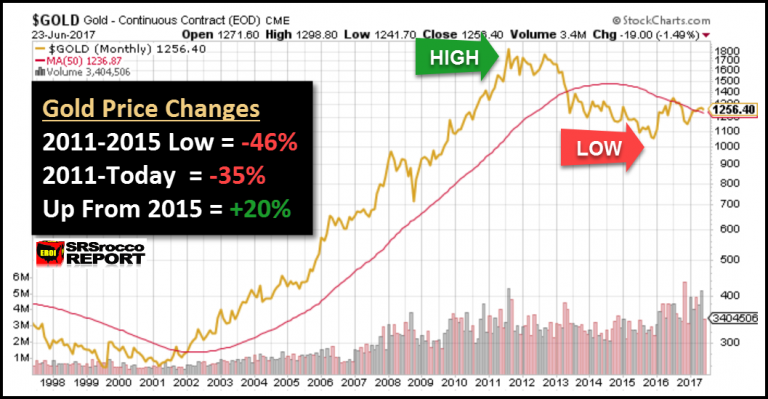
If we look at each asset class separately, we can see how over-valued the Dow Jones Index is compared to gold and silver. The next chart shows that the gold price fell 46% from its peak in 2011 to its low in 2015. Now, even considering the 20% current rise in the gold price from its low in 2015, it is still 35% below its 2011 peak:
Looking at the silver chart, its price movement is much more volatile than gold. The silver price fell a whopping 73% from its peak in 2011 to its low at the end of 2015. Currently, the silver price is still 66% below its 2011 high:

As I already mentioned, the silver price is only 22% up from its low in 2015. Now, let’s look at the Dow Jones Index:

While the precious metals have experienced a healthy correction since 2011, the Dow Jones Index continues higher towards the heavens. It is up a stunning 229% from its low in 2009. If the Dow Jones Index fell 5,000 points, that would only be a 23% correction. However, if it fell 11,000 points, down to 10,400, it would have fallen 51%, less than its 54% market correction decline from 2007 to 2009.
To get an idea of how overvalued the Dow Jones Index is, I am going to use the S&P 500 Index as an example. Why? Because the S&P 500 Index is up just about the same percentage as the Dow Jones Index since the low in 2009:

You will notice that the Dow Jones and S&P 500 charts are nearly identical. So, what happens to one, will happen to the other. To determine the fair value of the S&P 500, we look at the Schiller PE Ratio. Basically, the Schiller PE Ratio (PE = Price to earnings ratio) is defined as the price (Index price) divided by the average ten years of earnings…. adjusted for inflation.
This historical Schiller PE Ratio mean is 16.8. That means S&P 500 price is 16.8 times the average ten years worth of earnings. So, if the Schiller PE Ratio has averaged around 16.8 in its history, what is the ratio today?
According to Gurufocus.com, the present Schiller PE Ratio is 30.2, or nearly 80% higher than the mean. Not only is the current Schiller PE Ratio in bubble territory, it is even higher than the 27.4 ratio the last time it peaked in 2007. Well, we all know what happened in 2008 and 2009. During the first quarter of 2009, the Schiller PE Ratio fell to a low of 13.1.
Furthermore, before the stock market crash of 1929 and the ensuing Great Depression, the Schiller PE Ratio reached a high of 32.4 in September 1929….. only a few points higher than it is today.
So, what does that mean? It means that the Dow Jones and S&P 500 Indexes are now in record bubble territory and their future reward is LOW while their future risk is quite HIGH. However, if we look at gold and silver, we see quite the opposite.
Not only did the gold and silver prices experience a huge correction from 2011 to 2015, the current price of silver is very close to the cost of production. Here is a chart of one of the largest primary silver mining companies in the world…. Pan American Silver:

This chart shows Pan American Silver’s estimated profit-loss per ounce (GREEN LINE), versus the average spot price (WHITE LINE). As we can see in 2011, Pan American Silver made a $9.02 profit for each ounce of silver it produced when the average spot price reached $35.03. However, as the price declined over the next five years, Pan American Silver lost money in 2013, 2014 and 2015.
Even though Pan American Silver made an estimated $1.54 for each ounce of silver it produced 2016 YTD (last time I did the figures), it fell to about $1.00 and ounce during the first quarter of 2017. With the average spot price of silver at $17.42 Q1 2017, my rough estimate is that Pan American Silver needs abut $16.40 +/- to breakeven. With the current price of silver at $16.50, Pan American Silver isn’t making much money.
Moreover, my estimation for the average break-even for the primary silver mining industry is between $15-$17 an ounce. I have not done any recent calculations for the estimated breakeven for gold, but it looks to be between $1,100-$1,500. While the gold price has a bit more cushion than silver, we can plainly see that both gold and silver are much closer to a bottom than the Dow Jones Index.
According to this analysis, the HIGH RISK, LOW REWARD easily goes to the Dow Jones and S&P 500 Index, while the LOW RISK and HIGH REWARD belong to gold and silver.
We must remember, when the Dow Jones Index suffered a mere 2,000 point correction at the beginning of 2016, the gold and silver price surged:

If the gold and silver price jumped 15% when the Dow Jones only fell 2,000 points in 2016… how high will their prices move when the Dow Index falls 5,000-10,000 points and suffers a 25-50% correction? Because the entire market is held up by so much leverage and debt, I do believe the precious metals will enter into a new market of much higher prices.
Lastly, even though the Cryptocurrencies are getting hammered today, this is just an overdue correction. Bitcoin and the other cryptocurrencies probably have a great deal more to fall before bottoming. However, I do see some of the top cryptocurrencies to hit new highs in the future. I mentioned this market because the same thing will happen to gold and silver.
All of a sudden one day and out of the blue, the price of gold and silver are going to surge higher. Then the next day… they will have jumped even higher still. Before investors or the public realizes it, the gold and silver prices will seem like they are too expensive to buy at this point….the same way when the cryptocurrencies shut up 200-1,500% in just brief period of time.
This is why an investor CANNOT TRY TO TIME WHEN TO GET INTO THE PRECIOUS METALS. If one does not have a decent amount of physical gold and silver, it will be extremely difficult or likely impossible to acquire the metals when the prices have skyrocketed. Sure, you might be able to get some metal, but the prices or premiums could be very high indeed.
So… as the folks who purchased Bitcoin and sat on them for several years before the huge move higher, the same thing will happen to gold and silver. While retail gold and silver sales have fallen significantly, as well as precious metals sentiment, the fundamentals point to a LOW RISK and HIGH REWARD… if we are patient.
Check back for new articles and updates at the SRSrocco Report.
Our intraday outlook is bearish, and our short-term outlook is bearish. Our medium-term outlook remains neutral, following S&P 500 index breakout above last year’s all-time high:
Intraday outlook (next 24 hours): bearish
Short-term outlook (next 1-2 weeks): bearish
Medium-term outlook (next 1-3 months): neutral
Long-term outlook (next year): neutral
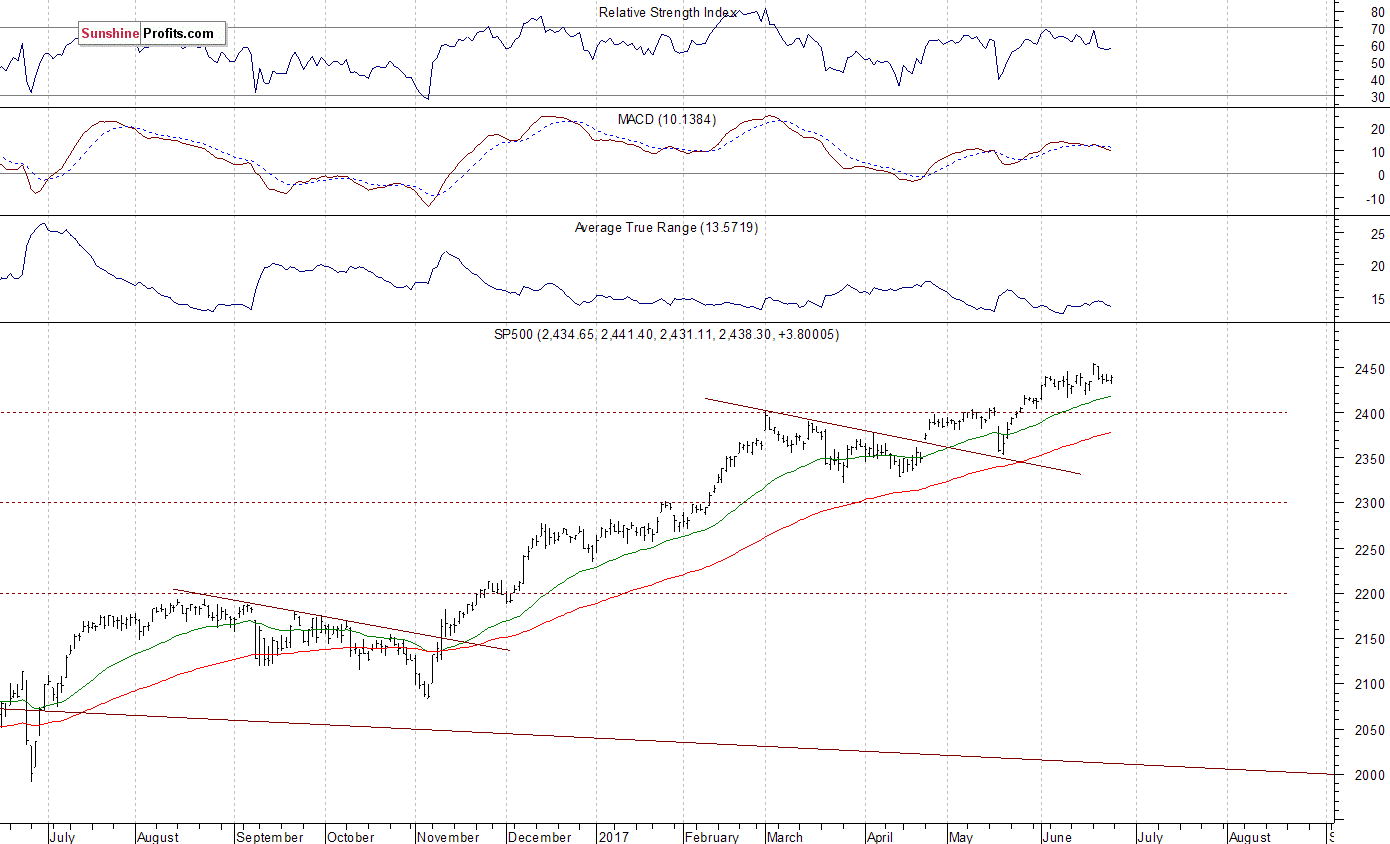
The U.S. stock market indexes were mixed between 0.0% and +0.5% on Friday, as investors continued to hesitate following economic data, quarterly earnings releases. The S&P 500 index remains relatively close to its last Monday’s new all-time high of 2,453.82. It has reached new record high after a breakout above short-term consolidation along the level of 2,420-2,440. Stocks have rebounded strongly following their mid-May quick two-session sell-off and continued over eight-year-long bull market off 2009 lows. The Dow Jones Industrial Average remains close to its last Tuesday’s new all-time high at the level of 21,535.03. The technology Nasdaq Composite was relatively stronger than the broad stock market on Friday, as it continued to retrace its recent move down. The nearest important support level of the S&P 500 index is at around 2,430-2,435, marked by last Monday’s daily gap up of 2,433.15-2,441.79. The next level of support is at 2,415-2,420, marked by some recent local lows. The support level is also at 2,400-2,410, marked by the May 25 daily gap up of 2,405.58-2,408.01, among others. On the other hand, level of resistance is at 2,450-2,455, marked by new all-time high. There have been no confirmed negative signals so far. However, we can see overbought conditions and negative technical divergences. The S&P 500 index is trading within its three-week-long consolidation, as we can see on the daily chart:
Will Uptrend Continue?
Expectations before the opening of today’s trading session are positive, with index futures currently up 0.3% vs. their Friday’s closing prices. The European stock market indexes have gained 0.7-1.0% so far. Investors will now wait for the Durable Orders number release at 8:30 a.m. The market expects that it fell 0.6% in May. The S&P 500 futures contract trades within an intraday uptrend, as it breaks above its last week’s consolidation along the level of 2,430. The nearest important level of support is at 2,425-2,430, marked by last Monday’s gap-up opening, among others. The next support level is at around 2,415-2,420, marked by recent local lows. The nearest important level of resistance is at around 2,445-2,450, marked by record high, among others. The market extends its short-term consolidation, as it continues to trade along all-time high. Is this a topping pattern before downward reversal or just flat correction within an uptrend? There have been no confirmed negative signals so far.
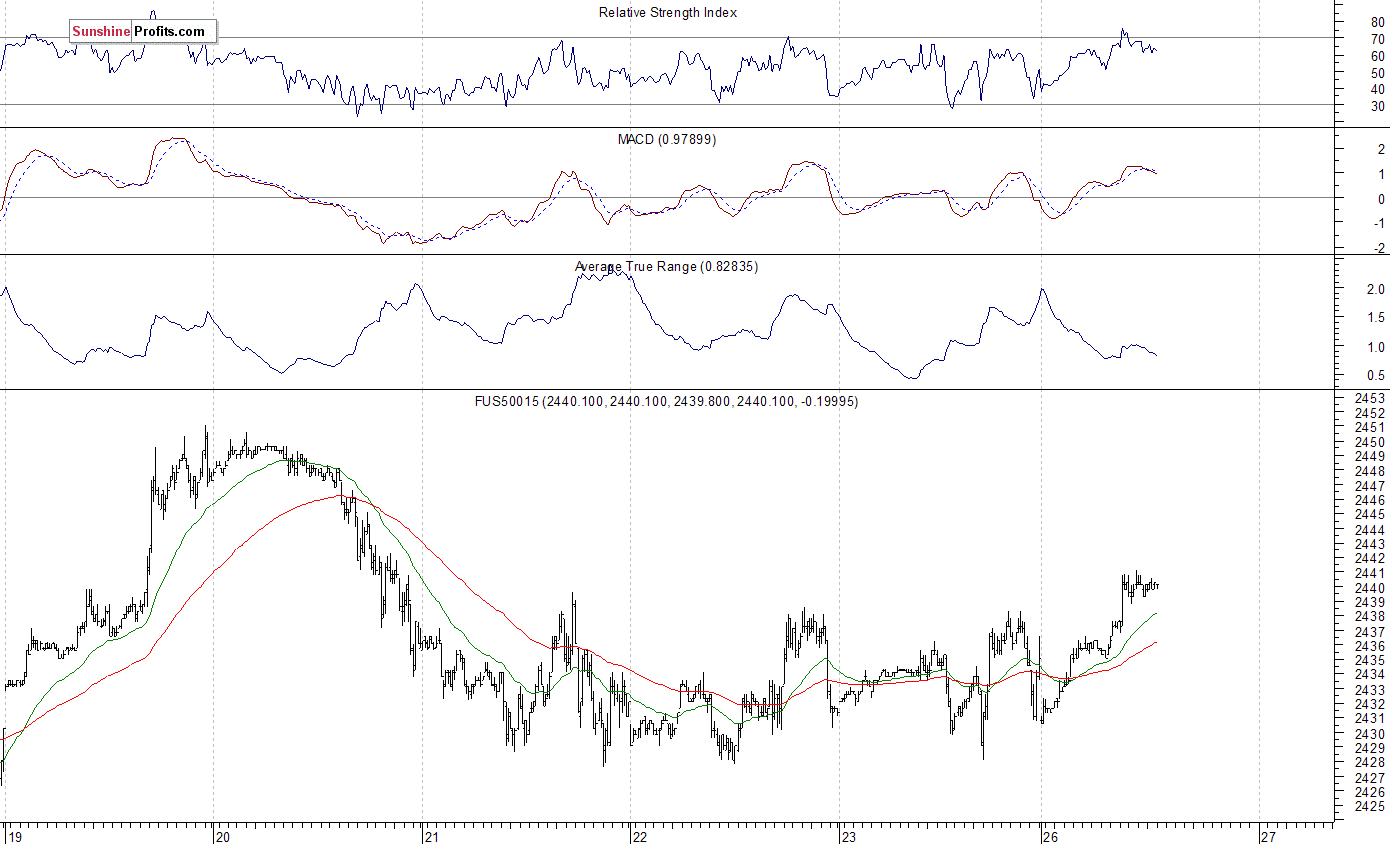
Positive Expectations
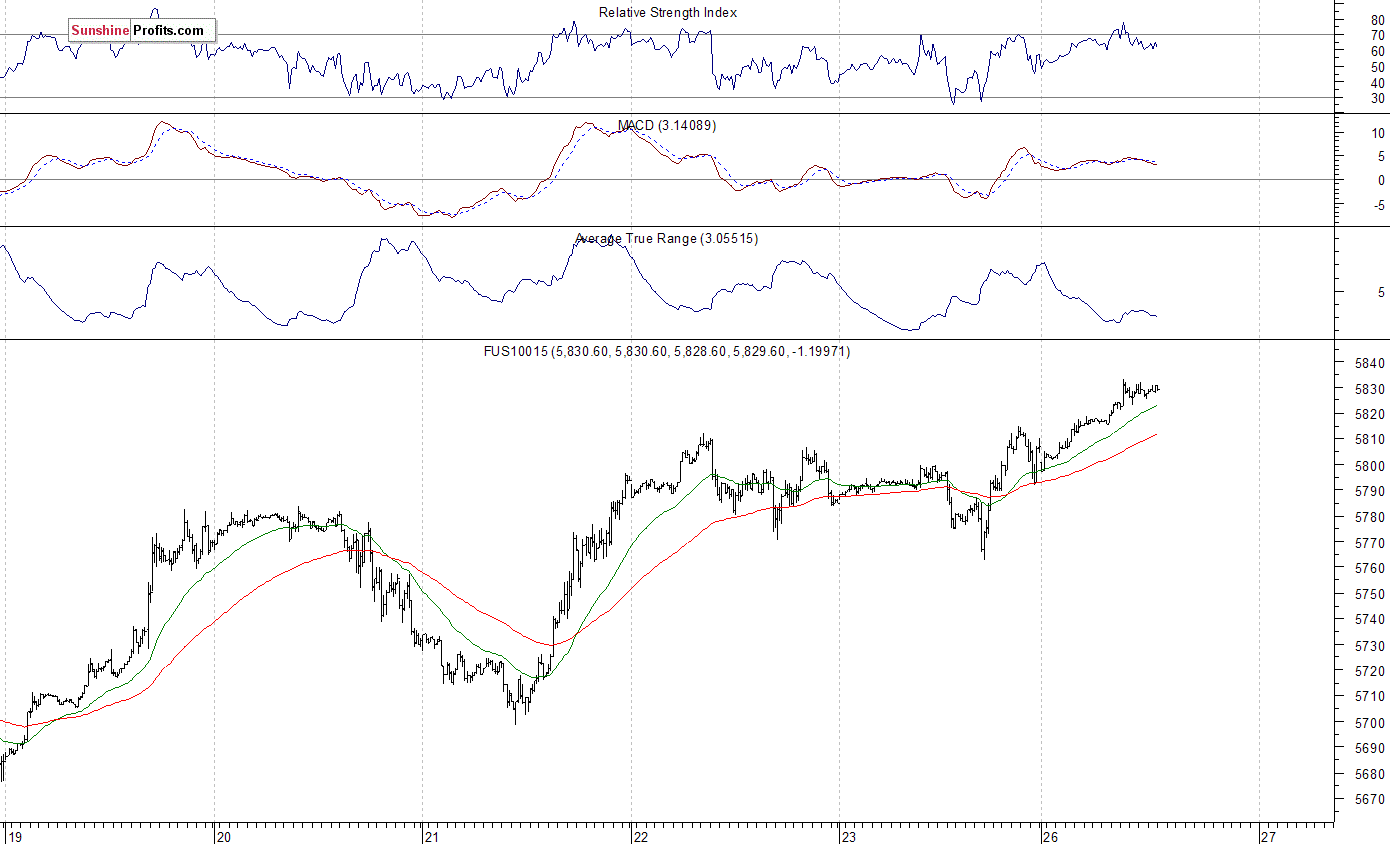
The technology Nasdaq 100 futures contract follows a similar path, as it currently trades within an intraday uptrend. It retraces some more of June 9 sell-off. The nearest important level of resistance is at 5,840-5,850, marked by previous short-term local lows. The next resistance level is at around 5,900, marked by record high. On the other hand, support level is at around 5,800-5,810, marked by previous level of resistance. The next support level is at 5,770, among others, as the 15-minute chart shows:
Concluding, the S&P 500 index continued to trade relatively close to record high on Friday. Will over eight-year-long bull market continue? Or is this some medium-term topping pattern accompanied by very bullish investors’ sentiment? There have been no confirmed negative signals so far. However, we still can see negative technical divergences, along with medium-term overbought conditions.
If you enjoyed the above analysis and would like to receive free follow-ups, we encourage you to sign up for our daily newsletter – it’s free and if you don’t like it, you can unsubscribe with just 2 clicks. If you sign up today, you’ll also get 7 days of free access to our premium daily Gold & Silver Trading Alerts. Sign up now.
Thank you.
Paul Rejczak
Stock Trading Strategist


-
I know Mike is a very solid investor and respect his opinions very much. So if he says pay attention to this or that - I will.
~ Dale G.
-
I've started managing my own investments so view Michael's site as a one-stop shop from which to get information and perspectives.
~ Dave E.
-
Michael offers easy reading, honest, common sense information that anyone can use in a practical manner.
~ der_al.
-
A sane voice in a scrambled investment world.
~ Ed R.
Inside Edge Pro Contributors

Greg Weldon

Josef Schachter

Tyler Bollhorn

Ryan Irvine

Paul Beattie

Martin Straith

Patrick Ceresna

Mark Leibovit

James Thorne

Victor Adair