
Wealth Building Strategies
Faber ‘s typically controversial and contrarian views have earned him the label of Dr. Doom, though even his harshest critics must admit that he’s been unerringly correct in his market forecasts over the past three decades. He also trades currencies and commodity futures like Gold, Natural Gas and Crude Oil.


People are just starting to grasp why deflation is also present in the USA. Despite all the screaming about Quantitative Easing, most remain confused why hyperinflation has not taken place. Most are Oblivious to the fact that there is a dynamic process involved that is a lot more complex than traditional economics teaches in school. Sorry, but the quantity of money theory does not work. It is way too simplistic and this has led to massive confusion. Even the central bankers are starting to call with questions. Economics is just not as it seems and it has ignored international capital flows confining all analysis to purely domestic situations.
 The latest news that Amazon was buying Whole Foods saw a plunge in retail and grocery stocks. Amazon put book stores on the list of bankruptcy victims and we see similar troubles for Sears, the company that made its name using the railroads to deliver goods by mail order – the internet of the 19th century.
The deflationary tone has been in place since 2015.75 and it is a combination of problems, one of which is the technology advancement. Many people see the advance of robots displacing jobs. However, the reason unemployment rose dramatically to 25% during the Great Depression was not from the collapse of industry. It was (1) the advancement of technology with the combustion engine that wiped out agricultural jobs (aside from the horse industry) and (2) the vast dust bowl which then wiped out farms entirely.

Waterloo Boy N improved, November 1920.
 In 1888, the first steam tractors appeared on American farms. John Froelich of Iowa built and sold the first two successful gasoline tractors in 1892. It was the Hart Parr Gasoline Engine Company of Charles City, Iowa, who first coined the term “Tractor” in 1903. More than 100 companies began to manufacture tractors between just 1916 to 1922. John Deere bought out the Waterloo Gasoline Engine Company in 1918 becoming dominant in the field and then by 1927.
The Amazon takeover of Whole Foods is highlighting this technology shift. The jobs of the future will be more in the technology programming area. All the office spaces I looked at for moving our office were, without exception, law firms closing down. Lawyers are now far too common and we are seeing their saturation reducing the once high paying jobs that enticed kids into law school. Both law and medicine are in their downward slopes of the business cycle.
Cyclically, everything evolves. Retail stores are declining and Amazon has been opening showrooms rather than stores. You get to go touch the product and it will be delivered to your home. They are also bringing in fully automated stores. You will have an app on your phone, walk into a store, take whatever you want, and your card will be billed as you walk out the door. There go the store clerks.
Things are changing rapidly. The high cost of labor because of Obamacare has been destroying a lot of jobs. The first thing your accountant tells you is not to hire employee number 26. Technology is helping to reduce the high cost of labor, which is being driven up because of taxes and healthcare which the employee never sees.

 Improving your skills for the future is absolutely paramount to survive. Look to technology in engineering and programming to be the top fields into the future. For now, as the cost of labor declines, this results in deflation the same as took place during the 1930s thanks domestically to the technology advances in agriculture since that accounted for 40% of the civil work force in 1900 and then it was hammered by the Dust Bowl.
…also from Martin: Market Talk- June 21st, 2017
&
The Most Hated Bull Market in History

As we survey the financial markets and global economic backdrop, it appears that a change in the wind could be slowly taking place. Across the tides of global capital markets, a chillier wind may be starting to blow, ushering in what could soon be some sweeping changes in the major trends for primary capital markets. In China, the air of debt deleveraging seems to be taking root, with tightness in the money markets, bond market collapses, bond market closures, and inverted yield curves. In addition, there are also widespread rumors surrounding the viability of an assortment of wealth management products that have embedded duration mismatch problems baked into the cake.
Here at home in the USA, boom times remain in full swing with stock market averages busting out to new highs seemingly day-after-day. Yet, behind the bullish headlines, there seems to be developing a clear pattern of parabolic (terminal) excess within the technology space, a pattern familiar to those market watchers who recall 1999 and 2008.
Above: A basket of Large Cap Technology Stocks with Intermediate ARMS (inverted) is also extremely overbought. These types of readings tend to highlight medium term extremes so even if prices recover, there is a larger overtone to this type of bearish reading.
…also from Financial Sense:


The Newest Bear Market
From Jason Goepfert at SentimenTrader: Crude oil fell into a bear market, at least by the definition of being down 20% from its recent high.
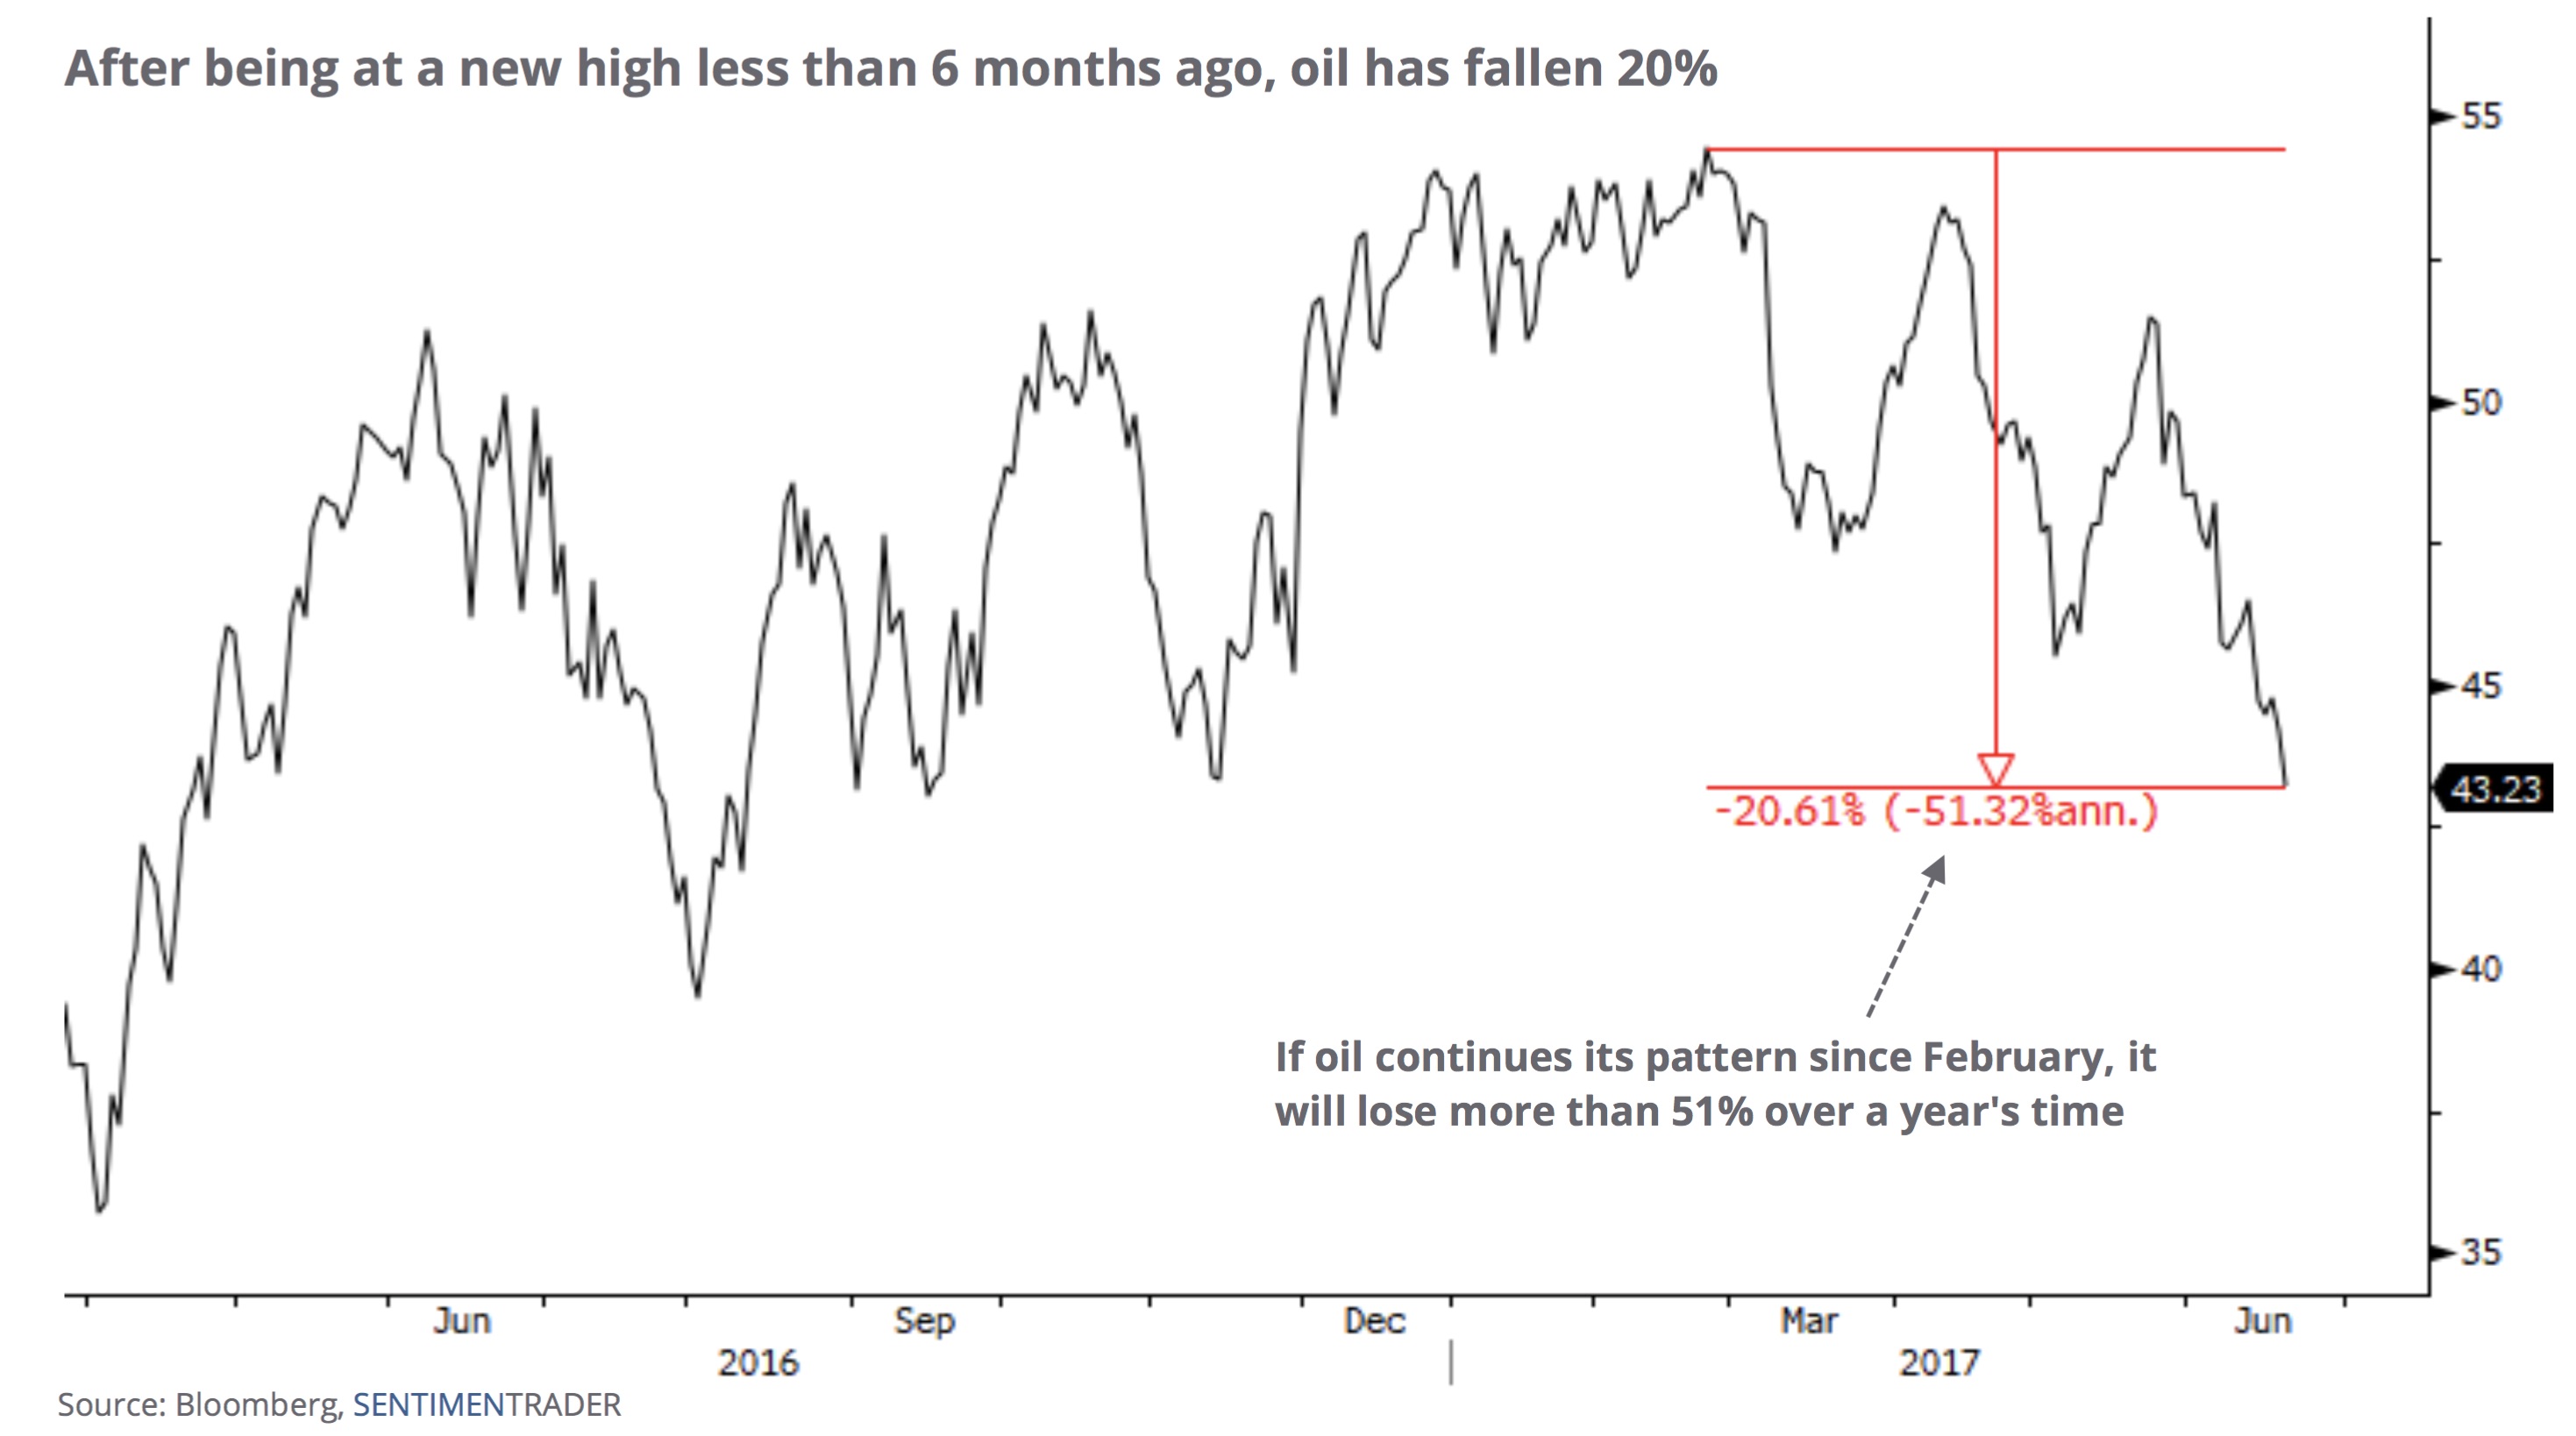
It’s been more than five years since the market fell so hard so fast from a high….continue reading HERE
…also from King World News:

Our intraday outlook is bearish, and our short-term outlook is bearish. Our medium-term outlook remains neutral, following S&P 500 index breakout above last year’s all-time high:
Intraday outlook (next 24 hours): bearish
Short-term outlook (next 1-2 weeks): bearish
Medium-term outlook (next 1-3 months): neutral
Long-term outlook (next year): neutral
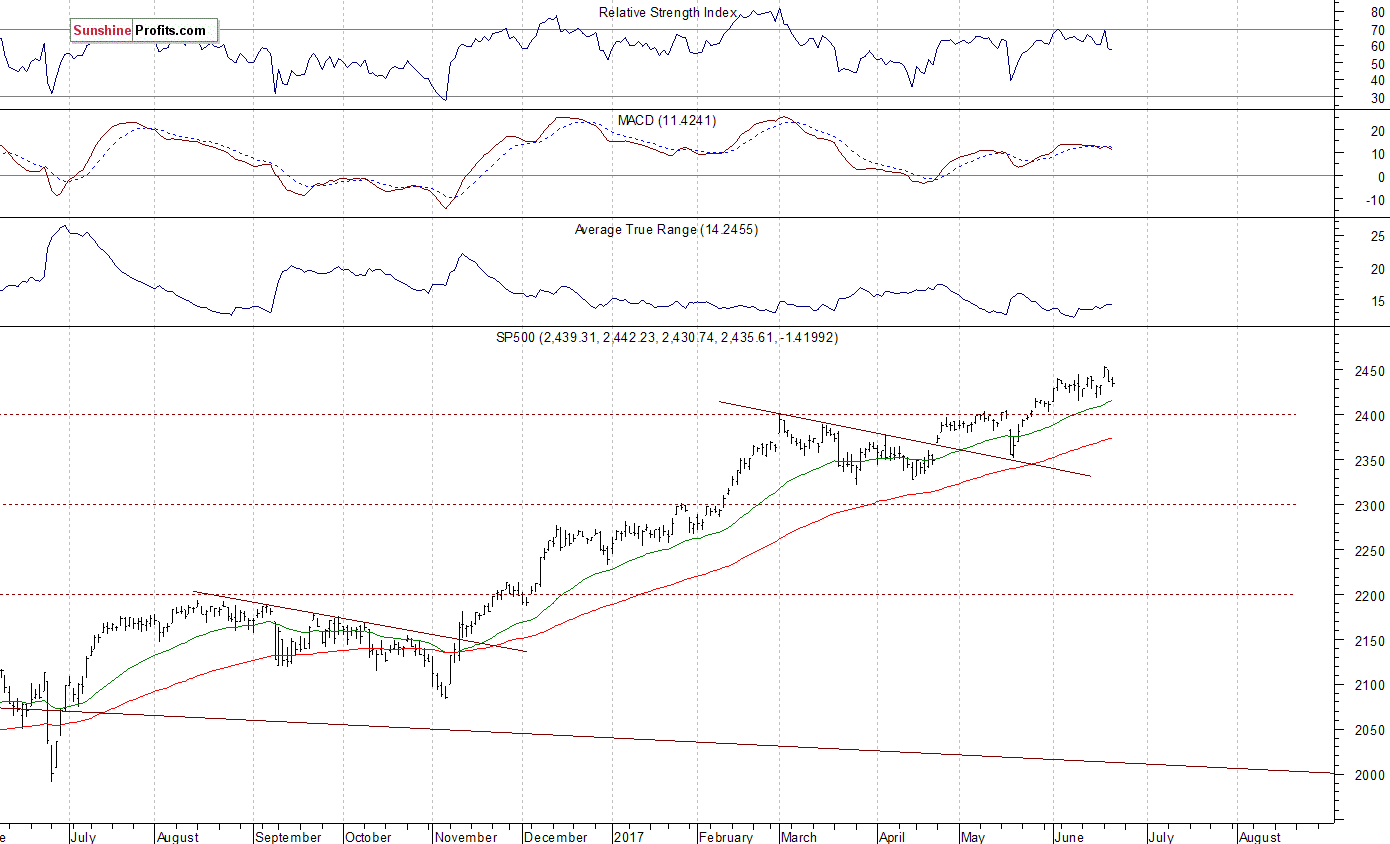
The U.S. stock market indexes were mixed between -0.3% and +0.7% on Wednesday, as investors continued to hesitate following recent volatility. The S&P 500 index has reached new all-time high at the level of 2,453.82 on Monday following breakout above its short-term consolidation along the level of 2,420-2,440. It is currently trading 0.7% below that new record high. Stocks have rebounded strongly after their mid-May quick two-session sell-off and continued over eight-year-long bull market off 2009 lows. The Dow Jones Industrial Average has reached yet another new all-time high at the level of 21,535.03 on Tuesday. The technology Nasdaq Composite was relatively stronger than the broad stock market yesterday, as it gained 0.7%. However, it continued to trade well below its June 9 high. The nearest important support level of the S&P 500 index is at around 2,430-2,435, marked by Monday’s daily gap up of 2,433.15-2,441.79. The next level of support is at 2,415-2,420, marked by some recent local lows. The support level is also at 2,400-2,410, marked by the May 25 daily gap up of 2,405.58-2,408.01, among others. On the other hand, level of resistance is at 2,450-2,455, marked by new all-time high. There have been no confirmed negative signals so far. However, we can see overbought conditions and negative technical divergences. The S&P 500 index is trading within its two-week-long consolidation again, as we can see on the daily chart:
Click Charts For Larger Versions
More Fluctuations?
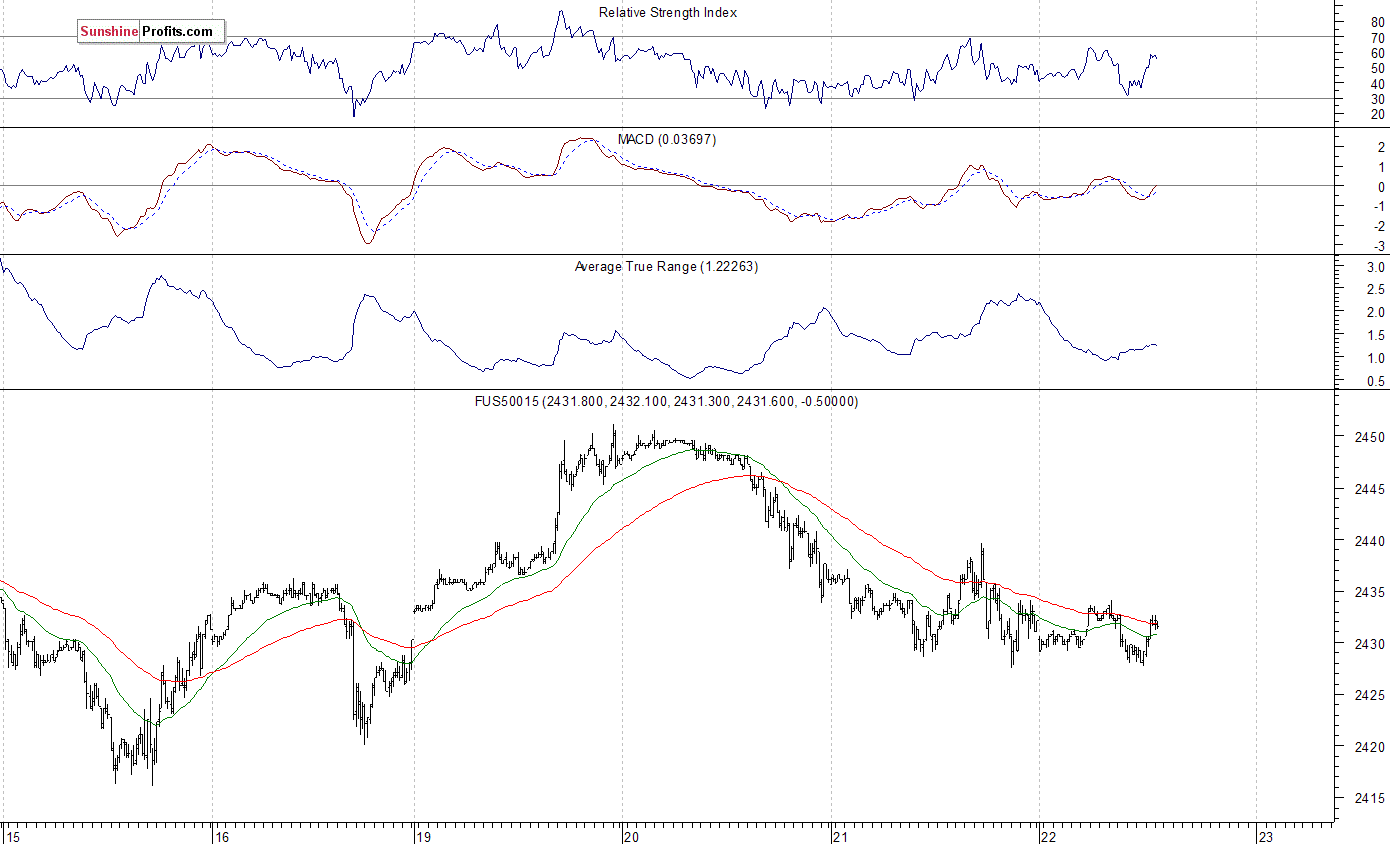
Expectations before the opening of today’s trading session are virtually flat, with index futures currently between -0.05% and -0.1% vs. their Tuesday’s closing prices. The European stock market indexes have lost 0.1-0.3% so far. Investors will now wait for some economic data announcements: Initial Claims number at 8:30 a.m., FHFA Housing Price Index at 9:00 a.m. The market expects that the Initial Claims were at 240,000 last week. The S&P 500 futures contract trades within an intraday consolidation, as it extends yesterday’s fluctuations along the level of 2,430. The market bounced off resistance level at around 2,450, following Monday’s rally to new record high. The nearest important level of resistance is at around 2,435-2,440, marked by short-term local highs. On the other hand, support level is at 2,425-2,430, marked by Monday’s gap-up opening, among others. The next support level is at around 2,415-2,420, marked by recent local lows. The market extends its short-term consolidation, as it continues to trade along new record highs. Is this a topping pattern before downward reversal or just flat correction within an uptrend? There have been no confirmed negative signals so far.
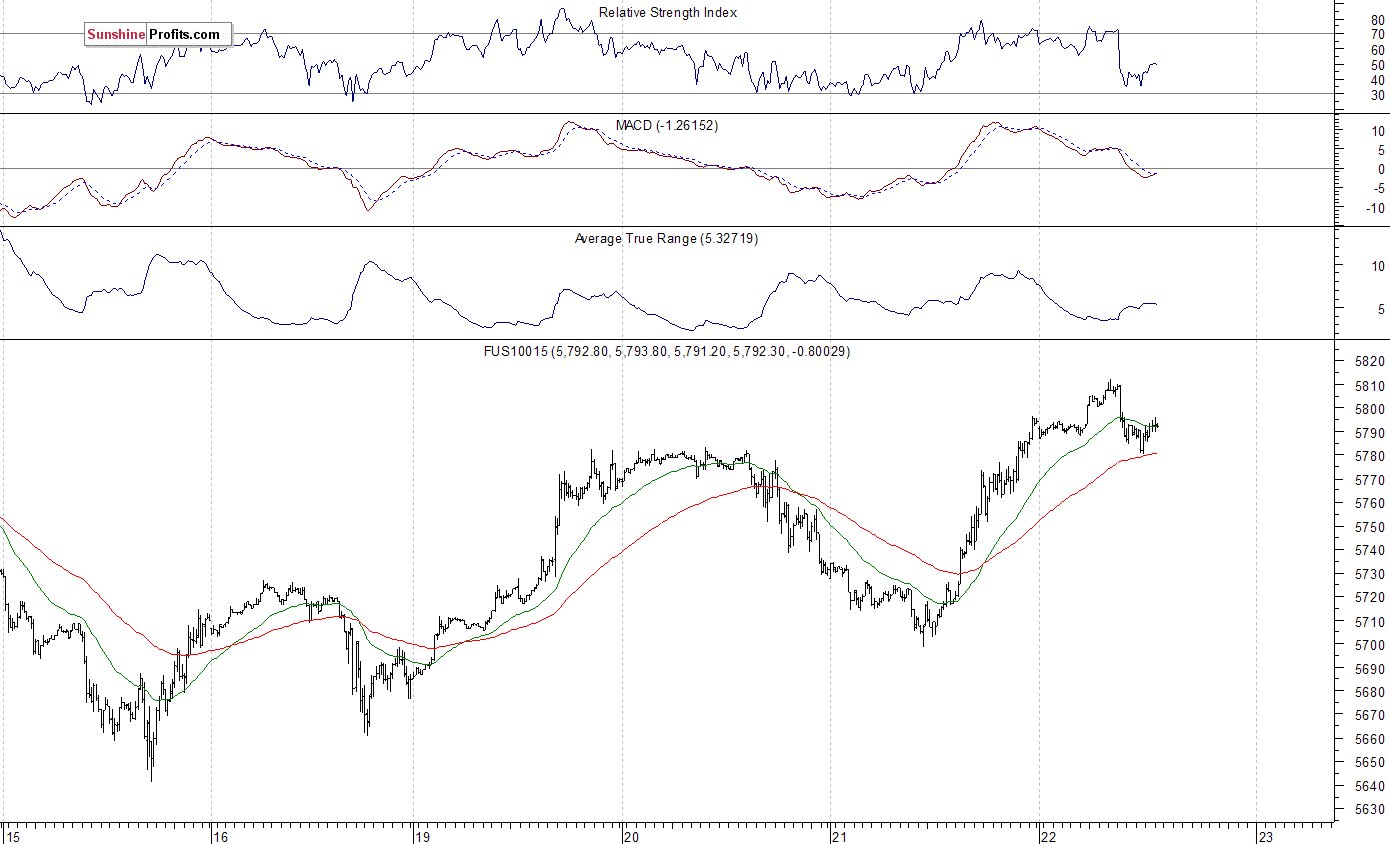
Tech Stocks Rally
The technology Nasdaq 100 futures contract is relatively stronger, as it extends its yesterday’s rally following better-than-expected quarterly earnings release from Oracle. It has retraced some more of June 9 sell-off yesterday. It is currently trading along the level of 5,790-5,810. The nearest important level of resistance is at around 5,810. The next resistance level is at 5,840-5,850, marked by some previous short-term local lows. On the other hand, support level is at around 5,780, marked by previous resistance level. The next support level is at 5,750-5,760, among others, as the 15-minute chart shows:
Concluding, the S&P 500 index remained basically unchanged on Wednesday, as technology stocks rallied retracing more of their June 9 sell-off. Will the broad stock market continue its uptrend? Or is this some topping pattern before more meaningful downward correction? There have been no confirmed negative signals so far. However, we still can see negative technical divergences, along with medium-term overbought conditions.
If you enjoyed the above analysis and would like to receive free follow-ups, we encourage you to sign up for our daily newsletter – it’s free and if you don’t like it, you can unsubscribe with just 2 clicks. If you sign up today, you’ll also get 7 days of free access to our premium daily Gold & Silver Trading Alerts. Sign up now.
Thank you.
Paul Rejczak
Stock Trading Strategist


-
I know Mike is a very solid investor and respect his opinions very much. So if he says pay attention to this or that - I will.
~ Dale G.
-
I've started managing my own investments so view Michael's site as a one-stop shop from which to get information and perspectives.
~ Dave E.
-
Michael offers easy reading, honest, common sense information that anyone can use in a practical manner.
~ der_al.
-
A sane voice in a scrambled investment world.
~ Ed R.
Inside Edge Pro Contributors

Greg Weldon

Josef Schachter

Tyler Bollhorn

Ryan Irvine

Paul Beattie

Martin Straith

Patrick Ceresna

Mark Leibovit

James Thorne

Victor Adair