
Bonds & Interest Rates
Let’s have a look at a long-term perspective on Treasury yields as of Friday’s close. The chart below shows the 10-Year Constant Maturity yield since 1962 along with the Federal Funds Rate (FFR) and inflation. The range has been astonishing. The stagflation that set in after the 1973 Oil Embargo was finally ended after Paul Volcker raised the FFR to 20.06%.
Last year was a remarkable one for yields. The 10-year note hit its historic closing low of 1.37% in July and then rose 123 BPs to its 2016 closing high of 2.60% in mid-December. The yield on the 10-year note to date has dropped to 2.16% as of Friday’s close.


 All of a sudden the Fed got a little tougher. Perhaps the success of the hit movie Wonder Woman has inspired Fed Chairwoman Janet Yellen to discard her prior timidity to show us how much monetary muscle she can flex when the time comes for action.
 The U.S. PetroDollar system is in serious trouble as the Middle East’s largest oil producer continues to suffer as the low oil price devastates its financial bottom line. Saudi Arabia, the key player in the PetroDollar system, continues to liquidate its foreign exchange reserves as the current price of oil is not covering the cost to produce oil as well as finance its national budget.
The PetroDollar system was started in the early 1970’s, after Nixon dropped the Gold-Dollar peg, by exchanging Saudi Oil for U.S. Dollars. The agreement was for the Saudi’s only to take U.S. Dollars for their oil and reinvest the surpluses in U.S. Treasuries. Thus, this allowed the U.S. Empire to continue for another 46 years, as it ran up its ENERGY CREDIT CARD.
And run up its Energy Credit Card it most certainly did. According to the most recent statistics, the total cumulative U.S. Trade Deficit since 1971, is approximately $10.5 trillion. Now, considering the amount of U.S. net oil imports since 1971, I calculated that a little less than half of that $10.5 trillion cumulative trade deficit was for oil. So, that is one heck of a large ENERGY CREDIT CARD BALANCE.
Regardless… the PetroDollar system works when an oil exporting country has a “SURPLUS” to reinvest into U.S. Treasuries. And this is exactly what Saudi Arabia has done up until 2014, when it was forced to liquidate its foreign exchange reserves (mostly U.S. Treasuries) when the price of oil fell below $100:

So, as the price of oil continued to decline from the mid 2014 to the latter part of 2016, Saudi Arabia sold off 27% of its foreign exchange reserves. However, as the oil price recovered at the end of 2016 and into 2017, this wasn’t enough to curtail the continued selling of Saudi’s foreign exchange reserves. The Kingdom liquidated another $36 billion of its foreign exchange reserves in 2017:

According to the Zerohedge article, Economists Puzzled By Unexpected Plunge In Saudi Foreign Exchange Reserves:
The stabilization of oil prices in the $50-60/bbl range was meant to have one particular, material impact on Saudi finances: it was expected to stem the accelerating bleeding of Saudi Arabian reserves. However, according to the latest data from Saudi Arabia’s central bank, aka the Saudi Arabian Monetary Authority, that has not happened and net foreign assets inexplicably tumbled below $500 billion in April for the first time since 2011 even after accounting for the $9 billion raised from the Kingdom’s first international sale of Islamic bonds.
….. Whatever the reason, one thing is becoming clear: if Saudi Arabia is unable to stem the reserve bleeding with oil in the critical $50-60 zone, any further declines in oil would have dire consequences on Saudi government finances. In fact, according to a presentation by Sushant Gupta of Wood Mackenzie, despite the extension of the OPEC oil production cut, the market will be unable to absorb growth in shale production and returning volumes from OPEC producers after cuts until the second half of 2018. Specifically, the oil consultancy warns that due to seasonal weakness in Q1 for global oil demand, the market will soften just as cuts are set to expire in March 2018.
The Saudi’s have two serious problems:
- As the Saudi’s cut their oil production due to the OPEC agreement, the U.S. shale energy companies ramp up production because they are able to produce oil by shifting any losses to Brain-Dead investors looking for a higher yield. This destroys the ability for OPEC to drain global oil inventories, so the oil price continues to trend lower. Which means the Saudi’s may have to liquidate even more foreign exchange reserves in the future on lower oil prices. Rinse and Repeat.
- The Saudis are planning a 5% IPO – Initial Public Offering in 2018 of their estimated $2 trillion of their oil reserves and are hoping to get $200 billion. However, energy analysts Wood Mackenzie estimates that the value of the reserves are more like $400 billion, not $2 trillion. This is due to all the costs, royalties and 85% income tax to support the Saudi Government and the 15,000 members of the Royal Saudi Family. Thus, Wood Mackenzie doesn’t believe there will be much in the way of dividends left over.
That being said, I highly doubt the Saudi’s have the 266 billion barrels of oil reserves stated in the new 2016 BP Statistical Review. The Saudi’s produce about 4.5 billion barrels of total oil liquids per year. Thus, their reserves should last them nearly 60 years.
Now… why on earth would Saudi Arabia sell a percentage of its oil reserves if it has 60 more years of oil production in the future???? Something just doesn’t pass the smell test. Is it worried about lower oil prices, or maybe it may not have all the reserves that it states?
Either way… it is quite interesting that Saudi Arabia continued to liquidate its foreign exchange reserves in April even though the price of oil was above $53 for the majority of the month. I believe the Kingdom of Saud is in BIG TROUBLE. That is why they are trying to sell an IPO to raise much needed funds.
As Saudi Arabia continues to liquidate more of its foreign exchange reserves, it means serious trouble for the PetroDollar system. Again… without “SURPLUS” funds, the Saudi’s can’t purchase U.S. Treasuries. Actually, for the past three years, Saudi Arabia has been selling a lot of its U.S. Treasuries (foreign exchange reserves) to supplement the shortfall in oil revenues.
If the oil price continues to trend lower, and I believe it will, Saudi Arabia and the PetroDollar system will be in more trouble. The collapse of the PetroDollar system would mean the end of the U.S. Dollar supremacy and with it, the end of gold market intervention.
Check back for new articles and updates at the SRSrocco Report.

The target for TLT continues to be around 129. Treasury bonds are in bull trends (remember back a few months ago to all the bond hatred in the media). How does an eventual decline in bonds square with what we just noted above regarding Q4 2008? [work done in the preceding Precious Metals segment] Treasury bonds were a wonderfully bullish asset during Armageddon ’08 and who’s to say that an upside blow off may not be coming sooner rather than later amid massively over bullish sentiment? I mean, there is certainly no stop sign at our 129 target. Sentiment, as we are all too aware, can take a long while to manifest in pricing.

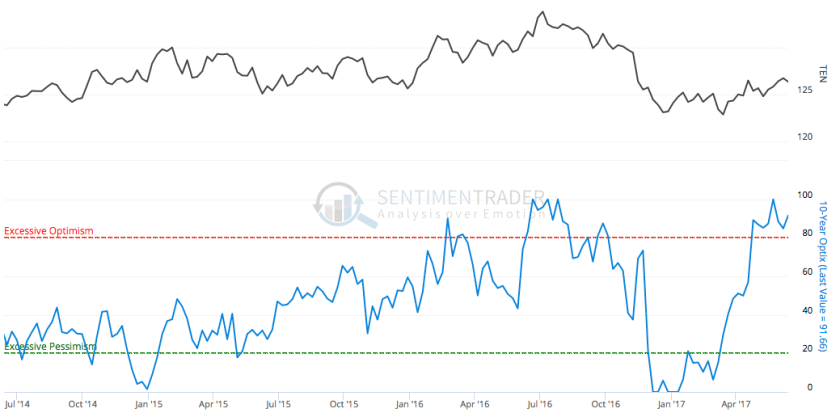
And that sentiment (and CoT) data are still pointing to a bearish bond future. Public optimism is still extremely over bullish on the 10yr bond.
Graphics courtesy of Sentimentrader…
Commercial hedging is still in a net short state, also bearish for the 10yr bond.

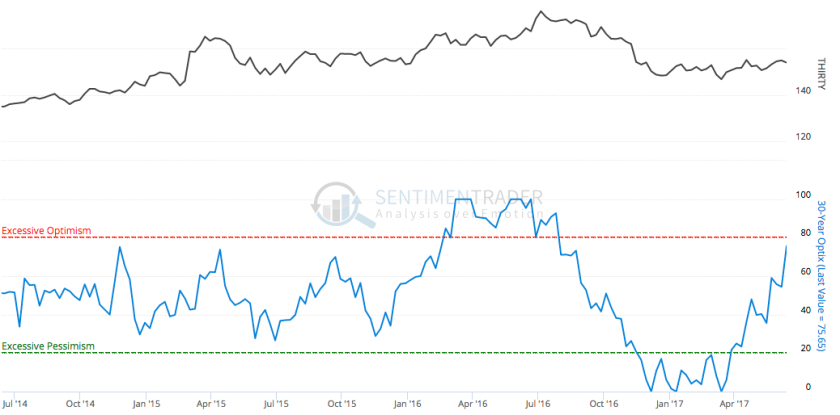
Now you will recall that the 30yr had been a holdout to the bear case as its Optimism and Commercial hedging data were only so-so, not too hot and not too cold. Well, public optimism is headed directly for the red line on the 30yr.
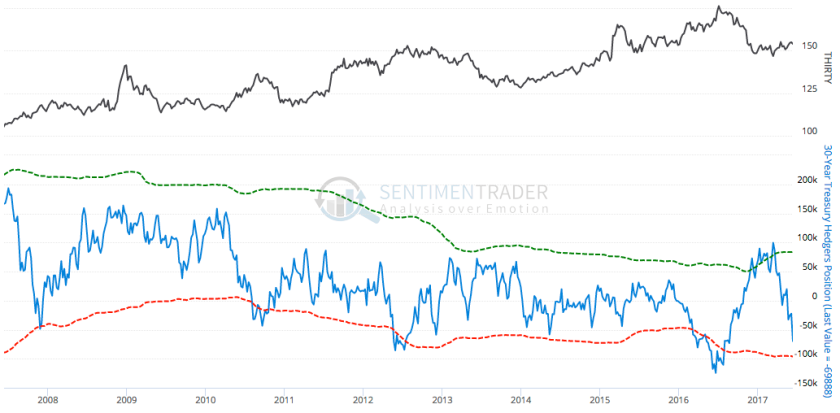
And Commercial hedgers are now net short the 30yr and driving it toward extreme territory.
Perhaps the 30yr will prove to have been a better timer when all is said and done. I don’t pretend to know the future, but am simply stating there is a scenario where the dynamics in Treasury bonds can also fit the scenario noted in the Precious Metals segment. If bonds blow off into a deflationary episode as they did in Q4 2008, what could come next is an inflationary episode, as it did in 2009. That would drive yields up.
Folks, my job is to illustrate rational scenarios and yours is to keep a grain of salt.
We have been using the TIP/IEF ratio as an ‘inflation expectations’ (IE) indicator. It has been declining for all of 2017 after rising in the Trump-fueled ‘fiscal reflation’ trade to end 2016. You can see how inflation expectations crashed in Q4 2008. To further the point made above we became bullish in that period, first on the precious metals, then on commodities (oil and copper, as I recall) and later, stocks. The gold sector bottomed in the depths of the IE crash and then commodities bottomed after the ‘V’ bottom in IE.
Graphics courtesy of the St. Louis Fed…
Finally, let’s end with a dissimilarity to Q4 2008. Economic dislocations did not start happening until this [10yr-2yr] spread started to turn up and when it did turn up it was from much lower levels (sub-zero) than today.
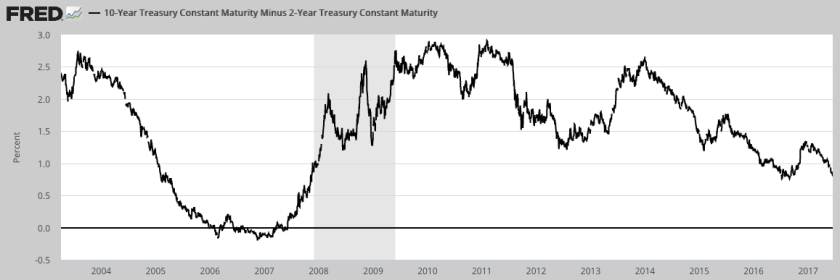
People who want to be bullish on stocks often talk about how the stock market is fine until the yield curve becomes inverted. In 2007, 10-2 went sub-zero and wallowed along down there well into 2007, before turning up. With that came the first signs of stress as Bear Sterns and Lehman Brothers started to blow up.
The question now is ‘who says the curve has to invert before the next up turn?’
Is that an etched in stone law of economics and finance? Given the stimulants injected into the system post-2008 I would not make a bet that all need be symmetrical and logical to history. Regardless, the bottom line is that if the curve starts to turn up we can be on alert for a negative liquidity event. Thus far, the curve remains in decline and all appears fine, for now. But if inflation expectations continue to tank… ?
NFTRH.com and Biiwii.com

One of the most important economic debate today is whether the economy will experience reflation or deflation (or low inflation) in the upcoming months. Has the recent reflation been only a temporary jump? Or has it marked the beginning of a new trend? Is the global economy accelerating or are we heading into the next recession? It goes without saying that it is a key investment issue because of the implications for different asset classes, including the precious metals. Let’s try to outline the macroeconomic outlook.
As one can see in the chart below, inflation has recently risen both in the U.S. and the euro area. And inflation in the UK has really accelerated recently. It’s true that there was a slowdown in the U.S. after a peak in February, but the level of inflation rates remains much higher than in 2014-2015.
Chart 1: The CPI rate year-over-year for the U.S. (blue line), the Eurozone (red line), and the UK (green line) over the last ten years.
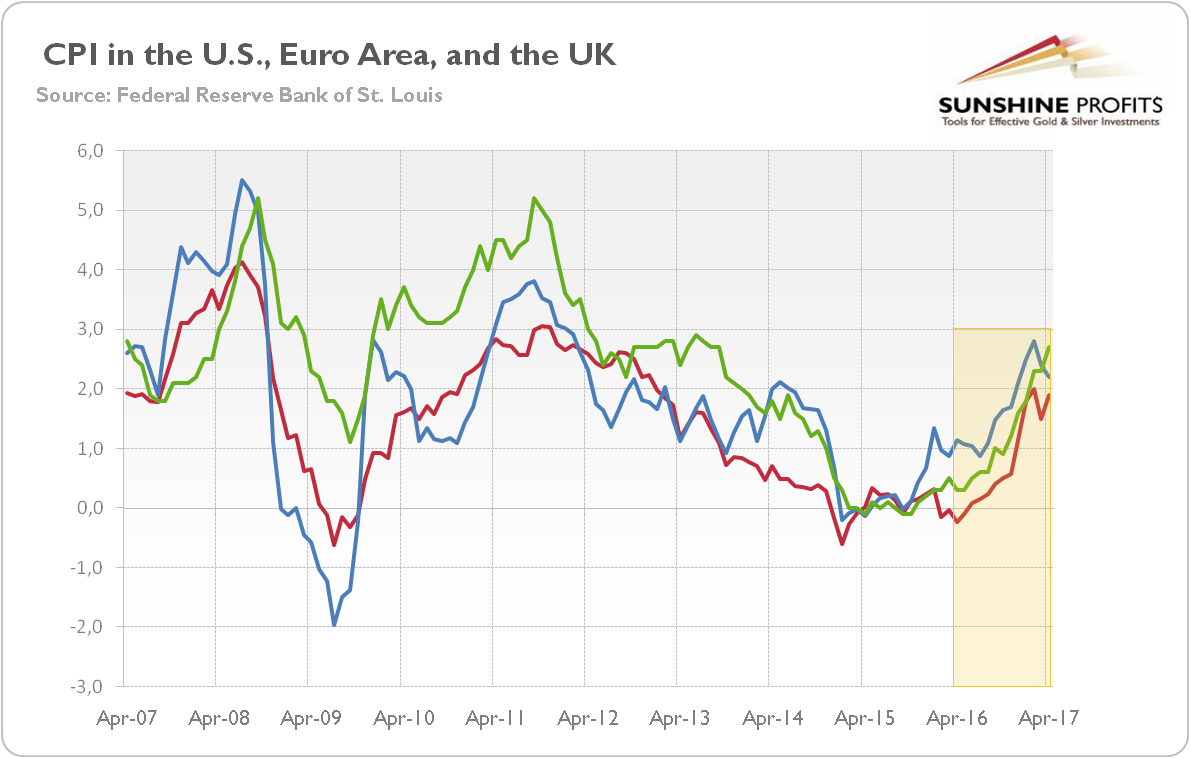
(Click to enlarge)
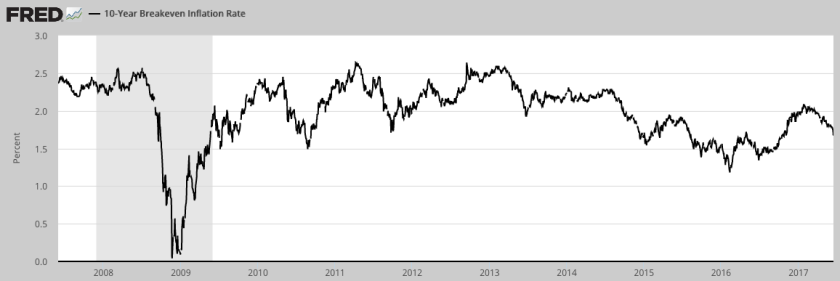
The same applies to inflationary expectations in the U.S. As the chart below shows, there was some pullback in expected inflation rate by the markets, but we do not anticipate a return to the lows of early 2016.
Chart 2: The monthly averages of U.S. spot inflation expectations derived from 10-year Treasuries (red line) and the forward inflation expectations derived from 5-year and 10-year Treasuries (blue line) over the last ten years.

(Click to enlarge)
Why do we believe that? Well, indicators of global growth have picked up since 2016. And worries about deflation in Japan and the Eurozone have practically vanished. Actually, Germany, which is Europe’s largest economy, grew 0.6 percent in the first quarter of 2017, accelerating from the previous year and outstripping other developed countries, including the U.S.
Admittedly, the American economy slowed in the beginning of the 2017, but there is the well-known seasonal adjustment bias in the U.S. GDP data. The growth rate remains solid and the official data should be much better in the upcoming quarters. Moreover, the rest of the world economy has been accelerating. The IMF upgraded its forecast for global growth in April. The world economy is expected to increase 3.5 percent this year, up from 3.1 percent last year.
Surely, there are risks to reflation. For example, Trump’s ability to deliver his proposed tax cuts is still under question – especially after latest political turmoil associated with Comey’s firing which can derail implementation of highly expected fiscal stimulus.
However, reflation is something bigger than expansionary fiscal policy (and the new administration may deliver something finally). Actually, last year, reflation started in China. We agree that China’s economic transition from export-led growth to a model based more on consumption and services may be turbulent and lead to an economic slowdown, fueling deflationary forces. There are some legitimate reasons to worry about the credit cycle in China, but the recent slowdown in momentum (the producer price inflation peaked in February 2017) may be only temporary pullback. In November, there is China’s National People’s Congress, and it is unlikely that the country will not meet its official GDP growth target set at 6.5 percent for 2017.
And one more thing: corporate profits. They have been accelerating since the end of 2015, when nobody even thought that Trump could become the POTUS and cut taxes. It shows that the reflation trade – although hit by vanishing optimism about quick implementation of Trump’s pro-growth agenda – is something more than blind faith in the new administration. Stock prices have rallied because corporate profits have also risen, as one can see in the chart below.
Chart 3: U.S. corporate profits after tax without inventory valuation adjustment and capital consumption adjustment (blue line, left axis, in billions of $), U.S. corporate profits after tax with inventory valuation adjustment and capital consumption adjustment (green line, left axis, in billions of $), and S&P 500 index (red line, right axis, index) between 2007 and 2016.

(Click to enlarge)
Summing up, after the burst of the 2008 global financial crisis, some investors started to worry about high inflation, while others feared of deflation. Neither extreme scenario has come to fruition – instead, the world entered a period of low inflation. In 2016, reflation has emerged, which got an additional boost after Trump’s victory in the presidential election. Recently, the faith in Trump’s ability to deliver pro-growth actions in a smooth manner has faded. However, it’s premature to abandon the reflation theme. Unfortunately, it’s bad news for the gold market. The acceleration in economic growth, but with inflation kept under control, would increase the real interest rates, putting downward pressure on the yellow metal.
By Arkadiusz Sieron


-
I know Mike is a very solid investor and respect his opinions very much. So if he says pay attention to this or that - I will.
~ Dale G.
-
I've started managing my own investments so view Michael's site as a one-stop shop from which to get information and perspectives.
~ Dave E.
-
Michael offers easy reading, honest, common sense information that anyone can use in a practical manner.
~ der_al.
-
A sane voice in a scrambled investment world.
~ Ed R.
Inside Edge Pro Contributors

Greg Weldon

Josef Schachter

Tyler Bollhorn

Ryan Irvine

Paul Beattie

Martin Straith

Patrick Ceresna

Mark Leibovit

James Thorne

Victor Adair