
Timing & trends
The following is part of Pivotal Events that was published for our subscribers June 8, 2017.
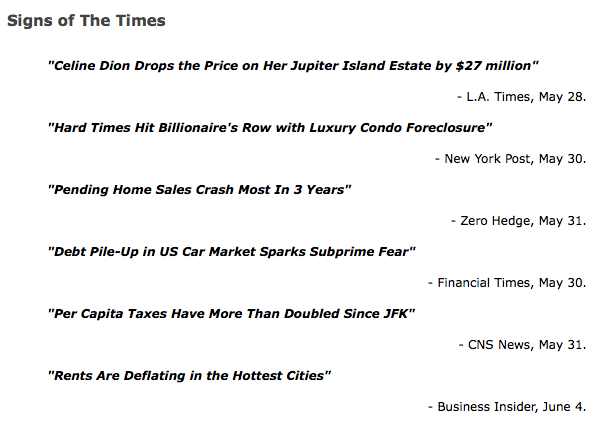
Perspective
The story on Dion’s house sale is that it was listed two years ago at $72.5 million. Other headlines indicate a quickly weakening real estate market. It is worth noting that residential real estate peaked two years before 1929 and one year before the stock market peak in 2007.
The other problem will be the collapse of the debt bubble in cars.
And then there will be the unwinding of all that credit card debt, which is up to the highs of 2007 (Chart follows).
Stock Markets
Understandably, we don’t publish a “Checklist for a Top” all that often. But when we do, it is daunting. Not everyone is a researcher or trader. There are real lives and portfolios out there that are vulnerable.
Financial history calls for a high around now. As we have been noting, London and European exchanges tend to complete big bubbles in May – June. New York can set a good high with this and following correction, rally into September. It is uncertain if that rally would be to a new high.
London (EWU) has rallied strong enough to register an Upside Exhaustion, which relates to momentum. It also registered a Sequential Sell, which is pattern. To have these signals register within the time window for the top is a strong indication that England’s part of the global financial boom is completing.
Much the same holds for Europe (FEZ), so its participation in the boom is maxing out. On schedule. The last such signal was in May 2007.
Shanghai’s (SSEC) rally into April also generated ending action. The low in early 2016 was 2638 and the rally made it to 3395. Now it is at 3100.
Canadian and US banks accomplished technical excesses on the rally into March 1. BKX reached 100 and has declined to 88 last week. This followed the 50-Day ma down and is testing the moving average now. Canada’s biggest bank is RY and its high was 75. For three weeks, it has been declining below the declining 50-Day to 69.
Both may not be successful in testing the 50-Day, as the season when spreads can reverse is at hand.
We have been thinking that the banks would lead the general market down.
The other leader on declines, Transports, peaked on March 1st at 9639 and declined to 8744 in the middle of May. The rebound was to 9406 last week. Now at 9322, breaking below the 50-Day at 9100 would resume the warning.
With Tuesday’s “Checklist for a Top”, we now watch for deterioration that would confirm the rollover. Outside of the stock market itself, this will be found in the credit markets.
Commodities
On the CRB, last week we noted that taking out support at 177 would be a significant break. At 175 now, the action is failing and the 155 level of January 2016 beckons. Will it provide support?
Commodities have been declining since the start of the year—along with the declining dollar. It is probable that the DX will strengthen into later in the year and this will hit most commodities. In which case, one of the features of the post-bubble world is a long bear market in most commodities. Another feature is a chronically firming senior currency, which is still the US dollar.
Quite likely, this will confound central bankers whose commonsense/theory quotient is out of touch with reality.
Crude oil is sliding this week. The rally from 26 in early 2016 to 55 was supported by the 20-Week ema. Since March, the decline has mainly traded below the 20-Week. At 45 now, crude has dropped 10 points as the dollar has declined. There is support at the 42 level and in the meantime crude could trade flat for a while.
Oil stocks (XLE) have been declining well below the 20-Week ema. The spike up to 77 in December registered technical extremes and the low has been 64.60 yesterday. There is support at this level which could hold for a few weeks. As with the product, oil stocks can find seasonal lows later in the year.
As Ross pointed out, lumber likes to set a triple high with technical excesses. This was accomplished in April, with the high at 414, which compares to the cyclical high of 412 in March 2013. Since May, the trade has been below the 20-Week ema.
The initial decline found support at 340, which was at the 200-Day ma. It could trade near this level for some weeks. The sector is vulnerable to liquidity problems in the fall.
Base metals (GYX) have not responded to the weaker dollar. In trading below the 20-Week ema, the action is in line with the other industrial commodities.
However, the index found support at the 309, just above the 200-Day ma. Metals could trade sideways for a few weeks.
Base metal miners (XME) rallied from 11 in early 2016 to overbought at 35 in February. The low was 28 and this week’s jump to 30 gets the index above the 50 and 200-Day moving averages. A trading range could run for some weeks.
Industrial commodities could trade sideways for some weeks. In August, we will begin to officially worry about seasonal weakness into late in the year.
Our other “comfort” for positioning gold stocks is to have the gold/silver ratio going down, which is not the case.
The most important part of this section is the direction of the gold/silver ratio. Up is signaling pending credit problems.


Source: CNBC

Technical Excesses in Europe

- First Weekly Upside Exhaustion since May 2007.
London FTSE

- First Weekly Upside Exhaustion since March 2005.
Stock Market/GNP

Gold Miners Underperforming Bullion

Link to June 9, 2017 Bob Hoye interview on TalkDigitalNetwork.com: http://www.howestreet.com/2017/06/09/stock-markets-ok-with-brit-vote-result/
Listen to the Bob Hoye Podcast every Friday afternoon at TalkDigitalNetwork.com


It was exactly one month ago we discussed our posture as a “bearish Gold bull.”
The gold mining sector hit a historic low nearly 18 months ago but this new cycle has struggled to gain traction as metals prices have stagnated while the stock market and the US Dollar have trended higher. Unfortunately recent technical and fundamental developments argue that precious metals could come under serious pressure in the weeks and months ahead.
First let me start with Gold’s fundamentals, which turned bearish a few months ago and could remain so through the fall. As we have argued, Gold is inversely correlated to real interest rates. Gold rises when real rates fall and Gold falls when real rates rise.
Real interest rates bottomed in February and have trended higher ever since. As we know, the rate of inflation has peaked and is declining. Meanwhile, the fed funds rate has increased while bond yields have remained stable. The real fed funds rate and the real 5-year yield have increased by 1% in recent months. If inflation falls by another 0.5% and the fed funds rate is increased by another quarter point, then the real fed funds rate would be positive by the end of the year. That would mark a 2% increase inside of 10 months.

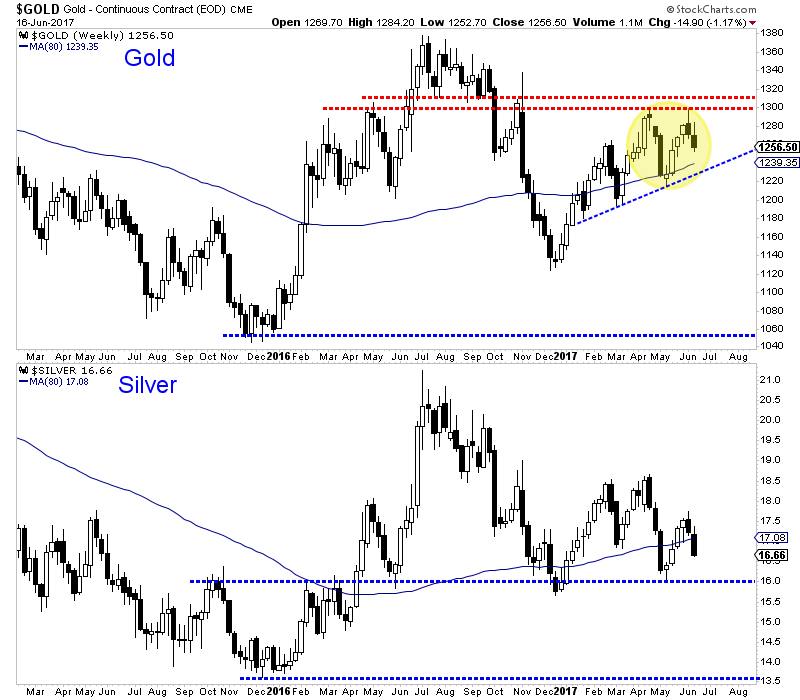
Turning to the technicals, we see that Gold is starting to follow Silver’s lead. Silver is very weak and headed for a test of $16/oz. Last week Gold formed a bearish reversal at major resistance ($1300/oz) and closed the week in the red and even below its April high. If Gold breaks its 2017 uptrend then it is likely to retest the $1125/oz level. There will be rebounds along the way but both metals are at serious risk of retesting their bear market lows.
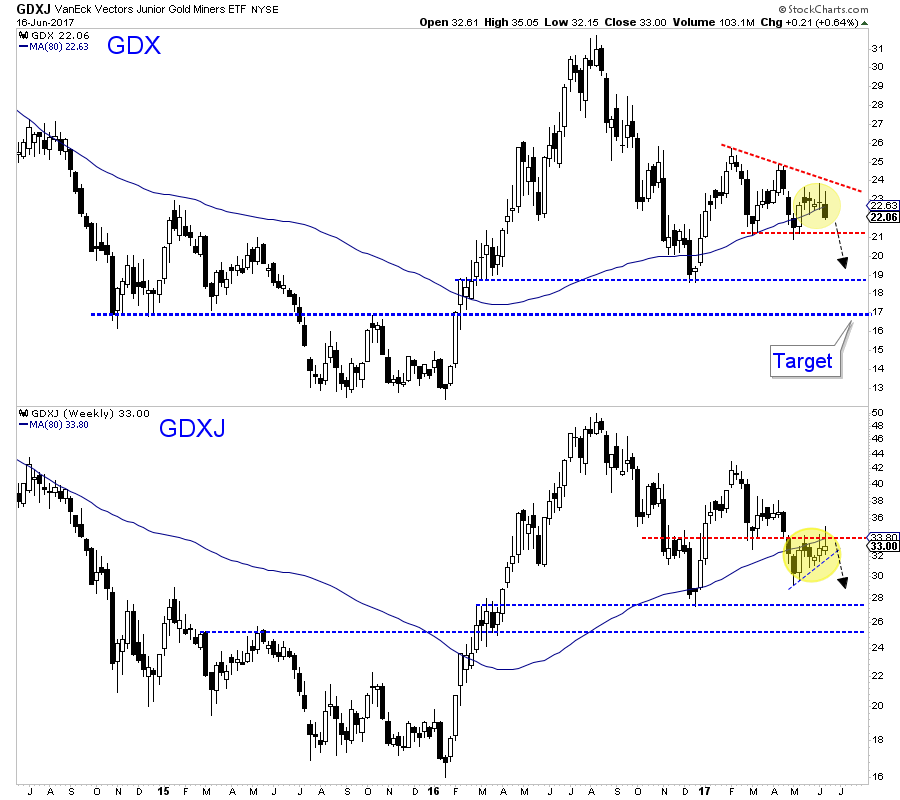
The miners, which have lagged the metals since February could be close to a technical breakdown. Since February GDX has consolidated within a descending triangle. The candlestick action of the past several weeks is favoring a break of support at $21. The measured downside target would be $17. Meanwhile, GDXJ has outperformed in recent weeks as the rebalancing has come and gone. It may continue to outperform but if the sector breaks lower it will not be spared.
Both the technicals and fundamentals argue there is increasing downside risk in the precious metals sector. Real interest rates are rising and as the rate of inflation continues to fall, Gold will come under pressure even if nominal rates don’t rise. From a bird’s eye view, the price action in Gold and Silver so far this year is corrective, meaning it is a correction of the sharp downtrend seen in the second half of 2016. There is a strong risk of that downtrend reasserting itself and metals ultimately retesting their bear market lows before the end of this year. With respect to the gold stocks, the initial downside target is the December 2016 lows which could be reached in the next month.
Jordan Roy-Byrne CMT, MFTA

Our thoughts on select markets as we wrap up the trading week.
Key events this week:
1) Bank of Canada signaled a change in interest rate policy
2) Federal Reserve was more “hawkish” than expected
3) WTI was hit with more bearish news
4) the CRB commodity index dropped to a 14 month low, down 9% from 2017 highs even as the USD fell 7%
Canadian Dollar: hit a 14 month low May 5 at 72.50 and then rallied in step with crude oil. But when crude oil “topped out” on the May 25th OPEC meeting and turned lower CAD drifted sideways for the next two weeks, taking its que from the weaker USD. On Monday and again on Tuesday this week top Bank of Canada officials indicated that the 2 “emergency” quarter point interest rates cuts made in 2016 had “done their job” and market expectations shifted dramatically to expecting interest rate hikes from the Bank of Canada sooner rather than later.
CAD had its best 4 day rally in over a year rising from 74 to 76 cents Friday through Wednesday…a 3 ½ month high. The trading volume of Canadian dollar futures hit an All Time High on Wednesday June 14 (Fed day.)
We went back to being short CAD at the end of this week because: 1) it had rallied 2 cents in 4 days 2) crude oil had taken another leg down 3) the Fed was a little more hawkish than expected 4) the Canadian stock market dropped to 7 month lows (down 5% from the February All Time Highs) while the major American stock indices were at All Time Highs. We remain short CAD.

The US Dollar Index: dropped to a new 7 month low early Wednesday morning on weaker than expected inflation and retail sales reports and then rebounded sharply later that day and again Thursday on Yellen’s more hawkish than expected press conference remarks. We had been long the USD Index from the previous week and were stopped out on the early morning fall to new lows, but we “stepped up” and bought our positions back as the USD rallied on Yellen’s comments. (This was a “hard” trade to do, but as so many veteran traders will tell you, the “hard” trades often turn out to be your best trades!) We remain long USDX thinking that it may be turning higher after months of bearish pressure.

Crude oil and Gasoline: fell this week on bearish supply/demand/inventory reports with the front month contracts for both markets closing the week at 7 month lows. Gasoline has fallen harder than WTI since the May OPEC meeting as American demand continues to be softer than expected. We have been short WTI since late May and remain short although after this week’s sharp break we wrote OTM puts against our position to moderate our bearishness.
Two “Big Picture” energy insights: 1) American frackers have been hugely successful in ramping up their production and lowering their costs whilethe “rest of the world” has been very slow to embrace fracking. It seems inevitable that they will “step up to the plate” and when they do that’s going to add to the low cost supply of oil. 2) The USA now satisfies 8% of their total electricity demand from wind and 2% from solar and you have to wonder how quickly these alternative energy supplies are going to grow.
Gold: failed to rally above $1300 last week and turned lower, tried to rally this week and got turned back again, ending the week on its lows. This market looks heavy and is struggling with even a slightly firmer USD and rising real rates. We have no position.
American interest rates: the 10 year yield has fallen back to pre-election levels as G5 inflation expectations have been drifting lower since January and the Trump reflation story has faded.


1. JIM ROGERS: The worst crash in our lifetime is coming
Rogers: I learned very early in my investing careers: I better not invest in what I want. I better invest in what’s happening in the world. Otherwise, I’ll be broke. Dead broke. Well, what’s going to happen is it’s going to continue. Some stocks in America are turning into a bubble. The bubble’s gonna come. Then it’s gonna collapse and you should be very worried.
2. Changes Coming Along With Higher Canadian Interest Rates
by Michael Campbell
The Fed moved interest rates higher thursday putting pressure on Canada to raise rates. With BOC Stephen Poloz saying low rates “have done their job”, and with Canadian growth outperforming the US recently it looks like higher rates are coming to Canada too. Will it be 1/4 of a percent, 1/2%….?..
3. Pop Goes The Housing Boom… In Canada
We’re headed for another housing bust. This time in Canada. And the key is China.
It’s no secret that Chinese investors, seeking asylum from the slow-motion credit bust underway there, have been dumping tons of cash into Canadian real estate.
But it looks like a number of events are coming together at the same time to blow up that market before the end of 2017.

In the sphere of thought, absurdity and perversity remain the masters of the world, and their dominion is suspended only for brief periods. Arthur Schopenhauer
The proverbial question for many years has always been; when will this stock market bull end? By every measure of logic and or common sense, this bull market should have crashed years ago. However, it hasn’t, and much to the angst of many professionals continued its march upwards against all the odds. We would like to stop here and state that this market is now very close to trading in the extremely overbought ranges. A market can trade in the overbought ranges for an extended period. In this instance, we analysed monthly charts, where each bar represents a month’s worth of data. Historically, a market has experienced a correction within 5-10 months from the occurrence of this event. As of yet, the markets are not trading in the extremely overbought ranges on the monthly charts, but they are very close to moving into this zone.
Why has this market defied the expectations of all the professionals?
One of the culprits could be the emotional state of the masses. There is something almost insane taking place in this bull market; the higher it trends, the more anxious individuals come. It almost does not make sense as the opposite of this is what normally takes place. Were we not experiencing this first hand, we would find it almost impossible to believe such an event could occur.
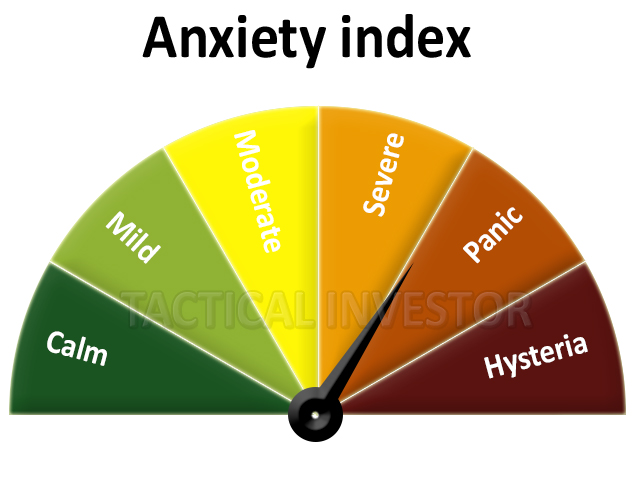
We update this gauge every two weeks, and the last reading shows that the masses are still firmly entrenched in the anxiety zone. Sadly history also indicates that bull markets never end on a note of fear or angst but on a note of extreme joy/euphoric. We don’t want anyone to lose that is not our desire; all we are doing is simply examining historical trends both from a price perspective and a mass psychology perspective. Thus it appears that this market will only crash when the majority finally decide to embrace this incredibly resilient bull market.
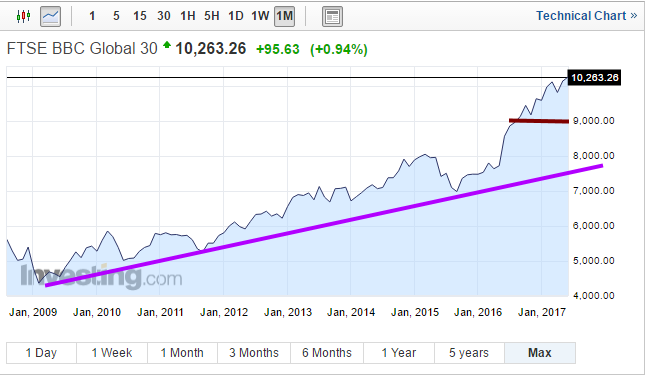
The BBC Global 30 Index provides a macroeconomic view of the global economy; the index is trading well above the main uptrend line, clearly indicating that the Central banker’s ploy is working. The idea was to flood the system with money and create the illusion that all is well. This strategy has paid off handsomely; the stock market took off and in doing so created the illusion that all is well. Now the Fed’s have taken it one step further and are raising rates after holding them down for so long to further cement the illusion that all is well. The Bond Market should have crashed, but appears to be trending upwards instead. Two reasons for this are; central bankers worldwide are still lowering rates or maintaining a low rate environment as their economies are still far from healthy. This makes our bond market look more attractive (safe-haven bet and higher rates), and this outside demand for bonds is overriding these effects of a rate hike. We will expand on this concept in a future article, but suffice to say; the Fed might be raising rates to give it more room to wiggle in the future. Two leading economic indicators continue to illustrate that the global economy is far from healthy. Either they are both wrong, or the Fed is lying.
Real factors illustrating the Global Economy is far from healthy
Copper and the Baltic Dry Index are performing miserably because there the global economy is a lot weaker than the rosy picture central bankers are painting. In fact, there is absolutely no reason for them to raise rates; the only reason they are doing this is to create the illusion that the economy is strong. This index could drop all the way down to 7400, and the outlook would remain bullish. There is a good layer of support in the 9000 ranges. A correction would probably end at this level.
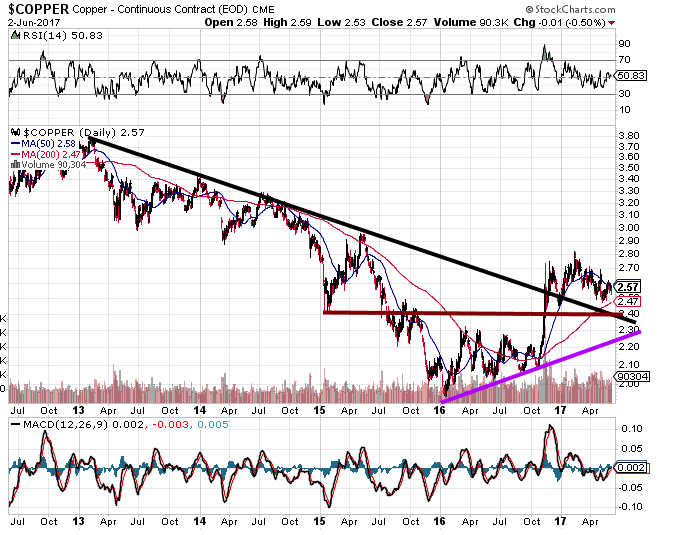
If you look at copper you can see that the market has been smashed; in all previous bull markets, copper trended upwards with the market. The picture painted by the Baltic Dry index is not any prettier; therefore, in reality, this recovery is nothing but an illusion. In 2008 this index was trading above 11,400, but today it trading at 855. This is what a crash looks for this index has dropped over 90% from its highs, yet hardly anyone focuses on it.
Now we could go on and on about how terrible things are for that is what the Naysayers love to do; focus on the negative for fear sells. But we won’t continue with this storyline for even though the data is valid; at least for now it is useless. The world has been sold a lovely story, and for the most part, they have bought it. One they will awaken and see that the emperor was never handsome and well dressed. Instead, he was an old fat man who was walking around practically naked.
There are other forces at play here, and the main one we stated at the onset appears to be sentiment. The majority are still very anxious, and it is hard to see how a market could crash when the crowd has not embraced it. A strong correction is more likely, but many individuals will confuse this correction for a crash, but that is a story for another day.
Conclusion
Logic dictates that this market should crash. Were it not for the Feds massive infusion of cash into the system; this stock market would have crashed a long time ago. However, as things stand, the sentiment is far from positive, and the global economy is far from strong. Most nations will continue to support a low rate environment in a bid to prevent further damage to their economies. This in turn will make our bond markets more attractive, and foreign money will continue to pour here, which in turn will most likely continue to curtail the effect of rate hikes. Eventually, the Fed will be forced to lower rates again as the economy starts to shown signs of impending weakness. If the global economy were healthy, then copper and the Dry Baltic Dry Index would be trending upwards.
All bull markets experience at least one very strong correction; this Bull Market is not going to be an exception. This market is more likely to experience a strong correction than a crash. Sadly, only when the sentiment moves to the euphoric zone, will this market be ready to put in a long term top.
In general, we prefer the term correction (mild, strong or back breaking) because a crash is meant to indicate the end of something, but almost every crash has proven to be the beginning of a new bull run. The best time to buy a stock is when the crowd is scared to death. This bull market will experience one very strong correction, but it will not mark the end of the bull, but the last leg of a very spectacular run. This spectacular run will end, and then we will experience meltdown that will eventually create another once in a “lifetime buying moment”.
Absurdity. A statement or belief manifestly inconsistent with one’s own opinion.
Ambrose Bierce


-
I know Mike is a very solid investor and respect his opinions very much. So if he says pay attention to this or that - I will.
~ Dale G.
-
I've started managing my own investments so view Michael's site as a one-stop shop from which to get information and perspectives.
~ Dave E.
-
Michael offers easy reading, honest, common sense information that anyone can use in a practical manner.
~ der_al.
-
A sane voice in a scrambled investment world.
~ Ed R.
Inside Edge Pro Contributors

Greg Weldon

Josef Schachter

Tyler Bollhorn

Ryan Irvine

Paul Beattie

Martin Straith

Patrick Ceresna

Mark Leibovit

James Thorne

Victor Adair