Gold & Precious Metals

WARNING: Stock Market Sees 6 Titanic Or Hindenburg Omen Warnings In The Past 30 Days!

Despite hitting new all-time highs on the Dow this week, the major index has now seen 6 Titanic or Hindenburg Omen Will-This-Take-Markets-To-The-Brink-Bring-Consumers-To-Their-Knees-copy-864x400 cwarnings in the past 30 days!  An illustration showing the warnings is included in this piece.

Another Nasdaq Warning
June 16 (King World News) – From Jason Goepfert at SentimenTrader:  On Thursday, there were more stocks that slid to a 52-week low on the Nasdaq than rallied to a 52-week high. Coming so soon after a new high in the Nasdaq Composite, this triggered a Titanic Syndrome signal. There have now been 6 Titanic or Hindenburg Omen warning signs in the past 30 days, one of the larger clusters during this bull market…

….read more HERE

…also from KingWorldNews:

Celente – This Trigger For A Global Stock Market Crash Will Devastate The World

Legal Pot Is Making This Industry Paranoid about Lost Profits

In my most recent Money and Markets articles, I’ve put you on the inside track about a rapidly growing, yet mostly still under-the-radar, industry. One that the world’s super-rich are quietly funding with their own money, in pursuit of potentially eye-popping investment returns.

I then told you that industry was the legal cannabis business.

What’s more, I reported that, according to reputable market research, the legal marijuana industry in the U.S. was a $3.4 billion business in 2015. In 2016, this market doubled to $7.1 billion. 

Now, two major studies show that legal marijuana sales will top $40 billion in the U.S. over the next five years. That number could surge to $50 billion over the next decade … or sooner.

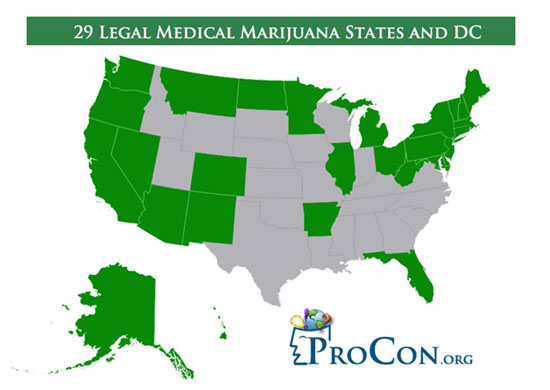
Marijuana is legal in more than half of the states in the U.S., for medicinal and even recreational use. With marijuana going mainstream, some of corporate America’s most-profitable and high-profile industries are recognizing the threat marijuana poses to their profits. 

And they are starting to fight back in a big way …

pot

Last week, you learned that the marijuana industry’s biggest enemy is not the Trump administration or U.S. Attorney General Jeff Sessions. 

Rather, it’s the Big Pharma companies like Teva Pharmaceuticals (TEVA)Pfizer (PFE)Johnson & Johnson (JNJ) and Allergan (AGN). Companies with big stakes in the pain-treatment game.

But the legal-pot business faces another formidable foe. 

Just like Big Pharma, the booze business is scrambling to protect billions of dollars of its own revenue.

Yes, ironically, that’s the very same industry that made Joe Kennedy Sr. rich. If you’ll remember from my May 26 article, alcohol sales funded the Kennedy family fortune when Prohibition was repealed in the U.S. in the 1930s.

And now, the big players in the alcohol business are beginning to push back on the marijuana legalization initiative.

Here’s why …

If the estimated yearly demand for marijuana is in the right ballpark, then more Americans crave cannabis than cabernet or candy bars

This puts the potential market for recreational marijuana in the Big Three of America’s vices … trailing only cigarettes and beer, as shown below.


Click image for larger view

The booze business’s paranoia seems to be justified, according to data from well-regarded Wall Street investment research firm Cowen & Co. 

That’s because the number of drinkers who also smoke cannabis has increased over the past decade. At the same time, the number of cannabis smokers who drink has declined.

Indeed, Cowen analyst Vivien Azer said the alcohol industry is the group that could lose the mostif marijuana is legalized at the federal level. 

All told, Cowen estimates that the recreational pot industry will reach $50 billion in sales by 2026.

“There is real risk to alcohol consumption,” Azer said. “If consumers are going to dual use, I would expect that they would moderate their alcohol consumption to accommodate the addition of a second social lubricant.”

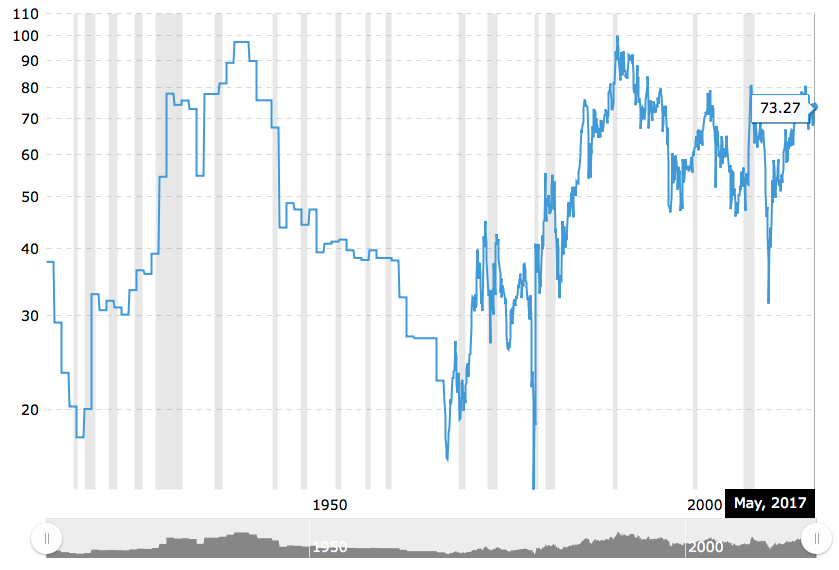
“We believe alcohol could be under pressure for the next decade, based on our data analysis covering 80 years of alcohol and 35 years of cannabis incidence in the U.S.,” Azer wrote in a note to clients. “Since 1980, we have seen three distinct substitution cycles between alcohol and cannabis; we are entering another cycle.”

Following on, she noted that during the three most recent cycles of alcohol consumption, there was a “notable inverse correlation with cannabis use.”

Moreover, alcohol consumption in the 18- to 25-year-old demographic has declined for five straight years (through 2015). Meanwhile, marijuana usage has increased. 

Here’s a chart that Azer used to make her point …

 
Click image for larger view

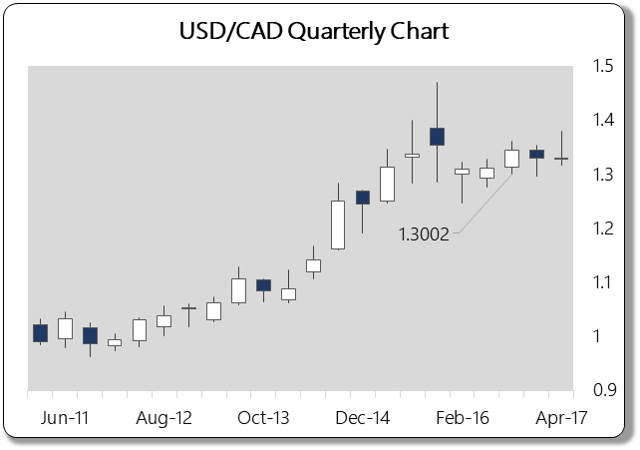
Armed with this information, Cowen recently lowered its rating on Molson Coors (TAP) from “Outperform” to “Market Perform.” It also reduced its TAP price target to $105 from $120, saying the beer company’s sales will suffer due to increasing marijuana use in Canada.

But there’s even more bad news for the booze industry …

Some 27% of beer drinkers said they have already substituted cannabis for beer … or would make that switch if marijuana was legal in their state. 

That’s according to a recent report from the Cannabiz Consumer Group (C2G). C2G is a market research firm that specializes in forecasting the impact of cannabis on consumer spending.

C2G says that brewers — who in 2015 sold more than $105 billion worth of beer — stand to lose the most from the trade-off between alcohol and marijuana. Specifically, about $2 billion annually. They also note that wine and hard-spirits sales will be affected.

Ultimately, their research analysts project, “Cannabis will cost beer 7% of its market and create a new $50 billion industry.”

$50 billion is nothing to take for granted!

And with $50 billion at stake, it’s no wonder the alcohol industry has been caught multiple times lobbying to keep pot illegal.

Since it’s likely only a matter of time before consumers decide to “fire one up” instead of “turning one up,” you should consider adding some marijuana stocks to your portfolio.

But with more than 200 marijuana stocks currently available on the publicly traded markets, you’ll need to do your homework, be selective and carefully consider your own risk profile.

Best wishes,

Bill Hall

Falling Rocks in the Promised Land

Screen Shot 2017-06-16 at 6.56.50 AM

Yes, traumatic market events (falling rocks) occur, even though markets are “managed,” statistics are manipulated, and politicians pretend to care about something besides their next election.

From John P. Hussman, Ph.D. Fair Value and Bubbles: 2017 Edition

“Unfortunately, investors seem to have concluded that central bank easing is omnipotent, despite the fact that the Fed eased persistently and aggressively, to no effect, through the entire course of 2000-2002 and 2007-2009 market collapses.”

From Bill Gross: Bill Gross Says Market Risk is Highest Since Pre-2008 Crisis

 “Central bank policies for low-and-negative-interest rates are artificially driving up asset prices while creating little growth in the real economy and punishing individual savers, banks, and insurance companies, according to Gross.”

From Billionaire Paul Singer:

“I’m very concerned about where we are in terms of the financial system, the economy, the American economy, the Global economy… After nine years of this artificial levitation on the part of financial assets – high-end real estate, art, the things that rich people buy – I think what we have today is a global financial system that’s just about as leveraged, and in many case more leveraged than before 2008.”

Madoff Whistleblower Harry Markopolos Has Uncovered a New Fraud

Markopolos called what is left of the MBTA’s pension (Boston Transit Authority) a ‘Tender Vittles retirement plan’ meaning (sarcastically) that its participants would be eating cat food.” Is this different, except in degree, from Illinois, Chicago, New Jersey, CalPers (California) and many other pension plans?

“No good outcomes result when you mix politics and money,” Markopolos said.

From Karl Denninger: Illinois is Collapsing: It’s Coming Everywhere

“It was obvious that Illinois was going to fail as a state before I left in 2000.”

Denninger, in my opinion, sees the past, present, and future more clearly than most people, including self-motivated politicians and Wall Street Bankers. He is worried about ever-increasing U.S. government expenditures, long term commitments, and national debt. He also warns about public and private pension plans, medical/sick care costs and more.

Speaking of bubbles and near-bubbles, consider the “Everything Bubble,” and the exceptional rallies in the NASDAQ 100 and Amazon stock. The current rallies are not as steep as during the 1999-2000 NASDAQ but the NASDAQ 100 and the “FAANG” (Facebook, Apple, Amazon, Netflix, Google) stocks have risen far too high.

What created the bubbles and near-bubbles? Central banks created $15 trillion from “thin air” and much of that “funny money” boosted stock prices. Japanese, Swiss and other central banks intentionally created currency and bought U.S. stocks, such as Amazon and Apple, which also promoted the NASDAQ levitation.

An excellent 20 minute video explains how central banks “create” currencies and expand the total digital debt and credit.

Crash – Correction?

The U.S. stock markets could have crashed in 2015, but did not. They could have crashed several times in 2016, but did not. They could have crashed in 2017, but are hitting all-time highs instead. The sizable rallies have been enabled by central bank purchases of stocks.

What happens if central banks cease purchases, or “heaven forbid,” those central banks sell aggressively? Could such sales create a “market event” to crush an economy or a sitting President or be used to enrich Wall Street?

The 1987, 2000, and 2008 market crashes hurt most people. Preparation, in case central banks don’t printenough currency to keep bubble-like markets inflated, is appropriate. Brilliant and wealthy people are concerned about the global financial system and the potential disasters created by excessive debt, central banks and politicians.

Hindenburg Omen: We Got an Official Confirmed Hindenburg Omen Stock Market Crash Warning Signal

Robert McHugh, Ph.D. says his revised Hindenburg Omen seldom occurs but when it does, pay attention. It is not a guarantee of a crash, but it is noteworthy!

Europe: Banco Popular failed in Spain. Italian banks are shaky. Are Deutsche Bank and Chinese wealth management Ponzi debts next?

Repeat:

“No good outcomes result when you mix politics and money,” Markopolos said.

I SUGGEST:

Gary Christenson

The Deviant Investor


Pop Goes The Housing Boom… In Canada

766147-14975422266578183Summary

China’s new controls seek to slow down capital flight.

Canada’s housing boom is vulnerable.

The Canadian dollar’s rally is overdone.

We’re headed for another housing bust. This time in Canada. And the key is China.

It’s no secret that Chinese investors, seeking asylum from the slow-motion credit bust underway there, have been dumping tons of cash into Canadian real estate.

But it looks like a number of events are coming together at the same time to blow up that market before the end of 2017.

…continue reading HERE

Gold-Silver Ratio: Debunking The Myth

A 16-to-1 gold to silver ratio has been the Holy Grail of some silver investors since the mid-sixties.

Unfortunately, fifty years later, it is a quest that continues unabated without success.

In fact, there is evidence that contradicts and widens the chasm that separates wishful thinking from reality.

In the Mint Act of 1792, the U.S. government arbitrarily chose a 16 to 1 ratio of gold prices to silver prices. The actual prices were set at $20.67 per ounce for gold; and $1.29 per ounce for silver.

Prior to 1792 the U.S. did not strike its own coinage. That changed with the establishment of the Philadelphia Mint, which was also authorized by the Mint Act of 1792.

The official price of silver and the market value of silver remained relatively close until the late 1800s.

In 1859, prospectors discovered the Comstock Lode in Virginia City, Nevada. It was the largest silver vein in the world.

Combined with silver already in circulation, this additional supply “flooded the market” and forced the value of silver well below its official price of $1.29 per ounce. This is another classic, historical example of inflation in a pure sense – a devaluation of the money supply. The silver in a silver dollar was now worth much less than the official price of $1.29 per ounce. (Also see: Mansa Musa, Gold, And Inflation)

Congress responded promptly by passing the Coinage Act of 1873, ceasing all production of silver coinage in the U.S. Five years later it reversed itself by passing the Bland-Allison Act which restored silver as legal tender and required the U.S. Treasury to buy large quantities of it. Silver producers were awash with the metal and it was hoped that this new agreement would create more jobs within the mining industry.

A series of other legislative efforts either repealed earlier bills, and/or furthered the requirements of the U.S. Treasury to purchase silver to support the market or to use in the production of silver coinage.

For the next seventy years, the U.S. government ramped up its efforts to control the price of silver. It offered to buy silver at artificially high prices which in turn over-stimulated production of the white metal. This was pleasing to voters in silver mining states. But in the process, the U.S. government acquired a stockpile of over two billion ounces of unneeded silver.

All the while, the market price for silver continued to decline. In 1887, the average annual price of silver dropped below $1.00 and by 1932, at the depths of the Depression, reached a low of $.25 per ounce.

Screen Shot 2017-06-16 at 6.34.14 AM

Also concurrent with this, the gold-to-silver ratio continued an upward march. By the time silver reached its Depression era low of $.25 per ounce, the gold-to-silver ratio had risen to 80-to-1 ($20.67 divided by $.25). By 1940, the ratio had risen to an all-time high of 97-to-1 ($34.00 divided by $.35).

Silver’s primary value as an industrial commodity asserted itself beginning with U.S. involvement in World War II and the gold-to-silver ratio began a gradual decline that lasted for twenty-seven years reaching a low of 16-to-1 in 1968.

After that, and coinciding with free markets for both gold and silver, the ratio proceeded to climb all the way back to near 100-to-1 in 1991. There was one, very brief, period of six months between July 1979 and January 1980 when the ratio fell from 32 down to 16 but was back up to 40 almost immediately after that.

Silver investors who are depending on a declining gold-to-silver ratio are betting that silver will outperform gold going forward. But, if anything, the chart (see link above) shows just the opposite. For the past fifty years, the ratio has held stubbornly above a rising trend line taking it to much higher levels.

The last spike of any consequence below that trend line happened in 2011; and lasted all of three months.

Other than that, any downward moves of significance in the ratio were from much higher levels. And, to add further discouragement, some favorable – for silver – changes in the ratio occurred with actual silver prices either in decline or already at much lower levels.

Gold and silver are two different items with their own independent functions and uses.

Gold is real money. Silver is an industrial commodity with a secondary role as money.

The gold-to-silver ratio that existed one hundred fifty years ago was mostly the result of political influence and appeasement. It was an arbitrary number.

It might be reasonable to expect a ratio for purposes of consistency and uniformity within the existing monetary system. However, the price used for silver at $1.29 per ounce was considerably in excess of the current (then) market price. It was an early form of price support.

There is no fundamental reason which justifies any particular ratio between gold and silver.

(also see Hi Yo Silver! Sort Of… and Silver Is Not Real Money)