
Gold & Precious Metals

We increasingly see claims low volatility in the markets may be structural. Even as we agree that some of the analyses we see make good points, we are concerned we may be setting ourselves up for a major shock. Let me explain.

Before getting into the details about the current environment, let me make some general observations. In my experience, complacency, with its cousin low volatility, is the best bubble indicator I am aware of. Perceived safety gets investors to pile into investments that they later regret. When it happens on a massive scale, major market distortions may be created that can lead to financial crises. And as the tech bubble that burst in 2000 shows, even if there is no systemic risk, the unwinding can be most painful to investors. In 2008, however, the perception that home prices always had to rise had become engrained in highly levered, yet illiquid, financial instruments, causing the unwinding to bring the global financial system to its knees. In our assessment, however, make no mistake about it: assuming for a moment the next crash won’t take down a major bank, doesn’t imply it cannot wipe out much more of your wealth than you ever anticipated.
Indeed, lower bank leverage is given as an argument as to why volatility is lower these days. Except that the run-up to the financial crisis of 2008 – a period in which banks were extra-ordinarily levered – also showed low volatility in a variety of markets. It was the perceived safety, embodied by quasi-sophisticated value-at-risk (VAR) models that got risk managers at financial institutions to gear up. What could possibly go wrong, right?
A more convincing argument I hear as to why low volatility is structural may be that information nowadays gets absorbed more quickly. On the one hand, we have computers scan the news in milliseconds, often trading without human intervention. And we have more computing power, allowing for a more efficient implementation of any investment process. Market makers in exchange traded funds also help in the execution efficiency of markets, possibly exerting downward pressure on volatility. However, let’s not forget that volatility lowered in this fashion may have the same implication as low volatility in the building up of any bubble: it is the perceived risk that is lower, not actual risk. Machines are fantastic at certain aspects, be that keeping spreads tight in an exchange traded fund, or scanning Twitter for keywords. Trades initiated in this fashion provide liquidity to the markets, but that liquidity can evaporate rather quickly when the machines go off-line. Let there be a glitch in the markets for whatever reason (say, someone dumps a large number of derivatives in off hours), and today’s incarnation of automated traders tend to wait it out. In the meantime, stop loss orders of other market participants may be triggered, possibly causing flash crashes.
One argument is that low volatility is due to a lack of economic surprises. We get emotional about elections, but when the economy is stuck in a low growth environment with few deviations, it only makes sense for markets to be less volatile as well. That may be the case, but in our assessment won’t stop from investors pushing asset prices to unsustainable levels on that backdrop.
I have little doubt that a substantial driver of low volatility may be central banks. Low interest rates and quantitative easing (QE) compress risk premia; in plain English, this means not only that junk bonds trade at a lower premium over Treasuries, but that perceived risk is reduced in all markets, including equities, causing volatility to be lower. When central bankers “do whatever it takes,” it is no surprise that investors chase yield without being concerned about negative consequences.
But when central bankers “taper” their purchases, odds are that volatility comes back as taper tantrums have shown. The same should be the case when the Fed raises interest rates or “normalizes” its balance sheet. But wait: this hasn’t happened, emboldening those who argue we have a structural change. With all due respect, I believe this is the wrong conclusion: in 2016, the Fed was hostage of the markets. Eager to raise rates, the folks at the FOMC realized they could only raise rates if the market let them. Any Fed official will tell you they won’t be held back from raising rates simply because equity prices might fall. Indeed, any incoming Fed chair (and we will have a newbie early next year) will take the job with the best of intentions, not be bossed around by the markets. Except that falling equity prices are often associated with expanding risk premia, i.e. plunging junk bonds; that is, they are associated with deteriorating financial conditions. And the Fed is always ready to respond to “deteriorating financial conditions.” You tell me what the difference is in an era of elevated asset prices.
Still, the market appeared to present the rate hike earlier this year on a silver platter. Just as a bull market makes investors feel very smart, a rate hike where the wheels don’t fall off the markets makes the guardians at the Fed feel like they are doing their job properly. Maybe so. I have a more somber interpretation: in hesitating so long to raise rates, the Fed has fallen ever more behind the curve. Sure, the Fed may raise nominal rates, but real rates may continue to be low to negative. Federal Funds futures currently price in 2.5 more rate hikes until the end of 2018, including the one we are expecting today (we write this analysis before the June FOMC decision). How is that possible with an economy that is allegedly booming, where wage pressures, albeit not severe, are gradually creeping higher? As such, my sanguine interpretation is that the reason the market is not spooked is that it thinks the Fed is going to stay “behind the curve.”
As a word of caution, with a new Fed chair coming next year, I would not count on the market being complacent; the new chair may well try to assert himself or herself, causing risk premia to rise. The pressure cooker may well try to release steam once again, until the Fed chair then reacts to what may well be deteriorating financial conditions.
This implies the Fed won’t be able to normalize its balance sheet, but is more likely to be heading towards QE again. Indeed, my interpretation of FOMC talk is that many members believe more QE is not a question of whether, but of when.
If my analysis is correct, it suggests low rates for a very long time. And that, in turn, may of course mean that risk premia will ultimately be compressed yet again. So, maybe, it is different this time?
Let’s look at equity investors. The brilliant minds (brilliant because they have made lots of money in recent years, please take this reference as being cynical) know that central banks will come to the rescue. So why not buy the dips? And stock prices always go up, don’t they? You can’t possibly be smarter than the masses (the index), and the index is going up, so buy, buy, buy. And we hear that this is different from the dot com bubble as, according to some metrics, stocks aren’t terribly overvalued and could no up another 20%; let’s make that 50%.
I hear arguments for buying bitcoin, as it could go up tenfold or more, but it can only go down 100%, so the risk/reward must surely be worth it.
Indeed, I agree that it is extremely difficult to identify the top in a bubble.
The question, in my view, is whether it’s better to be early or to be late in taking chips off the table. It clearly depends on the risk profile of investors, but I would like to caution that those who don’t prepare early may well be late, terribly late. Fear not, as the government might bail you out. Except that they may not this time around, as banks aren’t over-levered this time around. In our assessment, you ain’t getting a bailout unless a systemically important institution is at risk.
Without providing specific investment advice, my view is that the best short-term strategy may be a good long term strategy. That may mean to rebalance a portfolio, take chips off the table, when times are good. The problem is, where on earth does one put those chips? Historically, one would rebalance to fixed income, but in an era of extraordinarily low rates, investors are reaching for yield in the bucket that ought to be “safe.” You don’t need to be a doomsday forecaster to suggest that many investors may be over-exposed to risk assets as those higher yielding fixed income instruments may exhibit a high correlation to equities in a downturn. And when the masses all realize this – granted it may take considerable time as those ‘buying the dips’ won’t be rooted out overnight – the carnage in the markets may well be severe. Is the recent sell-off in the Nasdaq the canary in the coal mine? We think it is, but the buy-the-dip troopers may well prove us wrong. For a day. Or a week. Or longer. But maybe not.
So while the banks may not need a bailout, I’m not so sure about pension funds or individual investors. Yet, “needing a bailout” and actually getting one are different stories.
This analysis wouldn’t be complete without looking at another elephant in the room: Chinese banks. Credit growth in China has been breathtaking; financial institutions, in my assessment, carry too much leverage. Yet markets are well behaved. So if you are looking for a more traditional type of blow-up, China is a good candidate. Chinese banks are systemically important and, as such, candidates for bailouts. China is a perfect example in my view where you have a market that appears calm, yet is subject to underlying pressures that we believe are unsustainable. That doesn’t mean it is obvious how any unwinding may unfold. But if past shockwaves attributed to China are any indication, it may not bode well for risk assets.
All of this has led to a surge in index investing. The industry argues that the average investor cannot beat the index, especially after fees. Well, it’s a mathematical certainty given that the average cannot beat the average when you deduct fees. That doesn’t mean investors should throw risk management out of the window; it doesn’t mean buyers of tulips in 17th century Netherlands were right; it doesn’t mean buyers of tech stocks in the late 90s were right.
Mind you, there are so many indices one can track these days that one can hardly call it passive, but active management is dead, a dying breed; or is it merely in a cyclical low? Seemingly ever rising markets appear to have created a feedback loop. To me, this question is directly related to volatility: when risk premia are low, the dispersion of risk is low, making it difficult for active managers to shine. It doesn’t help that many active managers promote lower returns. Why would you embrace lower returns than you can attain by chasing high flying stocks? The answer, of course, is risk management: those high-flying stocks might come crashing down.
Should risk premia rise once again, i.e. should volatility move higher, we believe there should be a larger number of active managers standing out. As such, my take is that active management will be embraced once again. That said, we may need substantial carnage in the markets for investors to realize their need to hire an active manager once again. And tomorrow’s active manager may well be different from yesterday’s given how the industry has changed. Just a few years ago, one would have been hard pressed to find an active manager to switch to different ETFs depending on the market environment. Similarly, a new breed of systematic trading strategies has risen that were a rarity a few years ago. In between, there is a range of new tools available to traditional active managers that may well become popular again.
What it comes down to is constructing and managing a portfolio that suits the risk profile of the individual, the family office, the pension plan. It’s not about constructing a portfolio that suits fast money pundits or cocktail talk.
On a separate note on how to navigate these markets, please register for our June 22 Webinar entitled: “Invest in Yourself – What Your Advisor Doesn’t Tell You”. Make sure you subscribe to our free Merk Insights, if you haven’t already done so, and follow me at twitter.com/AxelMerk. If you believe this analysis might be of value to your friends, please share it with them.
Axel Merk
President & CIO, Merk Investments
This report was prepared by Merk Investments LLC, and reflects the current opinion of the authors. It is based upon sources and data believed to be accurate and reliable. Merk Investments LLC makes no representation regarding the advisability of investing in the products herein. Opinions and forward-looking statements expressed are subject to change without notice. This information does not constitute investment advice and is not intended as an endorsement of any specific investment. The information contained herein is general in nature and is provided solely for educational and informational purposes. The information provided does not constitute legal, financial or tax advice. You should obtain advice specific to your circumstances from your own legal, financial and tax advisors. Past performance is no guarantee of future results.

The Life Expectancy of Economic Expansions
Introduction
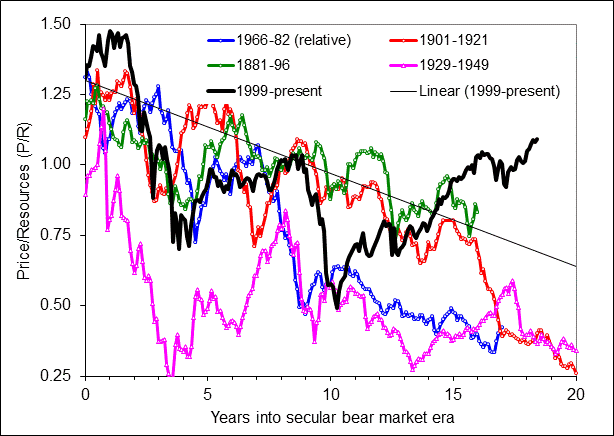
Two years ago, I wrote an article forecasting a large decline in the stock market in the next three years.[1] The focus of the article was on the forecasted size of the anticipated bear market and the justification for this forecast. There was no discussion of when such a decline might happen. In fact, the only mention of timing was in the title, which implied that it would start within the next three years. This three-year figure was the result of no deep analysis, I simply noted that the current business cycle had been going on for 7½ years and the longest business cycle on record lasted about 10½ years. The three years were simply the difference between these two. As the figure at the top shows, P/R had started to fall around the time of the article and continued to do so for nearly a year. Since then a new rally has ensued and the market has moved to higher valuations.
The new advance raises the question of just when is this decline going to happen, or is the analysis simply wrong? Since the anticipated large bear market would be accompanied by a recession, this question can be reframed as when will this expansion end, or, just how long do economic expansions last?
Analysis
The best evidence for a natural length for expansions is the fact that none of the 17 peacetime expansions before 1933 lasted longer than 36 months. Figure 1 plots the probability that one of these expansions was still in progress as a function of length. The dotted line is a linear regression fit, which implies these expansions had a natural lifespan of just over three years.
Figure 1. Distribution of business expansion lengths (data from NBER)

Three quarters of business expansions since 1933 have been longer than 36 months suggesting that something changed around that allows business expansions to survive longer today. One possibility is government policy. The economic expansions during the Civil War and World War I, at 46 and 44 months respectively, were longer than any of the other expansions before 1933. The reason for this is easy to understand, while the war lasts and the government is buying massive quantities of war materiel, recession is unlikely. In the aftermath of the 1929-1933 economic depression, the Roosevelt administration engaged on a program of massive monetary stimulation, by suspending the gold standard, followed by creation of a series of government job-creation and welfare programs. These programs provided a program of government spending like that during a war. As a result, the federal deficit averaged over 4% from 1933 to 1937, when spending was cut, bringing the budget back into balance in 1938. This expansion, at 49 months was the longest in history up to that time.
The US entered World War II during the next expansion, which then lasted until 1945, establishing a new record length of 80 months. Furthermore, this expansion was not followed by a deep depression that undid much of the employment gains made during the WW I and New Deal expansions. This experience led to changes in economic belief systems symbolized by the 1946 Employment Act, which authorized the government to promote maximum employment, production, and purchasing power and established the council of economic advisors.[2] The economic views of political and economic elites became more favorably disposed towards countercyclical policy intended to moderate the business cycle. Economic expansions grew longer as policymakers gained experience. The record-long WW II expansion was exceeded by business cycles in the 1960’s, 1980’s, 1990’s, and today. Fifteen years ago, I noted this 1933 shift in length in an article on the relation between business cycles and longer economic cycles in which I classified the periods before and after 1933 as unregulated and regulated eras.[3]
The fact that the last expansion ended quite early compared to adjacent cycles suggests that policymakers have not yet conquered the business cycle, economic expansions still end, and lengths have not been monotonically increasing. To this end the analysis of economic expansion longevity presented earlier still seems appropriate. Figure 1 also shows a plot of the 13 expansions in the regulated era. Two regression lines were needed to fit the data. Extrapolation of the second implies a lifespan for regulated expansions of just under 11 years.
Another way to think about this is in terms of the probability of recession as a function of length or in terms of the number of years an expansion can be expected to last given its age. Table 1 shows the results of calculations of these statistics for the regulated era. Shown is the probability of recession in the next year for expansions in regulated era. Also shown is the expected length of expansion as a function of its current age. The values for expansion lengths beyond 10 years (the longest one ever) is based on the extrapolation of the regression line shown in Figure 1.
Table 1. Expansion mortality rate and life expectancy of expansions as a function of age
| Year | Recession Probability (%/yr) | Life Expectancy (yrs) |
| 4 | 15 | 7.4 |
| 5 | 17 | 7.9 |
| 6 | 21 | 8.4 |
| 7 | 26 | 8.9 |
| 8 | 35 | 9.4 |
| 9 | 55 | 9.9 |
| 10 | 73 | 10.4 |
When I wrote the June 2015 article, the current expansion was 6 years old, for which Table 1 implies it would last another 2½ years. Since the stock market typically peaks about six months before the economy, this suggests a peak around two years later, or about now. Such an expectation is consistent with the three years given in the article title. But given that the business expansion is now 8 years old, Table 1 projects a median value of 1½ additional years of expansion, corresponding to a bull market peak about a year from now. That is, there is now a 50% probability that the current bull market will end more three years after June 2015. Based on the 11-year projected lifespan, this expansion could last as long as another three years. Assuming the median expectation of another year for the bull market, extrapolation of the post-election rally projects a level approaching 25000, implying a much larger decline than the 10000-point forecast in 2015.
References:
[1] Alexander, M. A., 10000 point decline in the Dow in the cards over the next three years, Safehaven, June 10, 2015. (http://www.safehaven.com/article/37933/stock-cycles)
[2] De Long, J. Bradford, 1996, Keynesian, Pennsylvania Avenue Style: Some Economic Consequences of the Employment Act of 1946, Journal of Economic Perspectives, 10(3), 41-53. http://www-personal.umich.edu/~kathrynd/JEP.DeLong.pdf
[3] Alexander, M. A., Generations and Business Cycles – Part I, Safehaven, November 6, 2002. (http://www.safehaven.com/article/85/generations-and-business-cycles-part-i)

 The latest selloff in oil prices have left speculators in a predicament: The fundamentals continue to look poor with unimpressive drawdowns in crude oil stocks, but there is a general consensus that the extension of the OPEC deal should push the market towards a rebalancing over the next few quarters.
What that means for short-term movements in prices is unclear. The unpredictability of today’s oil market is leaving some investors burned by unexpected price gyrations. For example, just ahead of the recent selloff in prices last week, oil traders bought up bets on rising prices. Hedge funds and other money managers increased their bullish bets by 7.3 percent for the week ending on June 6, but prices plunged by 5 percent a day later.
Traders looking for some direction might want to consider the futures market, where a contango structure has reemerged. A contango, in which near-term oil futures trade at a discount to futures dated further out, is a symptom of oversupply. For example, two weeks ago, futures for December 2017 traded at a $1 per barrel discount compared to contracts for delivery in December 2018. That discount ballooned to $1.49 per barrel last week, according to Bloomberg, a sign that investors are growing more pessimistic about oversupply conditions this year. “Brent spreads are getting clobbered,” Amrita Sen, chief oil market analyst at consultants Energy Aspects Ltd., told Bloomberg. “The Atlantic Basin is awash in light crudes from Nigeria and Libya.”
The December 2017-December 2018 spread is now deeper into contango territory than at any point since the original OPEC deal back in late 2016. In recent months the spread was positive – that is, the December 2017 contract traded at a premium compared to contracts a year later, a situation known as backwardation.
Several investment banks have insisted that OPEC’s best hope at draining inventories was to do just that: Induce a state of backwardation into the market. By driving up near-term prices while pushing down the back end of the futures curve, the argument goes, OPEC could scare off shale drilling. Producers would be deprived of finance by skittish lenders, and they would be reluctant to drill if they expected prices to be lower in the future. OPEC could achieve this state of backwardation by maintaining cuts this year while also signaling production growth in the future.
If that is the strategy, so far it has not succeeded. The reemergence of the contango reflects concerns about the glut persisting through this year.
Meanwhile, investors are growing wary of an energy market that continues to spurn them. Energy companies have been among the worst performing stocks in 2017. The poor results are leading to an exodus of capital from energy-linked exchange-traded funds (ETFs). Over the past three months, more than $300 million have been pulled out of energy ETFs, according to Bloomberg, which will likely result in the first quarterly outflow of capital from energy ETFs in more than two years. “People are re-allocating money to sectors that are performing better, technology or health-care, versus sitting on a sector like energy that’s down 10 plus percent,” Jeff Carbone, managing partner of Cornerstone Financial Partners, told Bloomberg. “We’re bottoming, but what pushes it higher? That’s the hard part.”
The flip side is that some think that the selloff in energy is overdone. That is exactly why hedge funds and other money managers bought up a greater net-long position in early June, even though some might feel they got in at the wrong time. Nevertheless, the cratering of oil prices last week has opened up a buying opportunity. “When you start to approach $45 a barrel in WTI, you’re in an area where you do find some price support and I think there has been some evidence last week of investment flows coming back into crude oil,” Petromatrix strategist Olivier Jakob said in a Reutersinterview. Jakob cautioned that the room on the upside could still be limited. “You have to be careful not to be too optimistic for now,” he said. “Physical differentials are still under pressure and the time structure is still under pressure in Brent. It’s a bit premature to call for much higher oil prices.”
So what happens next depends on who you ask. Market fundamentals look weak but some traders see attractive entry points.
Also from OilPrice.com: North American Pipeline Capacity Crisis Looms Large


Legendary investor Jim Rogers sat down with Business Insider CEO Henry Blodget on this week’s episode of The Bottom Line. Rogers predicts a market crash in the next few years. One that he says will rival anything he has seen in his lifetime. Following is a transcript of the video.
Rogers: I learned very early in my investing careers: I better not invest in what I want. I better invest in what’s happening in the world. Otherwise, I’ll be broke. Dead broke. Well, what’s going to happen is it’s going to continue. Some stocks in America are turning into a bubble. The bubble’s gonna come. Then it’s gonna collapse and you should be very worried. But Henry, this is good for you. Because someone has to report it. So you have job security. You’re a lucky soul.
Blodget: Well, yeah, TV ratings do seem to go up during crashes but then they completely disappear when everyone is obliterated, so no one is hoping for that. So when is this going to happen?


-
I know Mike is a very solid investor and respect his opinions very much. So if he says pay attention to this or that - I will.
~ Dale G.
-
I've started managing my own investments so view Michael's site as a one-stop shop from which to get information and perspectives.
~ Dave E.
-
Michael offers easy reading, honest, common sense information that anyone can use in a practical manner.
~ der_al.
-
A sane voice in a scrambled investment world.
~ Ed R.
Inside Edge Pro Contributors

Greg Weldon

Josef Schachter

Tyler Bollhorn

Ryan Irvine

Paul Beattie

Martin Straith

Patrick Ceresna

Mark Leibovit

James Thorne

Victor Adair