
Price action over the prior week
Asset protection
 Summary
Price action over the prior week.
Anecdotal and other sentiment indications.
Price pattern sentiment indications and upcoming expectations.

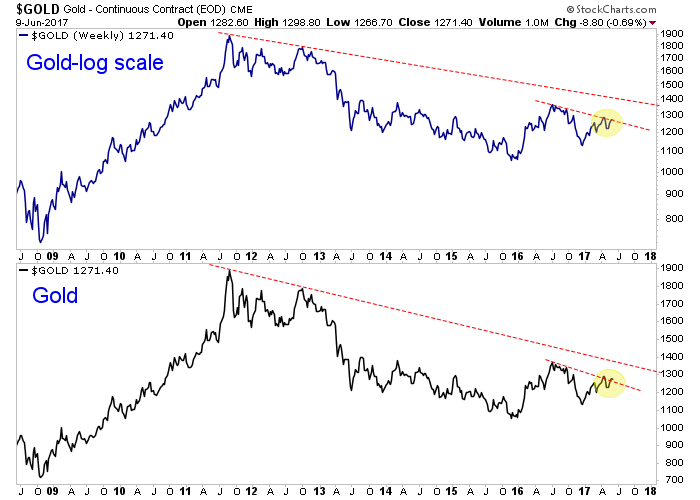
Traders and investors noted and celebrated Gold’s alleged breakout from a its downtrend that began in 2011. Tuesday Gold closed at $1297/oz after nearly touching $1299/oz. Gold appeared to break its downtrend on the many charts that made the rounds. However, upon further inspection, there was no breakout from the 6-year downtrend on the weekly chart nor is Gold likely to sustain its strength in the days ahead.
First, let’s take a look at Gold’s weekly line chart on both a log scale and normal scale. Weekly charts are more significant than daily charts. We can see (in the following chart) that Gold has not come close to breaking the downtrend line that began in 2011. That trendline resistance comes into play at much higher levels. Gold has appeared to break the trendline resistance from the 2016 highs but it could prove to be a false breakout if Gold can’t close above $1300/oz.
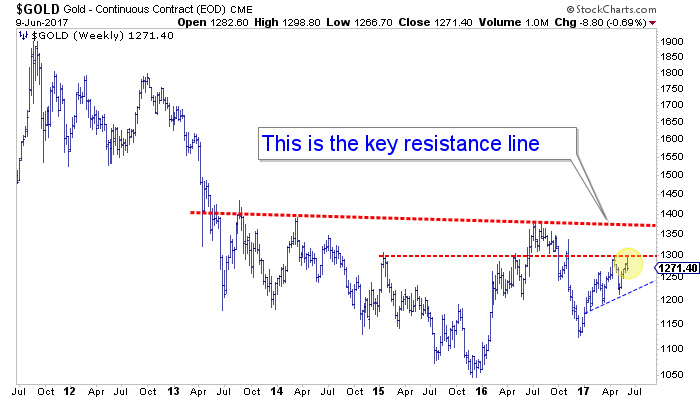
There are two things to highlight in the next chart. First, on the weekly chart we can see that Gold closed the week well off its high of the week. A bar or candle chart shows a weekly reversal. Gold closed the week below its April closing high and even below last week’s close! Second, the real important resistance for Gold is not the trendline from the 2011 peak but $1300/oz as well as the peaks from 2013 and 2014 when Gold began its attempt to bottom. Gold will only be in the clear when it can takeout $1350-$1375/oz.
The miners certainly aren’t supporting the bullish case for Gold. Both GDX and GDXJ have made lower highs since January and by weeks end they erased all the gains from Tuesday’s surge. Their negative divergence to Gold remains well intact.
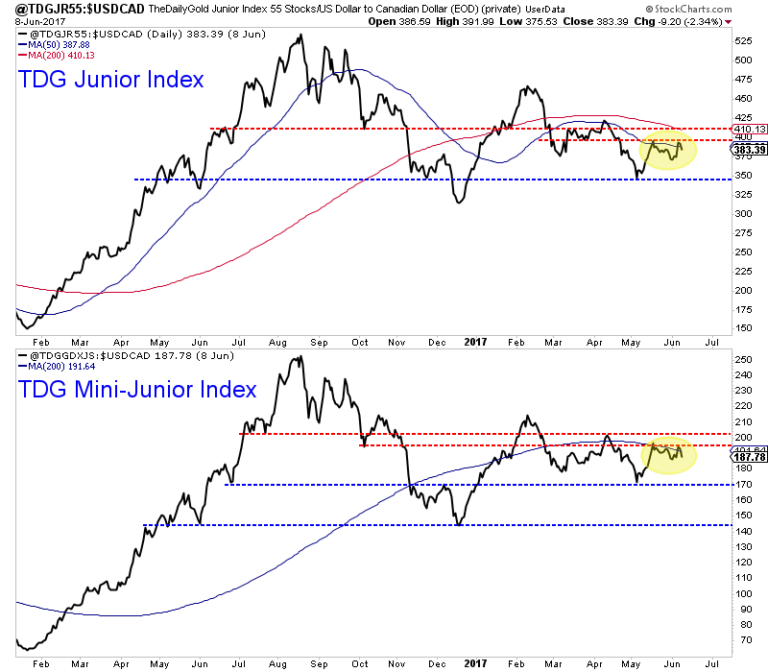
Meanwhile, in the charts below we focus on the junior sector, which is our preferred sector for investment. TDG Junior Index is an index of 55 junior companies. Over the past few months this index has failed thrice at a declining 50-day moving average. If the index cannot takeout Tuesday’s high then it is at risk of falling at least 10% to its May low. TDG Mini Index highlights the bottom half of the index which has been the strongest part of the junior sector. This index failed at its 200-day moving average in April and has failed at the now declining 200-dma thrice in the last few weeks.
Gold’s failure at $1300 and weekly reversal have nullified any apparent breakout on the daily chart. Moreover, some traders and investors are neglecting the more important resistance levels of $1300/oz and the $1350-$1375/oz which stem from the 2013 and 2014 tops. The weekly reversal in Gold coupled with the continued poor performance from the gold stocks suggests a real breakout in Gold is not yet in the cards. The positive aspect is this failed breakout could lead to a selloff and ultimately lower risk entry points in a number of juniors. We will exercise caution and patience as we expect metals and miners to trend lower in the days and weeks ahead. For professional guidance in investing in this sector consider learning more about our premium service including our current favorite junior companies.
Jordan Roy-Byrne, CMT, MFTA
A potential increase in risk may create massive opportunities for investors.
Throughout our ongoing analysis of the US markets, metals, energy and other market sectors, one thing we have seen over and over is that markets can, and often do, develop longer term trends than most people believe are possible or believable.
Recently, numerous analysts have been warning of potential “critical crashes” and “deep retracements” because of the fear that this rally is nearing some type of end cycle. We believe the charts tell the story of the investor sentiment and that, at some point in the future, these predictions may become true – but not today.
The VIX chart tells us quite a bit in terms of volatility, trend and potential market changes. One can see from this chart that the VIX has been trending within a “flag formation” that reaches a pinnacle in October 2017. This contracting flag formation is telling us that, unless the VIX breaks this range substantially, it should continue trading within this range for some time. At some point in the future, the VIX will break this flag channel and we could, then, see much more dramatic price volatility and corrections. But, until that time, contractions will continue to be muted in size and the bullish trend is likely to continue for a while.
Notice the averages are near the 12~13. There is a strong likelihood that the VIX could pop into and above these levels, briefly, through natural market contractions in the near future. By our analysis, roughly every 10~15 trading days (2~3 weeks) the VIX attempts to make some attempt at these levels from extreme lows.
I originally wrote this article on June 7th, but was not able to get it edited and posted until this weekend. See my statement below regarding when the VIX was set to spike:
This cycle indicates we should expect a VIX spike near June 9th or 12th and June 29th. Well, Friday the VIX spiked big as the NASDAQ crashed. In fact, I did take a net short position on the VIX as I expect stocks will continue their trend higher and thus the VIX will fade back down. I took this swing trade with my automated VIX trading system AT VIX
 The NASDAQ has been the driving force in the US majors for quite some time and the chart of the NASDAQ below proves why. The Tech heavy NASDAQ has been driven to new highs on what we believe is a “capital migration” from local and foreign sources into the stability of the US markets. Almost like the Dot Com bubble, investors are piling into the tech stocks with the belief that these companies will continue to generate billions in revenues and branch out into other enterprises to drive innovation and growth. I talked about this last week “The Fourth Industrial Revolution, which will be referred to as: Tech Hypergrowth”
One point of interest is that we have recently reached a Fibonacci 1.272 expansion level that will likely prompt a bit of price consolidation/rotation. This level is substantial enough to prompt some level of concern for price rotation, but not enough concern (yet) to warrant panic. Remember, the VIX will tell us when to panic and that will be when it breaks the flag channel and the majors drive lower in correlation with the VIX.
This 1.272 level is cause for “tightening and revaluing open positions”. It means we should be aware that price may attempt a contraction period at this level before attempting to resume trending. One thing to always keep in mind is that price is always seeking new highs or new lows. One way or another, it will get to one of those objectives.
Additionally, the clear price channel (red levels) on the NASDAQ chart shows us normal price boundaries. A short period of price contraction here would, potentially, allow for resumption of the bullish trend and allow for an additional 2~4% bullish run.


Metals are the other symbols we pay close attention to in regards to trending, correlation to the majors and to determine overall fear/greed factors within the markets. Pay close attention to Gold and Silver over the next few months. Gold has recently broken out of a SIX YEAR downward price channel temporarily last week and may attempt a move higher on global uncertainty. News from Europe, China and South America are concerning for the markets in general. Defaults, bankruptcies and “bail-ins” are the standard practice for these types of events. No reason to panic in regards to these events (yet) as they are fringe events – smaller, localized and isolated. Still, the metals markets will react to these concerns by factoring in the fear/greed levels globally.
Gold is also setting up a massive Flag Formation originating from December 2015. This formation tells us that potential upside targets, should a metals breakout/run happen, would be $1457, $1547 & $1788. We’ll keep you informed of opportunities as they play out with the metals.

Do you find this analysis helpful and insightful? Want more of it and my trades? Consider joining ActiveTradingPartners.com where our analysts and researchers are hard at work finding the best possible opportunities for you every day

A few stocks stand out in the 133 names on our list of monthly Upside Exhaustions as of June 5th; Facebook, Amazon, Netflix, Google and Microsoft.
Microsoft has a thirty-year history with six such signals and downside breaks of 12% to 35% before bottoming:
7/13/90 35% 4/19/91 22% 1/17/92 26%
7/21/95 26% 1/31/97 12% 11/14/14 19%
These corrections/consolidations lasted two to six months. Therefore, it would be appropriate for long- term investors to consider selling call options against current holdings. Traders should maintain tight stops.

The complete list of monthly Exhaustions as of June 5th in order of descending price:
NVR, AMZN, GOOGL, GOOG, ISRG, MTD, EQIX, CCL.B.TO, ULTA, BCR, MELI, AVGO, RE, BIO, MTN, TFX, GD, BDX, UNH, TMO, IDXX, NFLX, ROK, SVXY, LRCX, ANET, FB, MCD, SOXX, SYK, ITW, CB, ADBE, NEE, EFX, SHOP.TO, TAL, WCN.TO, AON, BABA, DE, FISV, ESLT, EA, ADSK, ALB, TQQQ, DTE, DGX, KLAC, CNR.TO, JKHY, SOXL, AFG, BMA, ACGL, WCN, V, CGNX, GPN, RACE, SUI, IDA, PNW, Q, FSV.TO, CBOE, SMH, FIS, ELS, ALL, MCHP, ATO, TXN, EIX, HTHT, TTWO, BR, EDU, SNPS, APH, MSFT, NEN, PCG, TTC, TMUS, RAI, PF, PAM, DOX, VVC, ATVI, BAX, WPK.TO, NFI.TO, AEE, AOS, BIP.UN.TO, CSX, PYPL, CHD, ANTX, GRT.UN.TO, EMA.TO, XEL, GGAL, CMS, AMAT, INFO, AGR, TRU, MZOR, ROL, PGR, GDDY, CMCSA, LNT, LOGI, TSM, TER, CDNS, MFI.TO, MU, BSX, NI, SQ, BLX.TO, ZPIN, CAS.TO, TGS, STM, TH.TO, AAR.UN.TO


BOB HOYE, INSTITUTIONAL ADVISORS
EMAIL bhoye.institutionaladvisors@telus.net WEBSITE www.institutionaladvisors.com
Opinions in this report are solely those of the author. The information herein was obtained from various sources; however, we do not guarantee its accuracy or completeness. This research report is prepared for general circulation and is circulated for general information only. It does not have regard to the specific investment objectives, financial situation and the particular needs regarding the appropriateness of investing in any securities or investment strategies discussed or recommended in this report and should understand that statements regarding future prospects may not be realized.
Investors should note that income from such securities, if any, may fluctuate and that each security’s price or value may rise or fall. Accordingly, investors may receive back less than originally invested. Past performance is not necessarily a guide to future performance. Neither the information nor any opinion expressed constitutes an offer to buy or sell any securities or options or futures contracts. Foreign currency rates of exchange may adversely affect the value, price or income of any security or related investment mentioned in this report. In addition, investors in securities such as ADRs, whose values are influenced by the currency of the underlying security, effectively assume currency risk. Moreover, from time to time, members of the Institutional Advisors team may be long or short positions discussed in our publications.

1. Preparing for THE Bottom: Part 1 – Gold
Since the bull market in gold started over 15 years ago, we haven’t seen such a long consolidation pattern – ever. Even the big 2008 plunge was followed by a rally almost immediately (from the long-term point of view, that is). The gold volatility index confirms the above having recently moved to new all-time lows
2. Qatar & the Rising Tensions in the Middle East – On Schedule
Stephen Poloz, Governor of the Bank of Canada said they are keeping rates the same for the 15th time in face of uncertainty. Also his views on the economy, challenges from the US including the selloff of their strategic oil reserve and more….
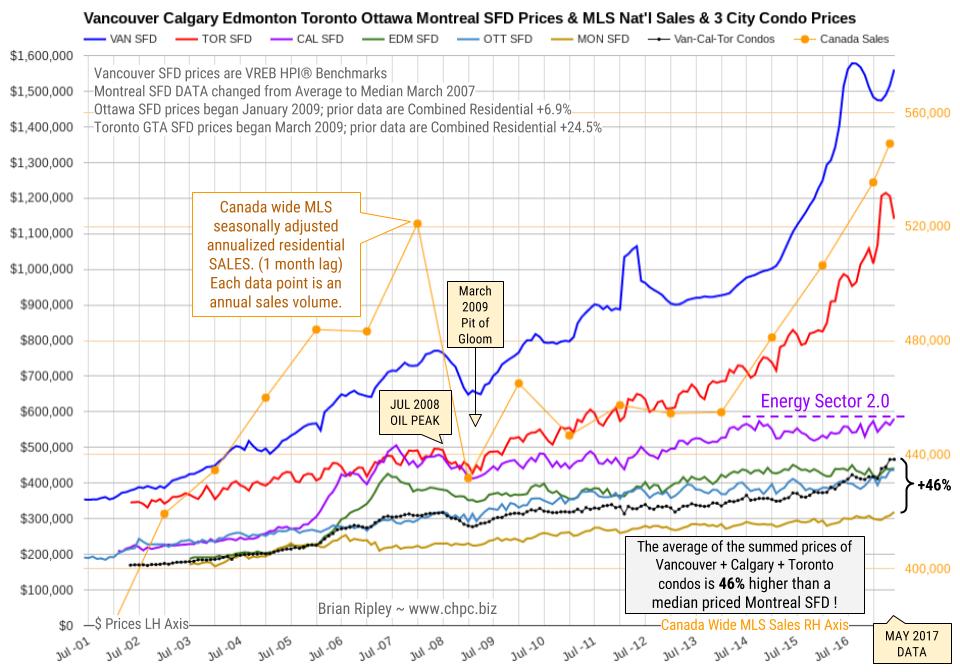
3. Canada 6-City May Housing Prices & the Plunge-O-Meter
The average detached housing prices for Vancouver, Calgary, Edmonton, Toronto, Ottawa and Montréal. And the Plunge-O-Meter which tracks the dollar and percentage losses from the peak and projects when prices might find support.

-
I know Mike is a very solid investor and respect his opinions very much. So if he says pay attention to this or that - I will.
~ Dale G.
-
I've started managing my own investments so view Michael's site as a one-stop shop from which to get information and perspectives.
~ Dave E.
-
Michael offers easy reading, honest, common sense information that anyone can use in a practical manner.
~ der_al.
-
A sane voice in a scrambled investment world.
~ Ed R.
Inside Edge Pro Contributors

Greg Weldon

Josef Schachter

Tyler Bollhorn

Ryan Irvine

Paul Beattie

Martin Straith

Patrick Ceresna

Mark Leibovit

James Thorne

Victor Adair