
Stocks & Equities
Alert originally sent to subscribers on June 8, 2017, 6:56 AM
Our intraday outlook is now bearish, and our short-term outlook is bearish. Our medium-term outlook remains neutral, following S&P 500 index breakout above last year’s all-time high:
Intraday outlook (next 24 hours): bearish
Short-term outlook (next 1-2 weeks): bearish
Medium-term outlook (next 1-3 months): neutral
Long-term outlook (next year): neutral
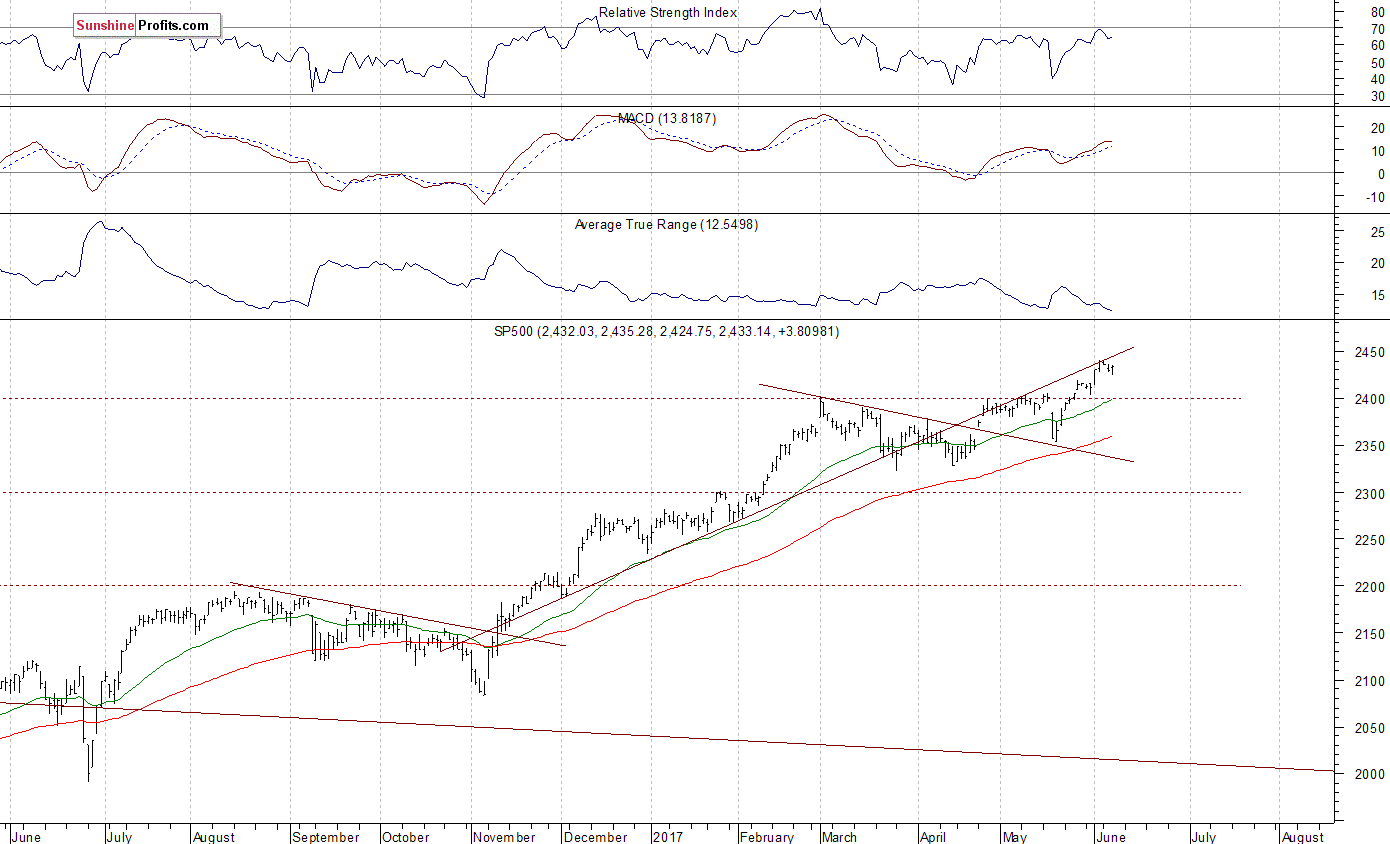
The main U.S. stock market indexes gained 0.2-0.4% on Wednesday, extending their short-term consolidation, as investors continued to hesitate following recent rally. The S&P 500 index trades just 0.3-0.4% below its last Friday’s new all-time high of 2,440.23. It has broken above week-long consolidation along 2,400 mark recently. Stocks have rebounded strongly after their mid-May quick two-session sell-off. They continue their over eight-year-long bull market off 2009 lows. The Dow Jones Industrial Average remained below the level of 21,200 on Wednesday, following last Friday’s advance to new record high of 21,225.04. The technology Nasdaq Composite remains relatively stronger than the broad stock market, as it continues to trade along the record level of 6,310.6. The nearest important resistance level of the S&P 500 index is at around 2,440-2,450, marked by new record high, among others. On the other hand, support level is currently at around 2,415-2,420, marked by previous resistance level. The next support level is at 2,400-2,410, marked by the May 25 daily gap up of 2,405.58-2,408.01, among others. The support level is also at 2,390-2,395, marked by some short-term local lows. Will the uptrend continue towards 2,500 mark? There have been no confirmed negative signals so far. However, we can see some overbought conditions and negative technical divergences. The S&P 500 index is currently trading close to its November-April upward trend line, as we can see on the daily chart (click all charts for larger version)
Positive Expectations Following Yesterday’s Rebound
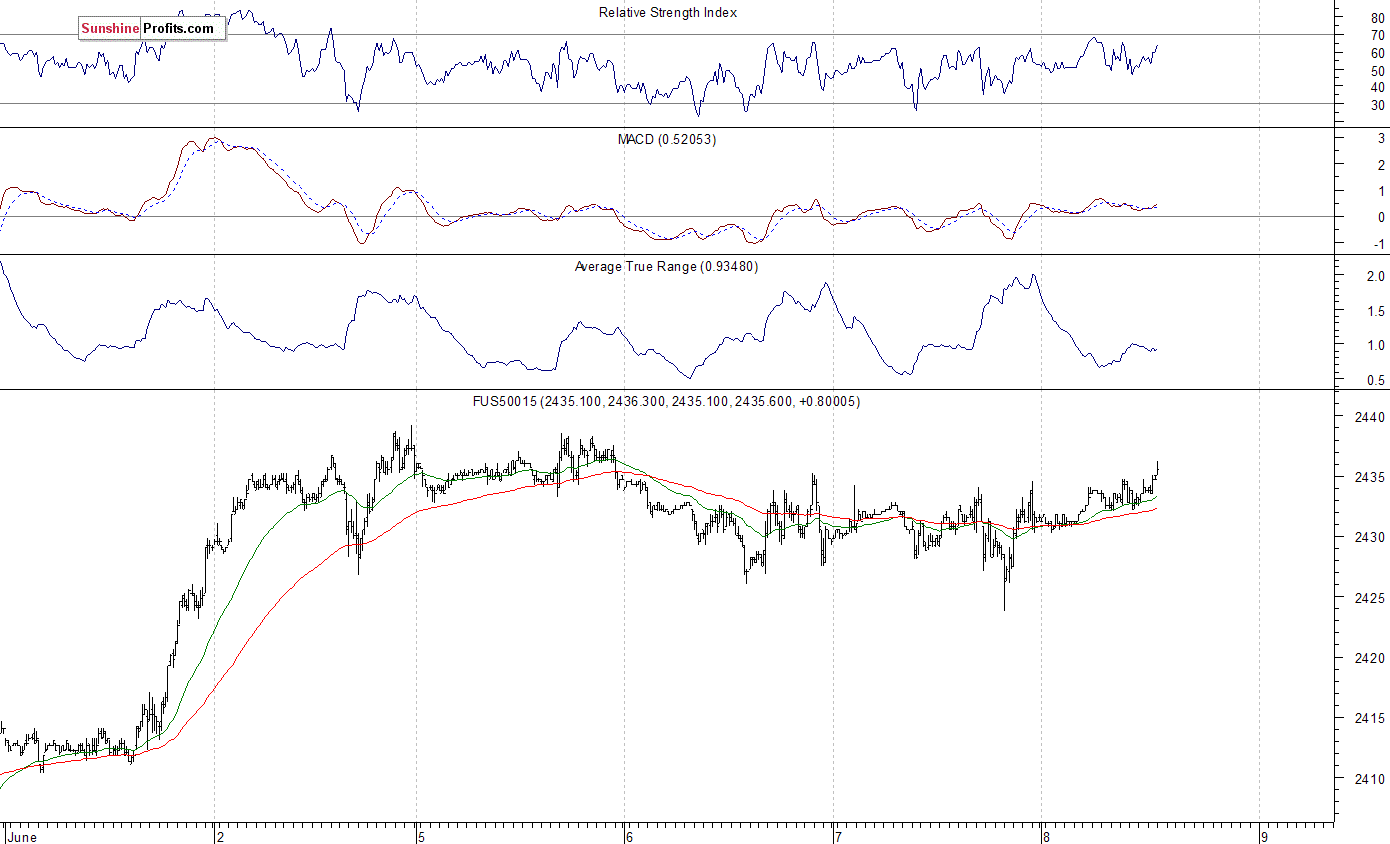
Expectations before the opening of today’s trading session are positive, with index futures currently up 0.2% vs. their Friday’s closing prices. The European stock market indexes have been mixed so far. Investors will now wait for the Initial Claims number release at 8:30 a.m. The market expects that it was at 240,000 last week. The S&P 500 futures contract trades within an intraday consolidation, following an overnight move up. It continues to trade relatively close to Friday’s new record high along the level of 2,440. The nearest important resistance level is at around 2,435-2,440. On the other hand, support level is at 2,425-2,430, marked by recent local lows. The next support level remains at 2,400-2,410. The market trades within a short-term uptrend, as it is above the early March local high. There have been no confirmed negative signals so far. However, we can see some short-term overbought conditions, along with negative technical divergences:
Technology Stocks Remain Relatively Very Strong
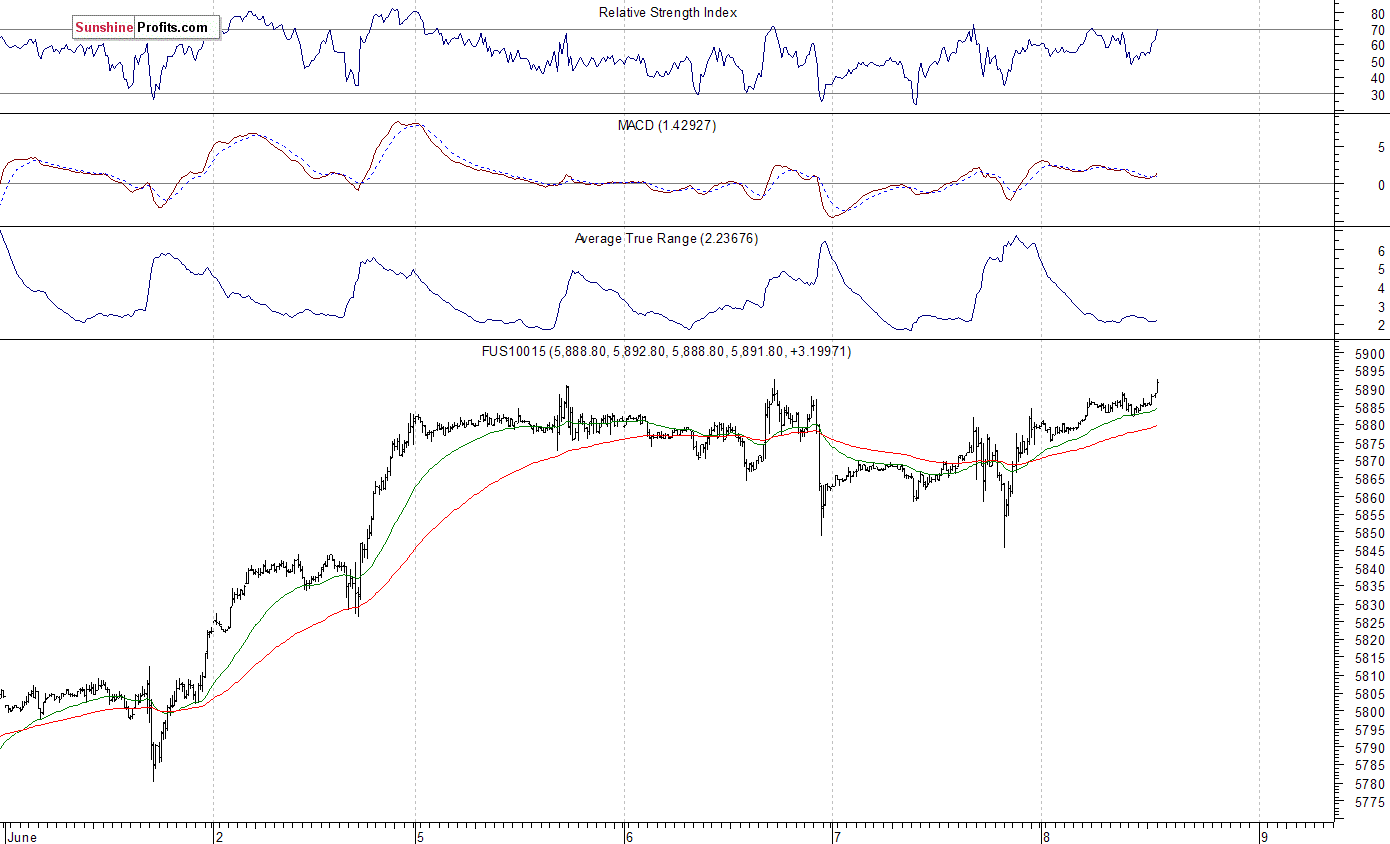
The technology Nasdaq 100 futures contract follows a similar path, as it currently trades within an intraday consolidation along the level of its all-time high. The market extended its six-week-long rally following late April breakout above the level of 5,500. The nearest important level of resistance is at around 5,890-5,900. Potential level of resistance is also at 6,000 mark. On the other hand, the nearest important level of support is at around 5,830-5,850, marked by recent fluctuations. The next support level is at 5,800-5,820, marked by short-term consolidation. There have been no confirmed negative signals so far. But will technology stocks continue their rally despite some short-term overbought conditions? We can see some negative technical divergences:
Concluding, the S&P 500 index continued to trade within a short-term consolidation on Wednesday, as investors remained uncertain following recent rally. The broad stock market extended its gains after a breakout above early March high along the level of 2,400. But will the uptrend continue despite some negative technical divergences along with overbought conditions? Is this some topping pattern before downward reversal or just another flat correction within an uptrend? There have been no confirmed negative signals so far.
If you enjoyed the above analysis, we invite you to check out our other services. We focus on fundamental analysis in our monthly Market Overview reports and we provide daily Gold & Silver Trading Alerts with clear buy and sell signals. If you’re not ready to subscribe yet and are not on our mailing list yet, we urge you to join our gold newsletter today. It’s free and if you don’t like it, you can easily unsubscribe.
Thank you.
Paul Rejczak
Stock Trading Strategist
Stock Trading Alerts

 With the price of gold nearing the $1,300 level in early trading, this is the reason why there was a panic to push the price of gold lower today.
Gold So Close!
By Andrew Adams, at Raymond James
June 7 (King World News) – Finally, gold has been on a bit of a tear lately to rocket back up close to $1300, and if it can just get over $1310 or so, it should have a good chance to once again challenge its highs from last July…
…also from KingWorld:
One Of The Greats Says Gold & Silver Are Poised For Major Bullish Advances

There is something happening in the commodities complex that has been going on for awhile now that needs to be addressed tonight. A subtle change actually started earlier this year and has been gaining momentum especially in the energy sector. I know for a lot of you, with the weak US dollar, you are thinking, “how could commodities be declining,” which goes against everything you have learned about how the markets are supposed to work. If the markets always behaved like everyone thinks they should then there would be no markets, because everyone can’t be right. That’s the nature of the beast we’re trying to tame.
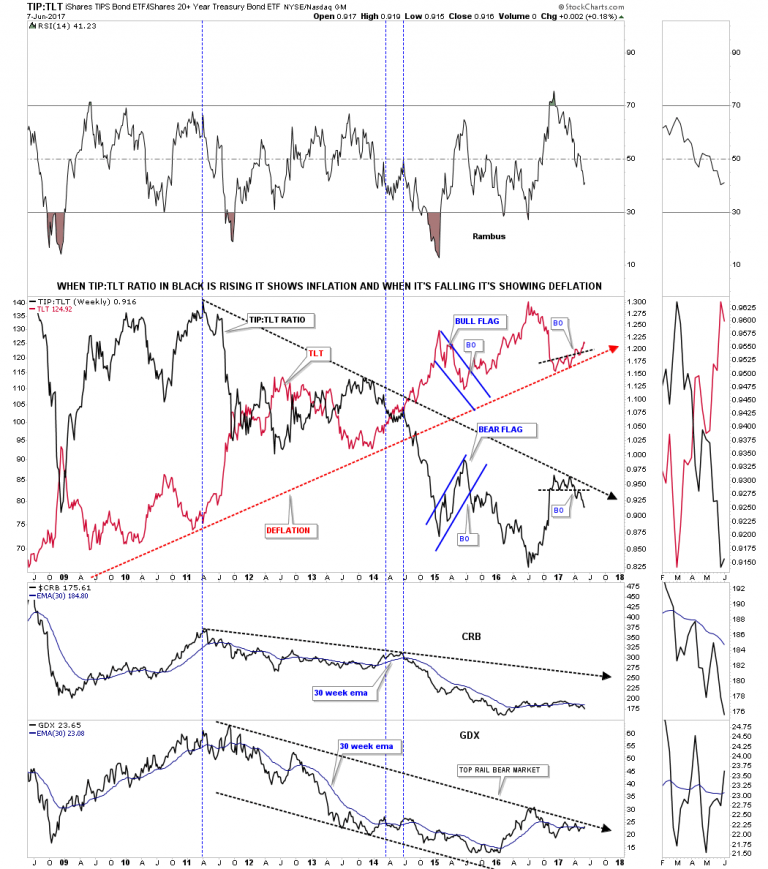
Tonight I would like to show you some bearish rising wedges which have formed all over the place in the commodities complex. Many of the rising wedges took over a year to build out so that sets up a healthy decline. The bigger the pattern the bigger the move.
This first chart tonight is the ratio combo chart using the TIP:TLT to gauge if we are experiencing inflation or deflation. Earlier this year the ratio in black formed a small topping pattern just below the black dashed trendline, then had a quick backtest, and is now starting to gain momentum to the downside. When the ratio in black is falling it shows deflation. The CRB index along with the GDX are still in a downtrend with the CRB index being weaker than the GDX, as show by the 30 week ema.


Qatar is known for its ultra-modern architecture. In this respect, Doha is something to be viewed at least once in life. However, Qatar is a strict religious country that follows sharia law, in which homosexuals and adulterers face a possible death penalty, life imprisonment, or flogging. Qatar is a Salafi version of Sunni Islam, which is an ultra-conservative reform branch that developed in Arabia during the first half of the 18th century. It advocated a return to the traditions of the “devout ancestors” in reaction to the spread of European ideas. Qatar is one of the two Salafi states in the Muslim world, the other being Saudi Arabia.
That said, Qatar is said to be the nost duplicitous country in the world. On the one hand they embrace the West, yet on the other hand many have called it “Club Med” for terrorists. Qatar is the richest nation on Earth on a Per capita basis. Abu Nakhlah Airport (Arabic:مطار أبو نخلة) in Qatar houses both the Qatari Air Force and U.S. Air Force as well as other Coalition personnel. It is also the headquarters of United States Central Command.
….also from Martin:


With the U.S. dollar taking another hit last Friday on a weaker-than-expected jobs report, gold closed up 1.12 percent for the day today. A Bloomberg gauge of 72 junior miners, however, has lost 15 percent since the end of January, and the rebalance of the VanEck Vectors Junior Gold Miner ETF (GDXJ), which I previously wrote about, is also having a depressing effect on many gold names.
This was a major concern among investors at the International Metal Writers Conference in Vancouver, which I presented at last week. Despite gold gaining 9 percent so far this year, junior gold miners have not followed through with those gains as the GDXJ is set to cut in half its exposure to the junior mining space on June 16.
We’ve Only Just Begun
Other investors aren’t so pessimistic. Every year for the past 11 years, Liechtenstein-based investment firm Incrementum has issued its closely-read “In Gold We Trust” report. The 2017 edition, released last Thursday, raises a number of interesting observations that add some shine to gold’s investment case.
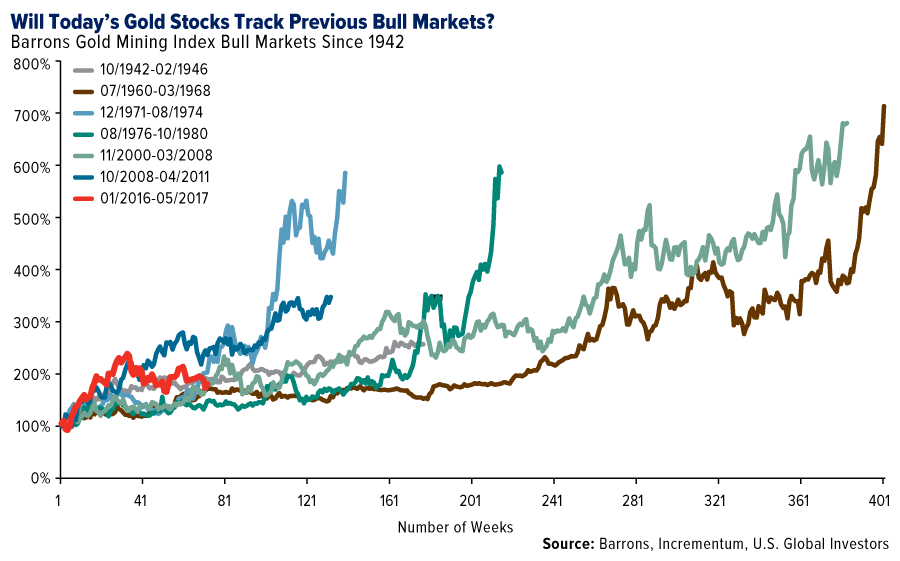
For one, its analysts firmly believe that gold’s price turnaround last year “marked the end of the cyclical bear market,” adding that “the rally in the precious metals sector has probably only just begun.” To illustrate this, the group tracked the performance of every gold stock bull market going back to 1942, using the Barrons Gold Mining Index. The bull market that began last year, highlighted in red below, does indeed look as if it has much more room to run.
Among the reasons why “prudent investors” should consider accumulating gold and gold stocks now, according to Incrementum, are excessive global debt, the “gradual reduction of the U.S. dollar’s importance as a global reserve currency” and what the group sees as a high probability that the U.S. is close to entering a recession.
Interestingly, the investment firm shows that nearly every U.S. recession, going back 100 years, was preceded by an increase in interest rates.
“The historical evidence is overwhelming,” Incrementum writes. “In the past 100 years, 16 out of 19 rate hike cycles were followed by recessions. Only three cases turned out to be exceptions to the rule”—one in the 1960s, one in the early 80s, the last in the mid-90s.
The U.S., of course, is currently at the start of a new cycle, though the ho-hum jobs report for May—138,000 jobs added, versus expectations for 185,000—casts doubt on a rate hike this month. Nevertheless, Incrementum’s research makes a compelling case that a recession could be imminent, making gold even more attractive as a store of value.
As for gold stocks, Incrementum favors “conservatively managed companies which are not merely pursuing an agenda of growth at any price, but are instead prioritizing shareholder interest.”
This is an apt description of the kinds of gold companies we prefer—frugal, small- to mid-cap names such as Klondex, Wesdome Gold Mines, Kirkland Lake and many others.
Some links above may be directed to third-party websites. U.S. Global Investors does not endorse all information supplied by these websites and is not responsible for their content. All opinions expressed and data provided are subject to change without notice. Some of these opinions may not be appropriate to every invest.
Holdings may change daily. Holdings are reported as of the most recent quarter-end. The following securities mentioned in the article were held by one or more accounts managed by U.S. Global Investors as of 03/31/2017: Klondex Mines Ltd., Kirkland Lake Gold Ltd., Wesdome Gold Mines Ltd., VanEck Vectors Junior Gold Miners ETF (GDXJ).
The Barrons Gold Mining Index is the longest-running gold index, going back seven decades.


-
I know Mike is a very solid investor and respect his opinions very much. So if he says pay attention to this or that - I will.
~ Dale G.
-
I've started managing my own investments so view Michael's site as a one-stop shop from which to get information and perspectives.
~ Dave E.
-
Michael offers easy reading, honest, common sense information that anyone can use in a practical manner.
~ der_al.
-
A sane voice in a scrambled investment world.
~ Ed R.
Inside Edge Pro Contributors

Greg Weldon

Josef Schachter

Tyler Bollhorn

Ryan Irvine

Paul Beattie

Martin Straith

Patrick Ceresna

Mark Leibovit

James Thorne

Victor Adair