
Real Estate

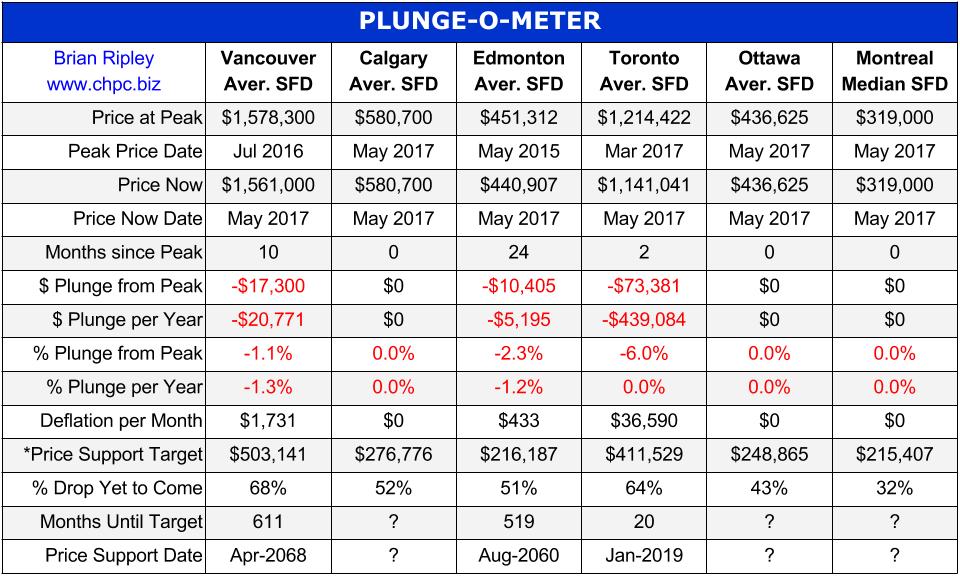
The Canadian Real Estate PLUNGE-O-METER

On the 4h chart of USD Index price recently rallied in three waves; it was a clear contra-trend price structure within wave 4. We labeled end of wave 4 near 97.77 level after that sharp leg down which is now pointing to around 96.50/96.20 for wave 5 where bigger decline may come to an end in June. That being said, a five wave rally and a breach above the 97.77 level may signal bullish activity to follow.
USD Index, 4H

Ed Note: The US Dollar index hit a low of 96.44 this Tuesday at 11am, and is currently trading up from there as you can see it taking in initial surge to the upside at 3am Wednesday morning. You can see it testing that surge on the 15 minute chart below:


At the old Vancouver price peak in April 2012 before Torontonians joined the party, Vancouver metro SFDs were 64% more expensive than Toronto comparables. In July 2016 at the peak of Vancouver SFD prices, they were 65% more expensive. The gap is closing quickly; it’s narrowed down to 33%, and now strata prices are similar within 9% of each other.
In March 2017 the Monthly Absorption Rate based on total inventory and total residential sales hit 154% in Toronto vs Vancouver at 47%. Vancouver may have led the FOMO crowd up the ladder, but Toronto maybe sending them down the snake.
…click HERE to view attempt to visualize the distortions of the market
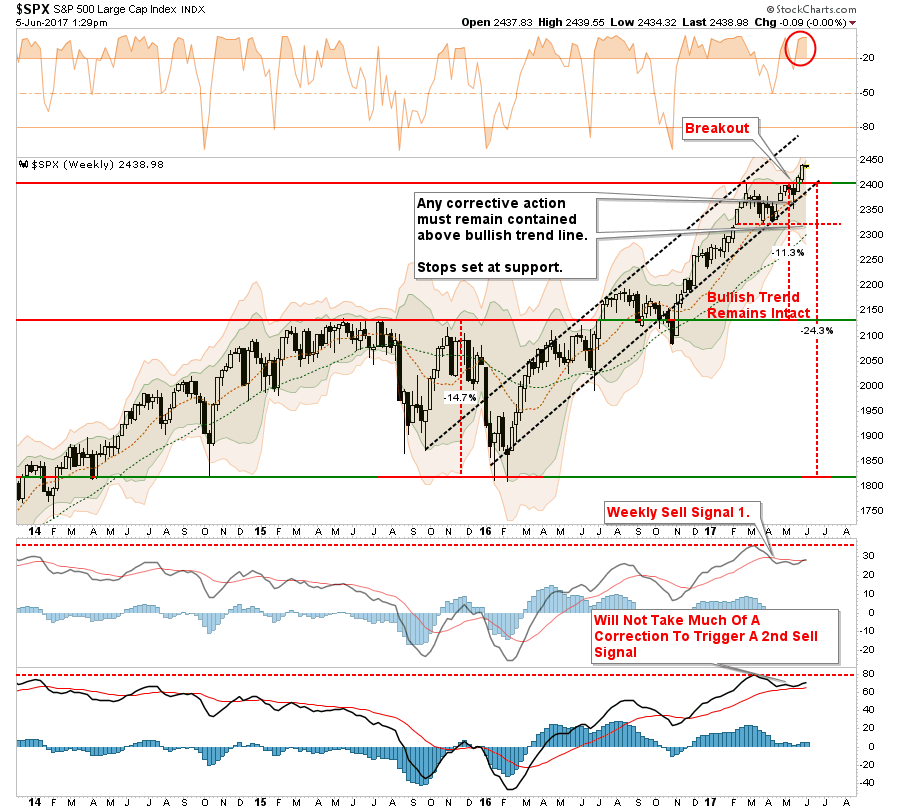
As I discussed in this past weekend’s missive, the breakout of the market to new highs keeps our allocation model nearly fully allocated. However, while we are long, we are still holding onto a little larger than normal cash pile, and raised stop levels, to hedge some volatility risk during the summer months. (Stops have now moved up to the bottom of the bullish trendline as shown in the chart below which coincides with the 100-day moving average which has been a running support line.)
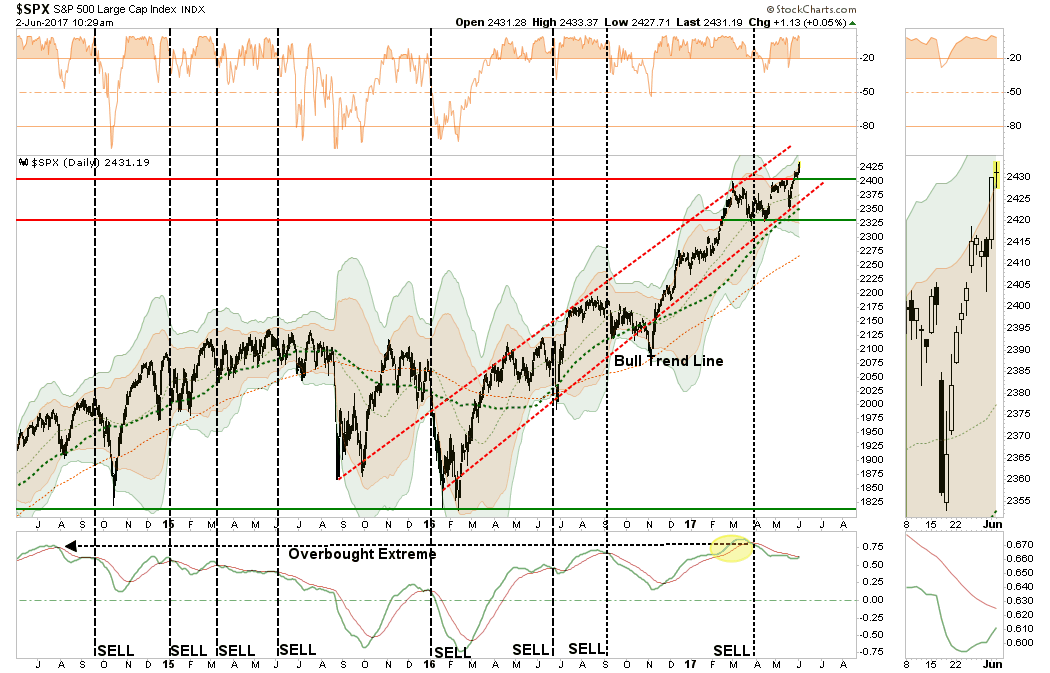
One thing that keeps us a bit more cautious currently is the intermediate term “sell signal” which remains in place from very high levels. That, as shown below, and with a push into 3-standard deviations above the moving average, has not historically had the best outcomes. So, we’re cautious.
This is a very confusing market and the arguments between the “bulls” and the “bears” runs deep. It is these emotional biases of being either “bullish” or “bearish,” primarily driven by the media, which keeps you from truly focusing on long-term outcomes. You either worry about the next downturn, or are concerned you are missing the rally. Therefore, you wind up making short-term decisions which negate your long-term views.
Understanding this is the case, let’s take a look at the technical case for the markets from both a bullish and bearish perspective. From there you can decide what you do next.
THE BULL CASE
1) Central Banks Won’t Let The Markets Crash
This is the primary support of the bullish case, and frankly, one that is difficult to argue with. Despite all of the hand-wringing over valuations, economics or fundamental underpinnings, stocks have been, and continue to be, elevated due either to “direct” or “verbal” accommodation.
I discussed this idea in “The Illusion Of Permanent Liquidity:”
“But what ongoing liquidity interventions have accomplished, besides driving asset prices higher, is instilling a belief there is little risk in the markets as low interest rates will continue or only be gradually tightened.”
As I showed just recently, while the Fed may not be “actively” engaged in further liquidity injections via “Quantitative Easing,” there is certainly a fairly suspicious pattern as to the timing of the “reinvestment” of the balance sheet.

But it isn’t just the “Fed” that has pushed asset prices higher, but every major Central Bank globally with almost all of them pushing record levels of assets.

“Bad news is good news” has been the “siren’s song” for the bulls since “low rates for longer” and continued interventions and verbal accommodation keeps the “global chase for yield” intact.
2) Stocks Made A Successful Retest Support & Broke Out
After a good bit of “sideways churning” beginning in March, the market was finally able to muster enough strength to break of the 3-month long trading range and move to new highs. While much of the move came from very light volume, the breakout occurred which is bullish and does suggest higher asset prices in the near term.
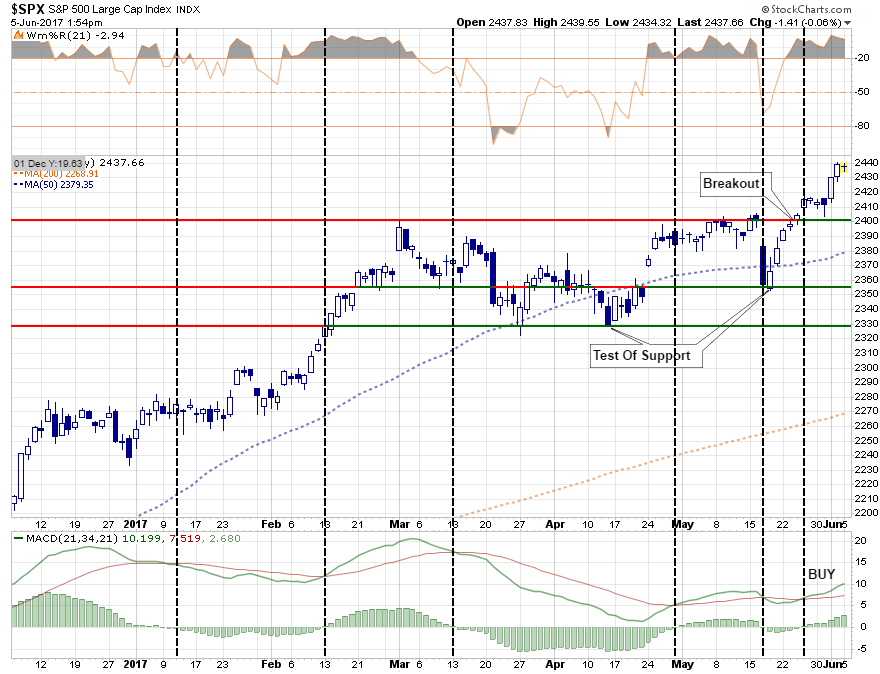
The dashed black lines show the short-term “buy” and “sell” signals with the latest “buy” signal being triggered with the price “breakout” at the end of May.
The market was successfully able to defend crucial support following a “sharp sell-off” on a one-day concern the current Administration “may” have obstructed an investigation. Such was quickly dismissed as #FakeNews by the markets and the markets rapidly regained footing in ongoing anticipation of “tax cuts/reforms.”
Importantly, the “sell signal,” which is shown in the lower part chart above, was also just as quickly reversed removing downward pressure on the market in the short-term. While the markets remain extremely overbought in the short-term, and some corrective action is likely, any such correction that does not violate the recent “breakout” and/or critical support levels, will keep the current bull market advance intact.
3) Advance-Decline Line Is Improving
The participation by stocks in the recent bullish advance has been strong enough to push the advance-decline line back onto a short-term “buy signal” as well.
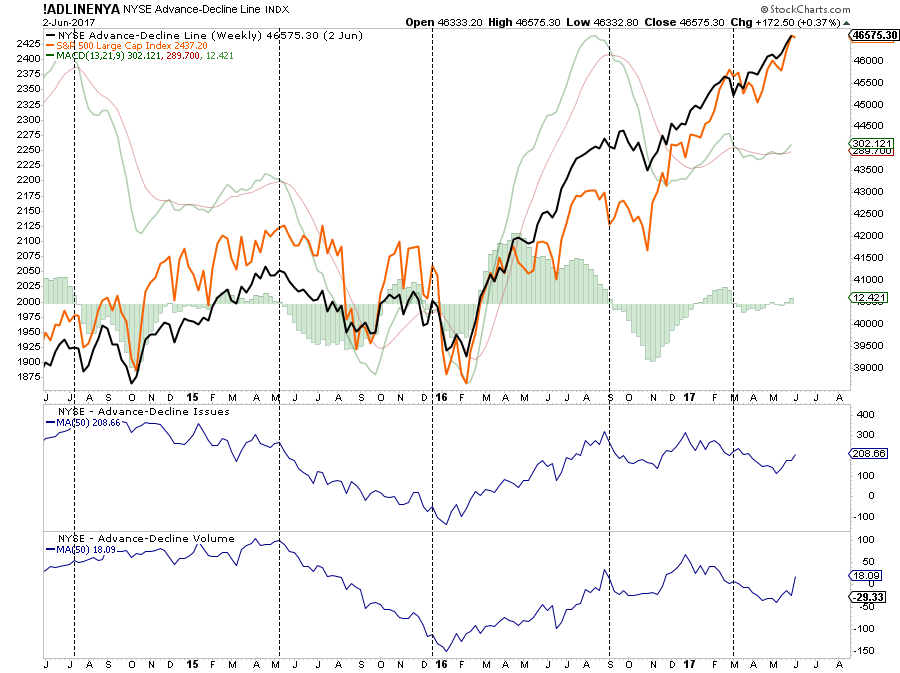
After languishing since the beginning of the year, both the number and volume of stocks on the NYSE are now participating in the advance. The rise in participation supports the bullish momentum behind stocks currently and should not be dismissed.
Currently, as shown above, the short-term dynamics of the market remain bullishly biased. This suggests equity exposure in portfolios remains warranted for the time being. However, let me be VERY CLEAR – this is VERY SHORT-TERM analysis. From a TRADING perspective, this remains a bull market at the current time. This DOES NOT mean the markets are about to begin the next great secular bull market. Caution is highly advised if you have an inherent disposition to “hoping things will get back to even” if things go wrong, rather than selling.
THE BEAR CASE
The bear case is more grounded in longer-term price dynamics – weekly and monthly versus daily which suggests the current rally remains a reflexive rally within the confines of a more bearish backdrop.
1) Bonds Ain’t Buyin’ It
As I noted this past weekend:
“The biggest problem I have currently is simply that bonds are NOT buying the rally. As I discussed last week, and as we saw on Friday, bonds continue their ‘bullish bias’ and broke through key support levels suggesting lower rates to come.”

With interest rates still overbought, and on an important “sell signal,” the downside break from the recent consolidation process suggests lower rates/higher bond prices in the near term.
On a longer-term basis, this suggests that either bonds (risk-off) or stocks (risk-on) is wrong. My suspicion is that ultimately stocks will take the hit as the “credit market,” which analyzes actual balance sheet risk, tends to be right more often than not.
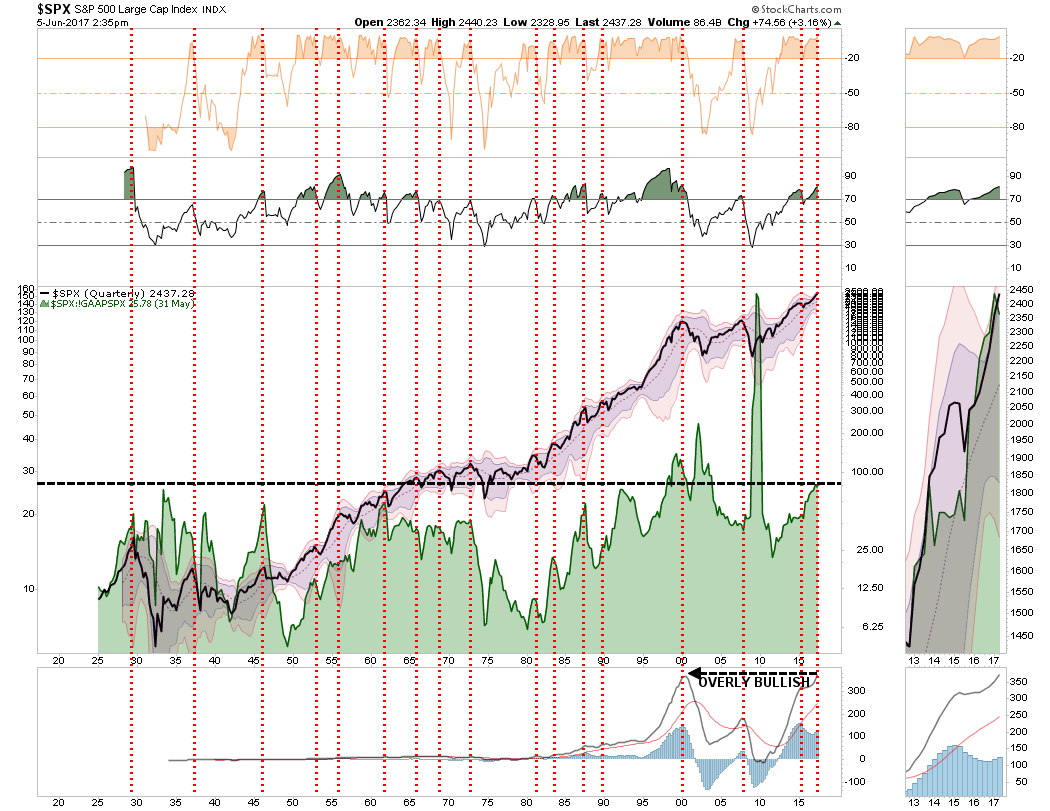
2) Longer-Term Dynamics Still Bearish
If we step back and look at the market from a longer-term perspective, where true price trends are revealed, we see a very different picture emerge. As shown below, the current dynamics of the market are extremely similar to every previous bull market peak in history. Given the deterioration in revenues, valuations, corporate profits, and weak economics, the backdrop between today and the end of previous bull markets remains consistent.
3) M&A Ain’t “M’n or A’n”
A recent post via Business Insider brought to light an interesting view to a longer-term driver of market support.
“M&A lawyers argue the ‘uncertainty’ factor, which has come about recently, given some unpredictable aspects of the new Trump administration, has been the issue. It only may explain the last six months, but the trend has been poor for about two years or more. In the past, there has been some correlation with the S&P 500 and thus it could generate more legitimate fears than some of the other excuses that are put forth for not wanting to buy American equities.”
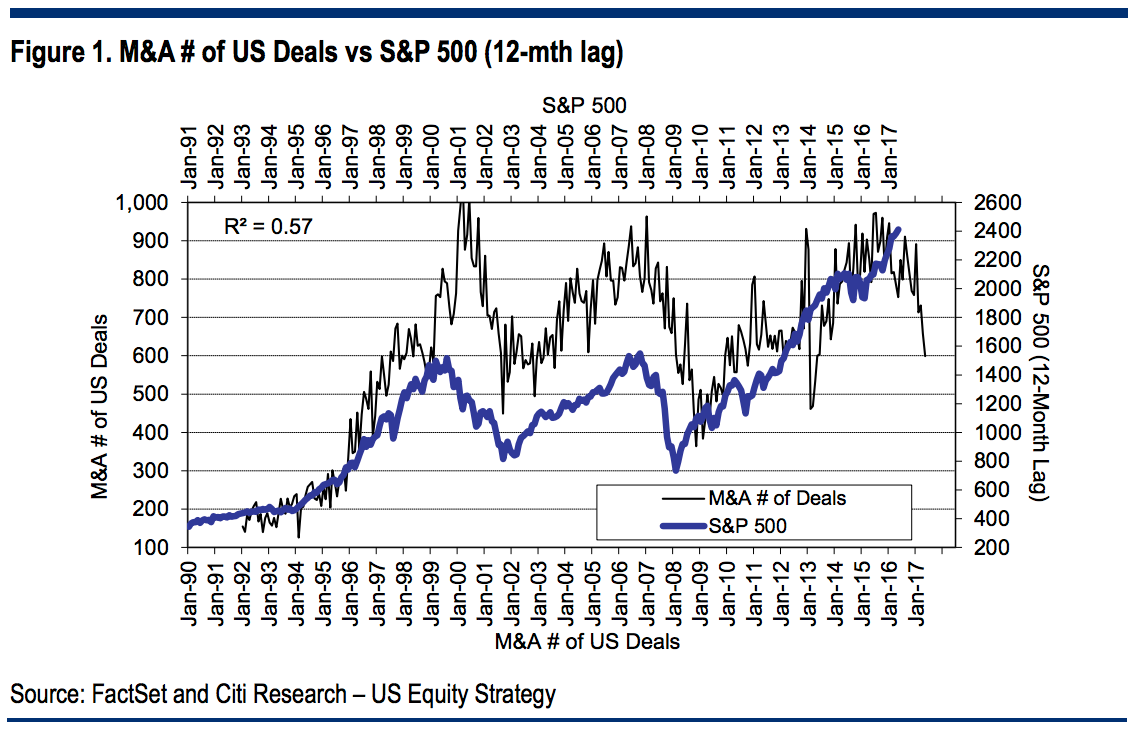
This year through June 5, 7,561 deals were announced, the lowest count since 2013, according to S&P Global Market Intelligence. While M&A volume reached a record $2.055 trillion 2013, the volume has slipped in 2016 to just $1.7 trillion.
Given the length and maturity of the current economic expansion, tighter monetary policy in the U.S. and a lack of legislative agenda moving forward in Washington, there is further risk of M&A support being pulled from the markets.
What you decide to do with this information is entirely up to you. As I stated, I do think there is enough of a bullish case remaining to warrant some equity risk on a very short-term basis.
However, the longer-term dynamics are clearly bearish. When those negative price dynamics are combined with the fundamental and economic backdrop, the “risk” of having excessive exposure to the markets greatly outweighs the potential “reward. “
Could the markets rocket up to 2500, or more, as some analysts currently expect? It is quite possible given the ongoing interventions by global Central Banks, bullish optimism and the rising belief “this time is different.”
The reality, of course, is that while the markets could reward you with 100 points of upside, there is a risk of 600 points of downside just to retest the lows of 2016.
Those are odds that Las Vegas would just love to give you.
“Technically Speaking” is a regular Tuesday commentary updating current market trends and highlighting shorter-term investment strategies, risks, and potential opportunities. Please send any comments or questions directly to me via //lance@realinvestmentadvice.com/” target=”_blank” rel=”noopener noreferrer”>Email, Facebook or Twitter.
….more from Lance Roberts:


Jun 6, 2017
- Gold is the world’s ultimate asset, and another spectacular week is underway for investors. While May was mostly sideways (and lower for many gold stocks), it’s starting to look like the month of June could be a serious “barnburner”.
- Please click here now. Double-click to enlarge this daily bars gold chart.
- Gold tends to stage a decent rally in the days following the release of the US jobs report.
- That’s in play now, as I suggested it would be, but the rally is also on “Indian demand steroids”. Please click here now. It’s unknown how big black market demand is, but the official demand alone came in at over 100 tons for May!
- This weekend’s government announcement of a 3% GST rate on gold sales has sent Indian jewellery stocks skyrocketing. The new GST effectively cuts the total tax rate in the state of Kerala, which I have dubbed “world gold demand headquarters”.
- In my professional opinion, the bear cycle in Indian demand is over. Once the Diwali festival buying season arrives, I’m predicting that imports could reach a new single month record high of 200 tons.
- Please click here now. Double-click to enlarge this big picture gold chart.
- With the bear cycle in Indian demand over, gold is likely to begin its rise out of the huge $1923 – $1045 consolidation pattern. Gold is essentially poised to play “catch-up” with the skyrocketing price of anti-fiat currency bitcoin, and begin a steady rise to my targeted $2800 price level.
- Some analysts have noted problems in India’s banking system. The problems are real, but surmountable. The demonetization program has arguably been a de facto recapitalization of Indian banks.
- Also, a lot of Indian business is financed outside of the traditional banking system. Many businesses use private loan companies, and pay their debts with gold. These loan companies have vast reserves of gold and provide solid amounts of venture capital to eager young entrepreneurs.
- Please click here now. Barron’s has astutely noted the huge boost to GDP that the arrival of Indian women in the work force can produce.
- I’ve predicted that Indian GDP will reach 10% in the next few years, and I stand by that prediction. As Indians build more fiat wealth, they buy gold with it. Indian gold demand growth is inelastic. It grows as Indian wealth grows.
- Please click here now. Double-click to enlarge. Bitcoin just blasted to another all-time high this morning. Respected ex-Merrill Lynch analyst Henry Blodget has a $1 million price target. A Saxo bank analyst has suggested that a price of $100,000 is realistic. My own long term target essentially sits between these two targets at $500,000.
- These target prices may seem ridiculous to the average investor, but if blue chip NYSE stocks had the type of limited float that bitcoin has, many of them would be trading at millions of dollars per share right now. The same is true for gold; if there was no more mine supply and rising demand, the price would theoretically go to infinity. Investors new to the blockchain space can get more information at my www.gublockchain.com website.
- Simply put, it’s the greatest time in history to be invested in anti-fiat currencies like gold bullion and bitcoin, but what about gold mining stocks?
- Please click here now. Double-click to enlarge. That’s a snapshot of the price action of some well-known gold and silver stocks over the past six months.
- Clearly, it’s been a painful time, especially given the fact that bullion has done reasonably well while the stocks swooned.
- Is there any light at the end of the tunnel for gold stock investors that isn’t a freight train? Well, the answer is yes. Please click here now. Double-click to enlarge. Gold can do well in both inflationary and deflationary crisis, but gold stocks need inflation to consistently outperform bullion.
- I predicted that gold stocks would bottom against gold when Janet Yellen ended the deflationary QE program and replaced it with rate hikes.
- So far I’ve been proven correct, but more rate hikes are required to create a powerful bull cycle in money velocity. Accelerating money velocity creates accelerating inflation.
- Also, as more rate hikes occur, institutional investors will become concerned about their US stock market investments. They won’t necessarily sell their existing holdings, but the US stock market is likely to stagnate as they focus new money on European markets, Asian markets, and gold stocks.
- Please click here now. Double-click to enlarge. The price action of GDX is reasonably stable within a large consolidation area.
- Gold stocks have a strong tendency to rally after a rate hike, and the next one is probably only about nine days away. My approach is to be an aggressive GDX buyer on every ten cents per share price decline.
- Those purchases are made in anticipation of another rate hike. With a new Indian gold jewellery demand bull cycle now underway, that rate hike should produce a vigorous rally in GDX and most individual gold stocks.
Thanks!
Cheers
st
Jun 6, 2017
Stewart Thomson
Graceland Updates
website: www.gracelandupdates.com
email for questions: stewart@gracelandupdates.com
email to request the free reports: freereports@gracelandupdates.com
Graceland Updates Subscription Service: Note we are privacy oriented. We accept cheques. And credit cards thru PayPal only on our website. For your protection we don’t see your credit card information. Only PayPal does.
| Subscribe via major credit cards at Graceland Updates – or make checks payable to: “Stewart Thomson” Mail to: Stewart Thomson / 1276 Lakeview Drive / Oakville, Ontario L6H 2M8 / Canada |
Stewart Thomson is a retired Merrill Lynch broker. Stewart writes the Graceland Updates daily between 4am-7am. They are sent out around 8am. The newsletter is attractively priced and the format is a unique numbered point form; giving clarity to each point and saving valuable reading time.
Risks, Disclaimers, Legal
Stewart Thomson is no longer an investment advisor. The information provided by Stewart and Graceland Updates is for general information purposes only. Before taking any action on any investment, it is imperative that you consult with multiple properly licensed, experienced and qualifed investment advisors and get numerous opinions before taking any action. Your minimum risk on any investment in the world is 100% loss of all your money. You may be taking or preparing to take leveraged positions in investments and not know it, exposing yourself to unlimited risks. This is highly concerning if you are an investor in any derivatives products. There is an approx $700 trillion OTC Derivatives Iceberg with a tiny portion written off officially. The bottom line:


-
I know Mike is a very solid investor and respect his opinions very much. So if he says pay attention to this or that - I will.
~ Dale G.
-
I've started managing my own investments so view Michael's site as a one-stop shop from which to get information and perspectives.
~ Dave E.
-
Michael offers easy reading, honest, common sense information that anyone can use in a practical manner.
~ der_al.
-
A sane voice in a scrambled investment world.
~ Ed R.
Inside Edge Pro Contributors

Greg Weldon

Josef Schachter

Tyler Bollhorn

Ryan Irvine

Paul Beattie

Martin Straith

Patrick Ceresna

Mark Leibovit

James Thorne

Victor Adair