Energy & Commodities

Is the Energy Rally Running out of Gas ?

Tonight I would like to update some charts for Natural Gas and oil which appear to be building out a topping formation. If these patterns play out there is a lot of room to the downside we can take advantage of. There has been a lot of backing and filling, but it looks like this may be coming to an end and we may finally get the impulse move down.

$NATGAS has been building out a 1 year H&S topping pattern and just recently completed the high for the right shoulder. This daily chart shows a blue 5 point bearish rising flag that broke below the bottom rail today. A backtest to the underside of the 5 point bearish rising flag would come in around the 3.18 area which would represent a low risk entry point to go short natural gas. The possible neckline is still quite a bit lower which would be another low risk entry point if the neckline gives way.

natgas-day-1

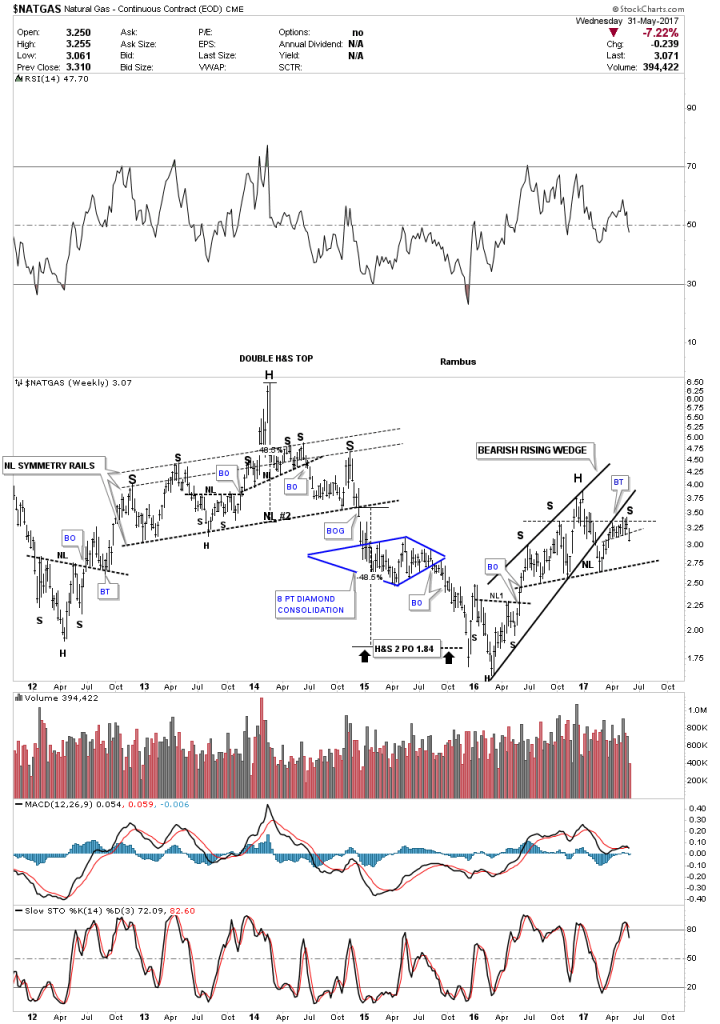
This next chart is a weekly look which shows a classic H&S top forming with the left shoulder and head building out inside the rising wedge, and the right shoulder forming on the backtest to the bottom rail of the rising wedge. Note how long the backtesting process took before it was finally completed. Most folks would have given up and moved on to something else, but sometimes having some patience can be rewarding. Patience would also have been required when the very symmetrical 2 year triple H&S top broke down and began consolidating the first leg down, building out the blue diamond. Each reversal $NATGAS has had since 2012 was accompanied by a H&S reversal pattern. As you can see, if our current H&S top plays out this move down is just getting started.

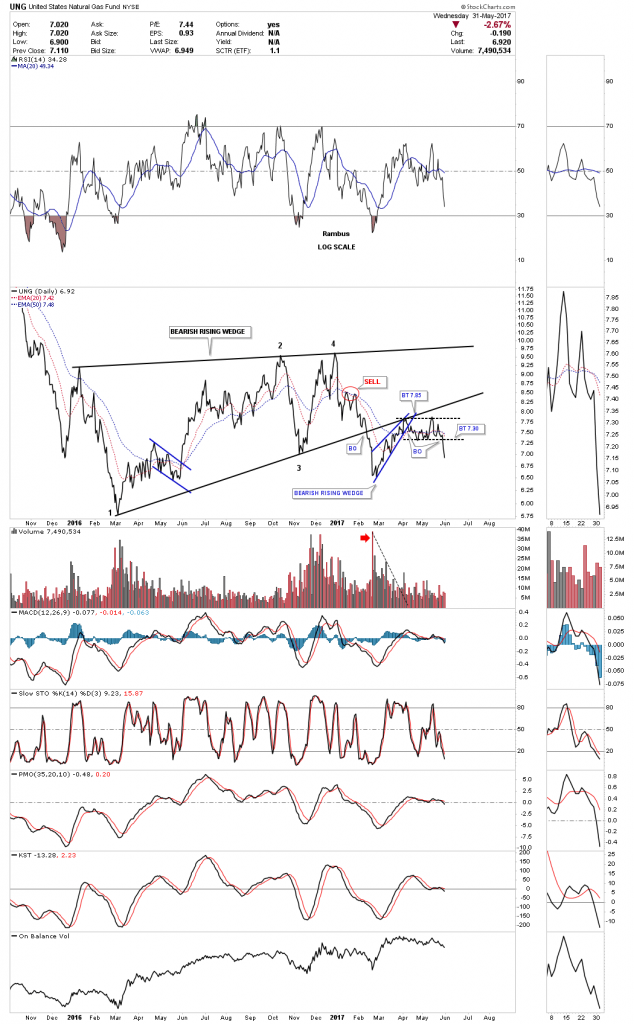
Lets now look at UNG, natural gas fund, that is the best proxy for either going short or long one of the etf’s for natural gas. This 1 1/2 year daily line chart shows the bearish rising wedge with the smaller blue bearish rising wedge which formed the backtest to the bottom rail. Even after the backtest was completed at 7.85 UNG still didn’t want to go down and traded sideways, creating a double top just below the bottom rail of the black rising wedge. Finally this week the price action is starting to fall breaking below the double top trendline at 7.30. The price objective at a minimum would be down to the first reversal point in the one year bearish rising wedge at the 5.75 area.


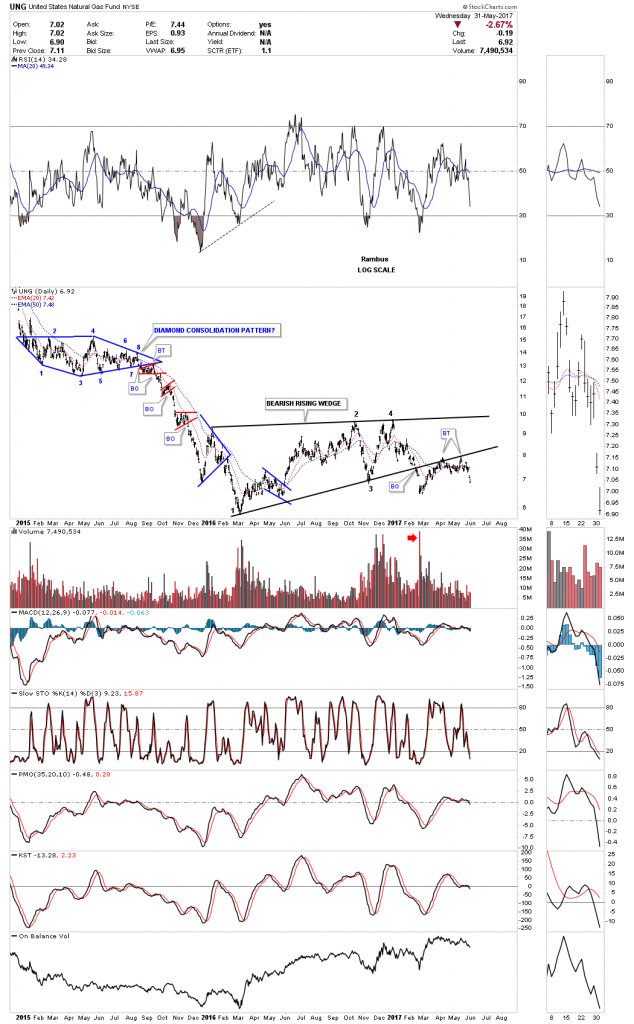
This longer term daily chart picks up the price action once the 8 point diamond consolidation pattern broke down. The smaller red consolidation patterns are what you want to see in a strong impulse move down, one forming just below the previous one. The move was so strong you can see a parabolic decline out of the blue diamond.

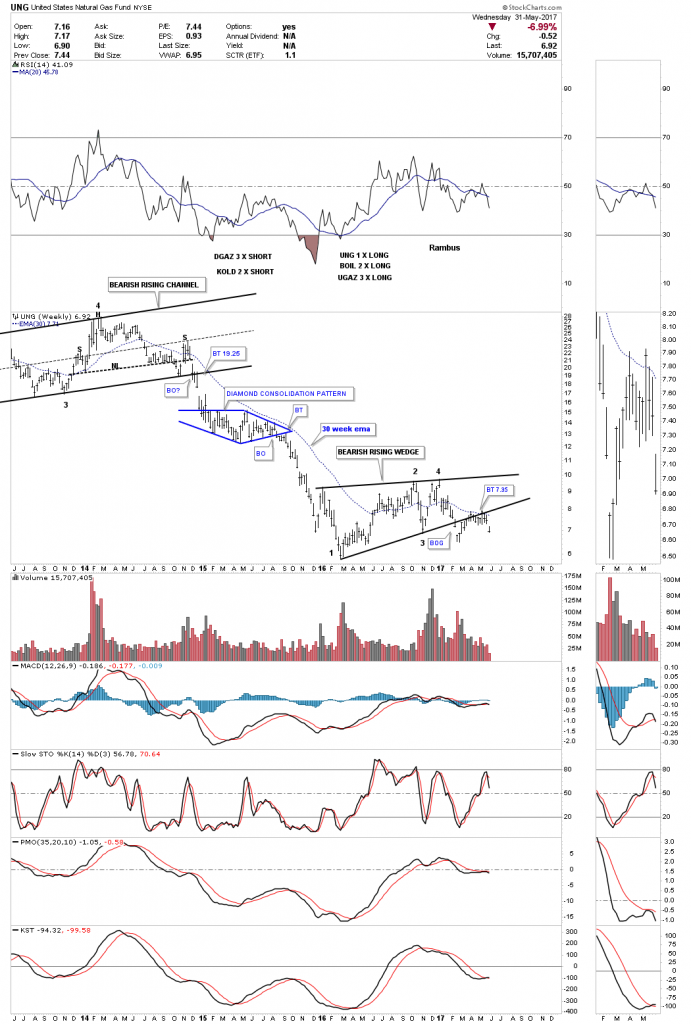
This weekly chart puts the big picture in perspective which shows the end of a very big rising channel with a H&S top that finally finished off the reversal pattern. The blue diamond is basically a halfway pattern that formed in the middle of that massive decline. At the top of the chart I listed 2 short efts, DGAZ which is a 3 X short etf and KOLD is a 2 X short etf for natural gas.

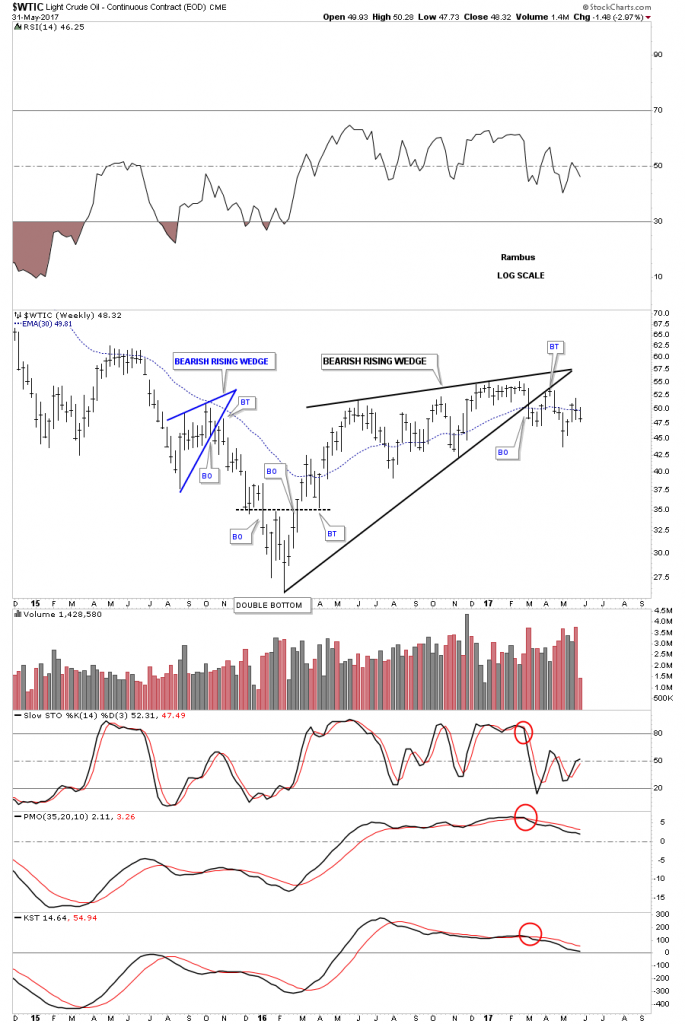
Now lets turn our attention to the $WTIC, oil index, which had a massive decline into the early 2016 low. Initially it looked like oil was going to build out an inverse H&S bottom, but as time went on the price action failed to move much higher than the neckline and began trading sideways. After nearly a year of sideways chopping action it looks like oil has built out a bearish rising wedge. There are several ways we can draw in the rising wedge, with the first one starting at the 2016 low. It’s not the prettiest rising wedge I’ve ever seen, but it does fit the bill as the backtest found resistance right where one would be looking, the underside of the bottom rail. There was a smaller bearish rising wedge which formed in 2015 which had a breakout followed by a backtest.

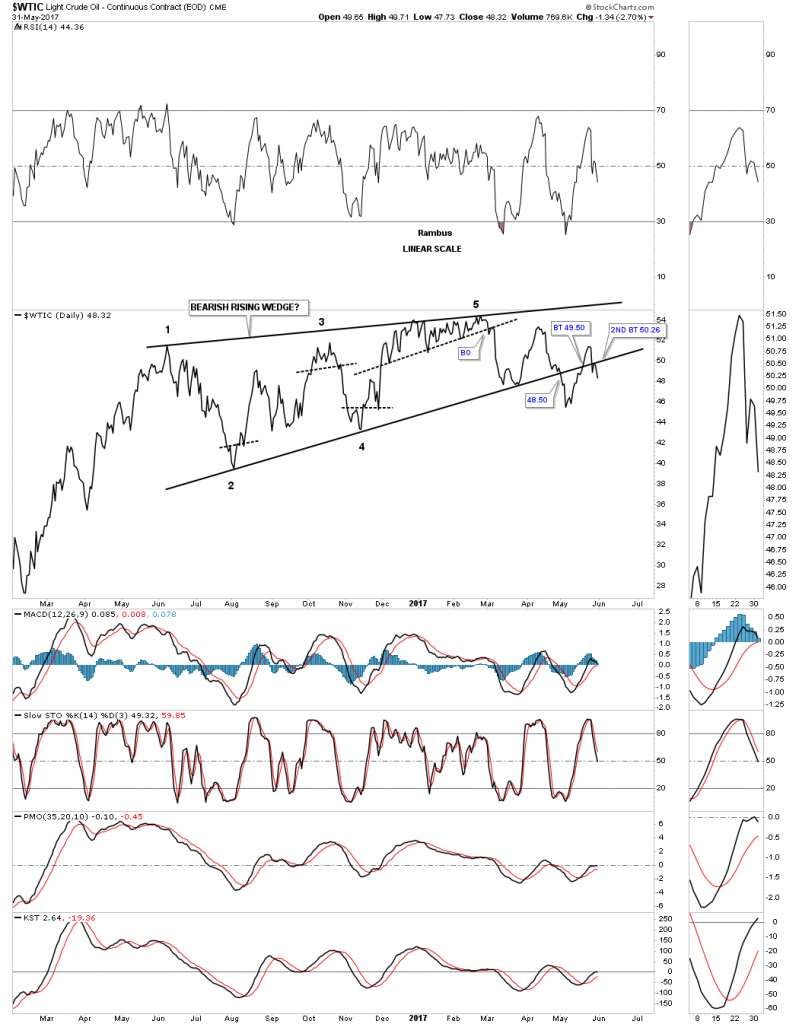
The 2nd way we can draw in a rising wedge is by starting the first reversal point, not at the bottom, but at the first reaction high. This rising wedge gives us 5 reversal points which we would need as the rising wedge is forming above the previous low. Note how the price action has interacted with the bottom rail of the one year black rising wedge. The initial backtest I was looking for was a little strong at 49.50. After petering out just above the bottom rail oil declined once again and broke below the bottom rail with another bactest to 50.26 which so far is holding.


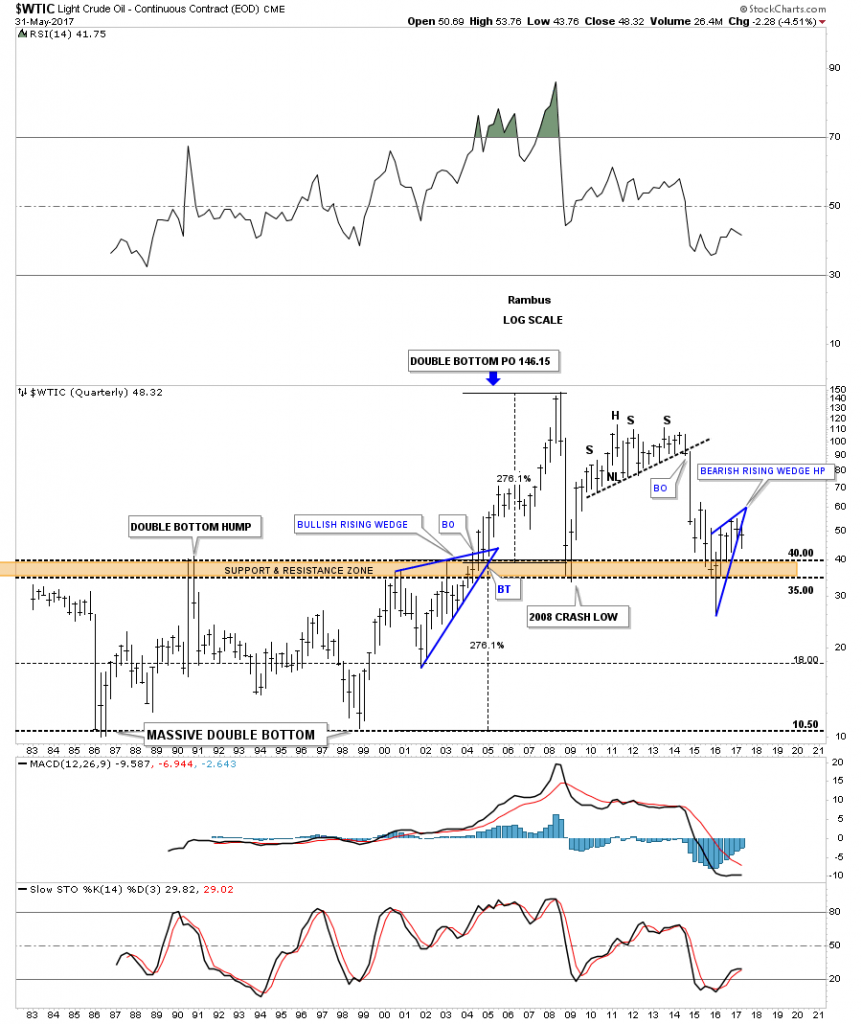
This next chart for oil is a 35 year quarterly chart which shows the entire history going all the way back to 1983. For 20 years oil bounced between support at 10.50 and resistance at 40.00. Starting in 2000 oil built out a massive blue bullish rising wedge that when broken to the upside propelled oil up to its all time high at 147. Once the price action took out the old all time high at 40, I labeled the massive trading range from 10.50 to 40.00 as a double bottom which was 276%. I added that 276% to the breakout point above 40 and got a price objective up to 146.

We may be seeing a similar setup, only this time it will be to the downside if our current blue bearish rising wedge plays out as a halfway pattern. I have many more oil charts I could show you but it’s getting late and I need to get this posted. The bottom line is Natural gas and oil may have finally completed their one year plus trading ranges that may offer us a good opportunity go short. All the best…Rambus


RIPPLE Crypto-Currency Up 20% Today….. It’s The Wild West Out There

Rippl-Chart-5-31-17

After the crypto-currency, Ripple, fell 12% yesterday, it surged over 20% in trading today.  Folks, it’s the Wild West out there in crypto-currency land.  I have been spending some time looking into these crypto-currencies because there seems to be a great deal of mystery behind them.  And I like looking into and solving mysteries.

Of course, the rapid increase in price has sparked some interest, but very few realize just how much energy and capital it takes to produce one Bitcoin today.  Actually, I was quite surprised.

I want my readers to know that I will be doing some research and writing some articles and Reports on these crypto-currencies (along with Gold & Silver) as I believe we are going to be seeing a lot more about them as well as rising interest in the markets going forward.

That being said, there is a lot of misinformation being spread around the alternative media about these cyrpto-currencies.


First…. these crypto-currencies are much different than gold and silver.  I know that.  I don’t need any of my readers to leave a comment making sure I know that.  LOL… I do.

Second… there is a lot of mystery behind these crypto-currencies in which the public has no clue.   So, I see a lot of opinions being made (negative & positive) due to a lack of knowledge or prejudice.

Third…. there is a good chance that these crypto-currencies will continue to gain more interest and market trading as time goes by.  However, it is the WILD WEST out there and a lot of people are likely going to lose a lot of money trading or investing in these crypto-currencies because they have no idea of what the living hades they are doing.

Lastly…. my interest in learning more about these crypto-currencies is to understand how they are functioning in the market and as a psuedo store of “Electronic Economic Value”, if there is such a thing.  Again, Bitcoin mining and transactions are consuming one hell of a lot of electricity.  We are talking TeraWatts.

Thus, Bitcoin mining is consuming an ever-increasing amount of electricity.  Thus, the cost to produce Bitcoin will continue to increase going forward… as it has in the past.  Whether that means a Bitcoin does hold some value, is another thing entirely… but again, I had no idea of the massive amount of electricity and capital expenditures it takes just to produce one Bitcoin.

I will be doing more research on this subject and how it pertains to Gold & Silver going forward.

Check back for new articles and updates at the SRSrocco Report.

Invest in Yourself

2012-07-11-body-armor-gold-upThe other day, I was asked what my investment advice for a 65-year old would be? My reply: “Go to the gym and watch your expenses.” To create wealth and/or preserve it for a future generation, all too often do we lose sight of the big picture. Let me explain.

Most of us invest because we pursue long-term goals, even if the means of achieving them differ greatly. This long-term goal tends to be saving for retirement; for those who can, it might extend to save for a future generation; or, for institutional investors, there might be an infinite investment horizon.

To serve investors, we have a massive industry paid in basis points of assets serviced or commission on products sold. In my humble opinion, our industry is ill equipped to provide advice that falls outside of those parameters. Here are a few of those:

Go to the gym. Seriously. You don’t need to be a wizard able to dissect financial statements to appreciate that your own earnings potential is the one you might have most control over. You have more income options at your disposal if you stay healthy until an old age. While there are limits as to how much we can control our health, it is an aspect of our lives that many of us could easily improve. If you want “diversification” in your portfolio, investing in your own health is something you might want to add to your list. If you manage an endowment, this may not apply, except that sending your board of directors to the gym may not be such a bad idea either.


Watch your expenses. Even more seriously. In an industry offering services on what to do with your hard-earned money, there is too little emphasis on reducing expenses. Businesses and people typically don’t go out of business because of a lack of revenue; they typically go out of business because their expenses are too high relative to their revenue. College students can live off barely any income, but somehow, we all pick up a boatload of recurring expenses as we grow older. The same applies to institutions: for example, donations may lead to new buildings, but those buildings need to be maintained. Most institutions, at least, have formal budget plans. 

When an individual goes to a financial planner, they may be asked about their retirement spending habits. I allege that just as many have very little appreciation of what “risk” in a portfolio means, few know how their expenses will evolve once they retire. 

May I propose that you analyze your current spending habits to better understand how your spending may evolve? Your current spending discipline may speak volumes about your future spending discipline. To give an example: a good fifteen years ago, I discussed spending habits with two investors: both had a family, both lived in affluent neighborhoods; one of them had about four times the income of the other one. Yet, the person with the more modest income saved more each year than the high earner. And guess what: today, the high earner continues to splurge most of his money while the more modest person has continued to prudently build his retirement nest egg. 

There are plenty of models on how much you might be spending in retirement. Adjusting one’s expected future expenses based on a frank assessment of one’s own character might make the exercise more realistic. And the more seriously one takes the exercise of assessing one’s spending habits, the more likely it is that one can actually learn to manage those expenses.

Be a role model for your kids. Financially that is. If you want to save for the next generation, live by example. How can you expect your children to live within their means if you don’t? Financial education is good for everyone, including children. Let’s assume for a moment you are fortunate enough to be able to leave something for the next generation, wouldn’t you want them to also preserve the wealth for the following generation? A good starting point to raise them without feeling entitled may be to teach them about the value of money; and while a lesson on monetary policy wouldn’t hurt, such knowledge doesn’t matter if children do not understand how to keep their expenses in check. And that, in turn, may be difficult if their parents can’t do this. 

What does this all mean for your portfolio?
In the context of health, expense management and being a parental role model, can one draw conclusions about what one should invest in? The one takeaway may be that investing is not about bragging rights at cocktail parties. If you can afford it and can afford the risk that comes with an investment to “show off,” I don’t have a problem with anyone investing in a pet project or going along for the ride in a tech startup, be it through private equity or a fashionable stock. Let me just guess that if you are the type to go for the hot stock tip, the fashionable idea, you may also be the type of person who fails the Marshmallow Test; coincidentally, I allege it means your long-term investment returns are more likely to be disappointing. In my view one should treat their portfolio like a serious business.

None of this is rocket science. What makes this worth writing about anyway is that I see so many people not adhere to these simple concepts. I also see many parents struggle to help their children learn about finance and to respect the value of money. 

Once those basic concepts are understood, one can start talking about portfolio construction. In our industry, we differentiate between financial planners, asset allocators and portfolio managers. A do-it-yourself investor might be wearing all these hats simultaneously. To make it clear, I have nothing against do-it-yourself investors because they are engaged. I would much rather see a do-it-yourself investor who is engaged than someone who has lots of advisors, but doesn’t listen to them or manage them. Just like any outsourced relationship, hiring an investment professional requires management. 

In this spirit, please register for our June 22 Webinar entitled: “Invest in Yourself – What Your Advisor Doesn’t Tell You” where we shall expand on the discussionMake sure you subscribe to our free Merk Insights, if you haven’t already done so, and follow me at twitter.com/AxelMerk. If you believe this analysis might be of value to your friends, please share it with them. 

Axel Merk 
President & CIO, Merk Investments

The Best Bull Oil Thesis You’ve Never Heard Of

5006891 14961718469770 rId7Summary

AltaCorp in its May 26 report details a very contrarian bullish oil thesis.

They argue that the market is ignoring the crude quality difference between OPEC and US shale.

While US shale production continues to grow, the world will still be short of the crude grade that refineries want.

…continue reading AltaCorp’s Contrarian View – OPEC vs US Shale; A Tale of Two (Very Different) Crudes

3 Aerospace & Defense ETFs on the Move

rms15 nsm gal pic02 lgSometimes you stumble across a sector of the market that is just in the right place at the right time. That may very well be the sentiment driving the remarkable price action in aerospace and defense stocks in the current geopolitical environment.

These companies are the driving forces behind military and commercial aircraft, defense equipment, and other services designed to support the armed forces.

Exchange-traded funds (ETFs) that track defense stocks tend to be more aggressive and potentially more volatile than the broader market based on their concentrated portfolios. Investors that are considering these tools should opt to take smaller, tactical positions compared to a traditional core holding with wider diversification and minimal expenses.


It also goes without saying that politics and global military trends are likely to have the biggest impact on the direction of these ETFs over the next several years. But for right now, all of the macroeconomic winds are on these funds’ side.

….read next Page HERE