
Real Estate
Housing is hot again, but lately it’s been overshadowed by flashier bubbles in government debt, tech stocks and possibly cryptocurrencies.
Still, the warning signs are spreading. Today’s Wall Street Journal, for instance, reports that homeowners are back to using their houses as ATMs:
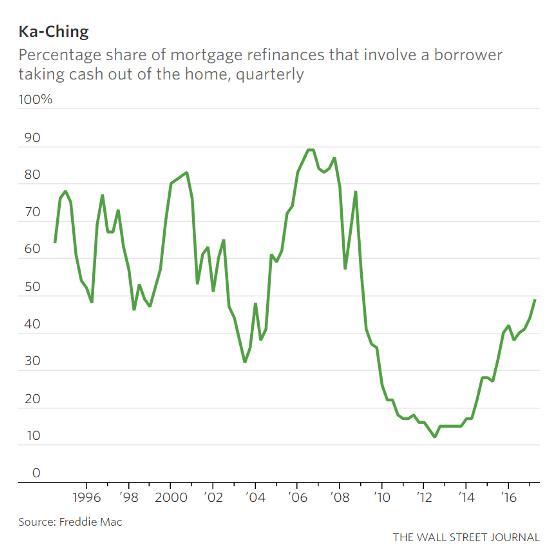
Homeowners Are Again Pocketing Cash as They Refinance Properties
Americans refinancing their mortgages are taking cash out in the process at levels not seen since the financial crisis.
Nearly half of borrowers who refinanced their homes in the first quarter chose the cash-out option, according to data released this week by Freddie Mac. That is the highest level since the fourth quarter of 2008.
The cash-out level is still well below the almost 90% peak hit in the run-up to the housing meltdown. But it is up sharply from the post-crisis nadir of 12% in the second quarter of 2012.
In a cash-out refi, a borrower refinances an existing mortgage with a new one, typically at a lower borrowing cost, that has a higher principal balance than the existing one. This allows the homeowner to pay off the old mortgage and still have cash left over for other uses.
The growing popularity of cash-out refis has helped buoy refinance activity. After booming for several years, demand for refinance mortgages had begun to slow as the Federal Reserve began increasing short-term interest rates and longer-term bond yields moved higher.
Mortgage rates remain low by historical standards, though. The average rate for a fixed, 30-year mortgage was 3.95%, Freddie Mac reported this week.
Meanwhile, rising home prices have helped increase the equity homeowners have in their houses. This allows more people to refinance to capture the benefit of lower mortgage rates.
And borrowers whose homes are rising in value are often more likely to be interested in refinancing for cash. For example, in Denver and Dallas, where home prices have jumped, more than half of refinancers opted for cash last year, according to Freddie Mac.
To some housing-market observers, the fact that more homeowners are tapping their homes for cash represents a healthy confidence in the economy. It comes against a backdrop of continued gains in employment.
At the same time, the increasing use of cash-out refis causes some concern since, in the run-up to the financial crisis, borrowers used their homes like veritable ATMs.
Len Kiefer, Freddie Mac’s deputy chief economist, says this time has been different. Borrowers now are subject to stricter standards when they get a loan or refinance a mortgage. There is also less money at stake now than a decade ago.
Cash-out refis in the first quarter represented about $14 billion in net home equity compared with more than $80 billion in each of three straight quarters in 2006. On an annual basis, total home equity cashed out in 2016 was $61 billion, according to Freddie Mac, versus $321 billion in 2006.
“People have been using cash-out for years,” Mr. Kiefer said. “From a personal-finance standpoint, it can make a lot of sense.”
One example is a borrower using the cash from a refinance to consolidate credit-card debt that has far higher yields. That in many cases can produce a big savings in debt-servicing costs by replacing debt that has double-digit interest rates with a loan that has a rate in the low single digits.

Here we go again. In every cycle, destructive behavior like using home equity to pay off credit cards or take vacations or whatever starts to surge. And every time the banking/real estate complex trots out paid spokesmen masquerading as economists to explain that this behavior is perfectly safe because everything else is going so well.
This deception eventually blows up in their faces, the pseudo-economists are disgraced (See Realtors’ Former Top Economist Says Don’t Blame the Messenger) and the people suckered in by the experts’ assurances are stuck with bills they can’t pay.
If cash-out refis continue to soar in the second quarter, then housing is officially a bubble again — with one big difference: This time around it’s just one of many, which means the eventual reckoning will be a lot more complex and interesting.
….related:

“Technically Speaking” is a regular Tuesday commentary updating current market trends and highlighting shorter-term investment strategies, risks, and potential opportunities:
With the markets closed on Monday, there really isn’t much to update you on “technically” from this past weekend’s missive. The important point, if you haven’t read it, was:
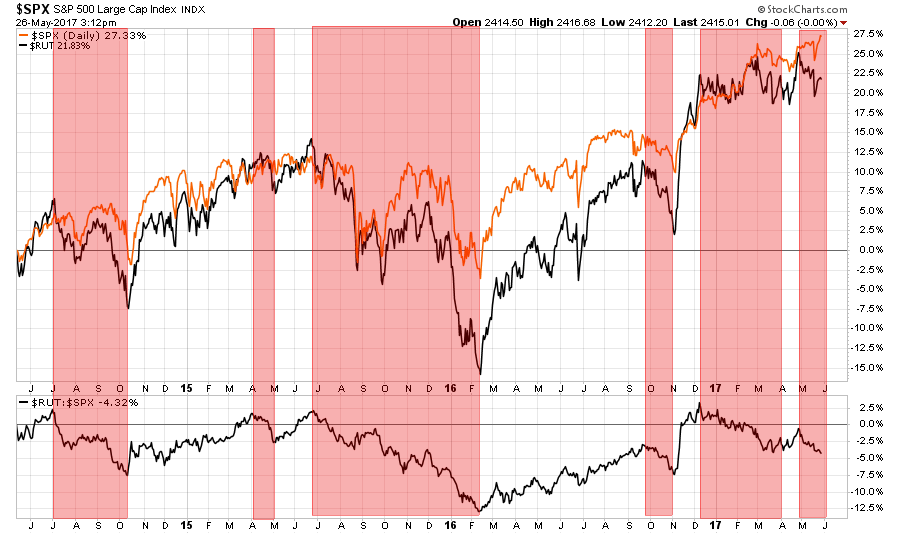
“The failure of the market to rotate to the “risk on” trade should not be lightly dismissed. A healthy breakout of the market should have been accompanied by both an increase in trading volume and leadership from the “smaller and riskier” stocks in the market.
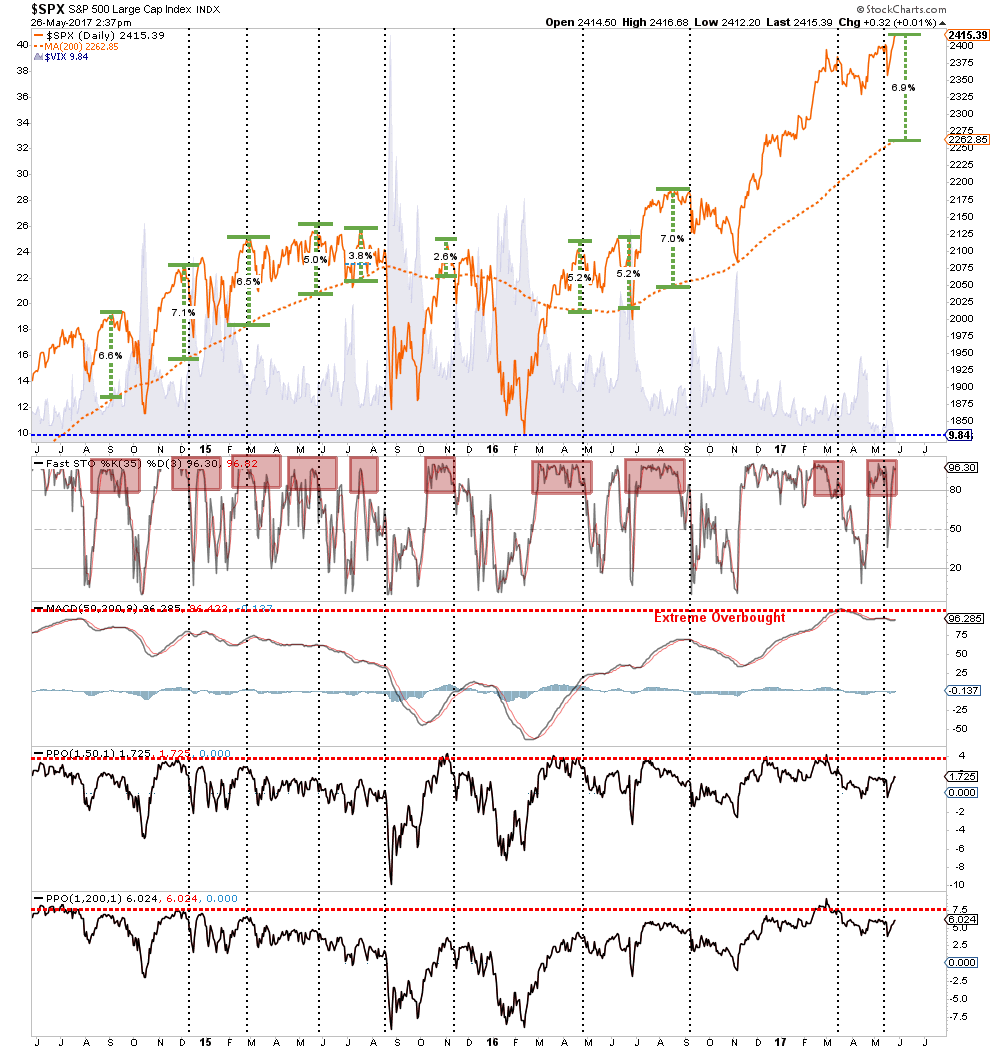
You can see this exuberance in the deviation of the S&P 500 from its long-term moving averages as compared to the collapse in the volatility index. There is simply “NO FEAR” of a correction in the markets currently which has always been a precedent for a correction in the past.
The chart below is a MONTHLY chart of the S&P 500 which removes the daily price volatility to reveal some longer-term market dynamics. With the markets currently trading 3-standard deviations above their intermediate-term moving average, and with longer-term sell signals still weighing on the market, some caution is advisable.
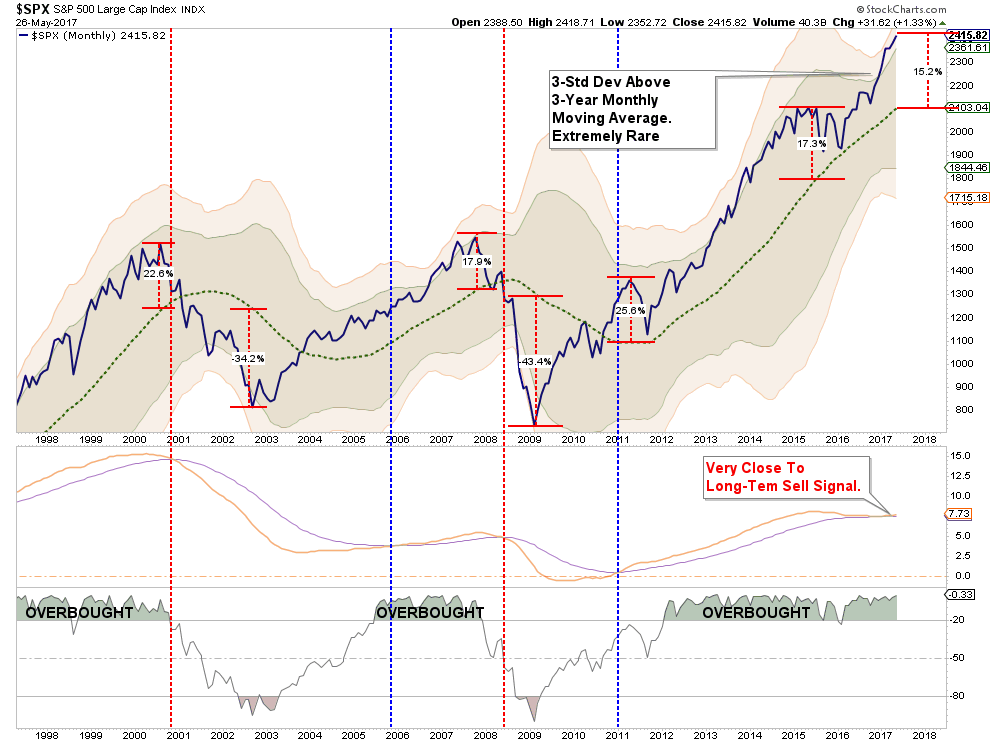
While this analysis does NOT suggest an imminent “crash,” it DOES SUGGEST a corrective action is more likely than not. The only question, as always, is timing.
However, this brings me to something I have addressed in the past but thought would be a good reminder as we head into the summer months:
“The most dangerous element to our success as investors…is ourselves.”
The Formula To Buy High / Sell Low
This past week, Mark Yusko and I had the following exchange on Twitter.
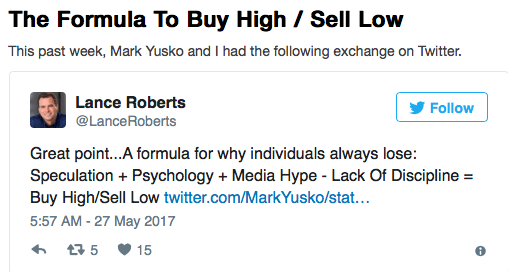
The point here is quite simple. Individuals, especially in very late-stage cyclical bull markets, tend to get “sucked” into the markets primarily due to the Wall Street and media driven hype which feeds the “fear of missing out (FOMO).” As I noted previously:
“The longer a bull market exists, the more it is believed that it will last indefinitely.”
The chart below shows the long-term view of the market with its inherent full-market (combined secular bull and bear)cycles exposed.
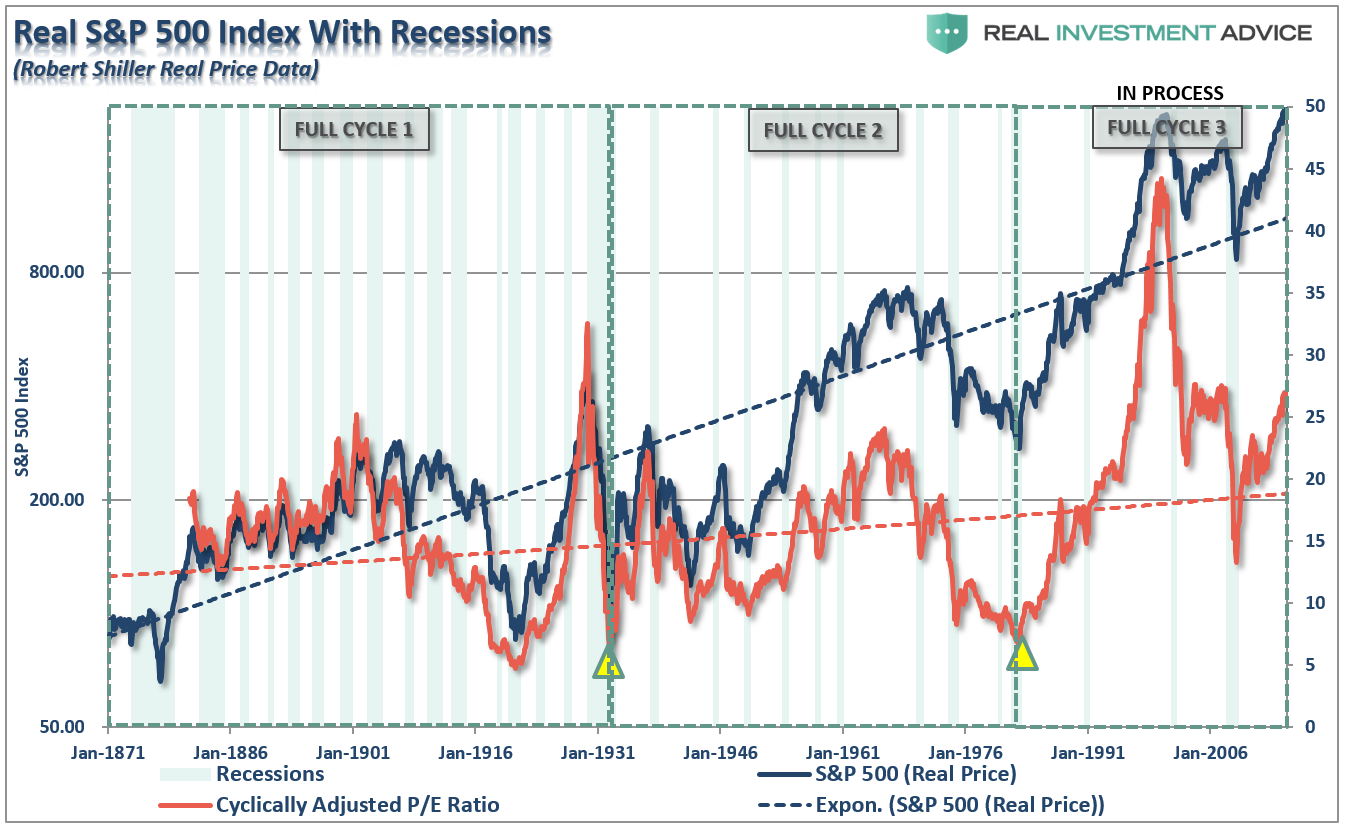
The idea of full market cycles is important to understand as this is precisely how the formula functions. In the latter stages of the bull market cycle, as “exuberance” eventually sucks the last of the holdouts back in, the “buy high” side of the equation is fulfilled. The second half of the full-market cycle will complete the process.
Every year Dalbar releases their annual “Quantitative Analysis of Investor Behavior” study which continues to show just how poorly investors perform relative to market benchmarks over time. More importantly, they discuss many of the reasons for that underperformance which are all directly attributable to your brain.
George Dvorsky once wrote that:
“The human brain is capable of 1016 processes per second, which makes it far more powerful than any computer currently in existence. But that doesn’t mean our brains don’t have major limitations. The lowly calculator can do math thousands of times better than we can, and our memories are often less than useless — plus, we’re subject to cognitive biases, those annoying glitches in our thinking that cause us to make questionable decisions and reach erroneous conclusions.“
Cognitive biases are an anathema to portfolio management as it impairs our ability to remain emotionally disconnected from our money. As history all too clearly shows, investors always do the “opposite”of what they should when it comes to investing their own money. They “buy high” as the emotion of “greed”overtakes logic and “sell low” as “fear” impairs the decision-making process.
Here are the top-5 of the most insidious biases which keep you from achieving your long-term investment goals.
1) Confirmation Bias
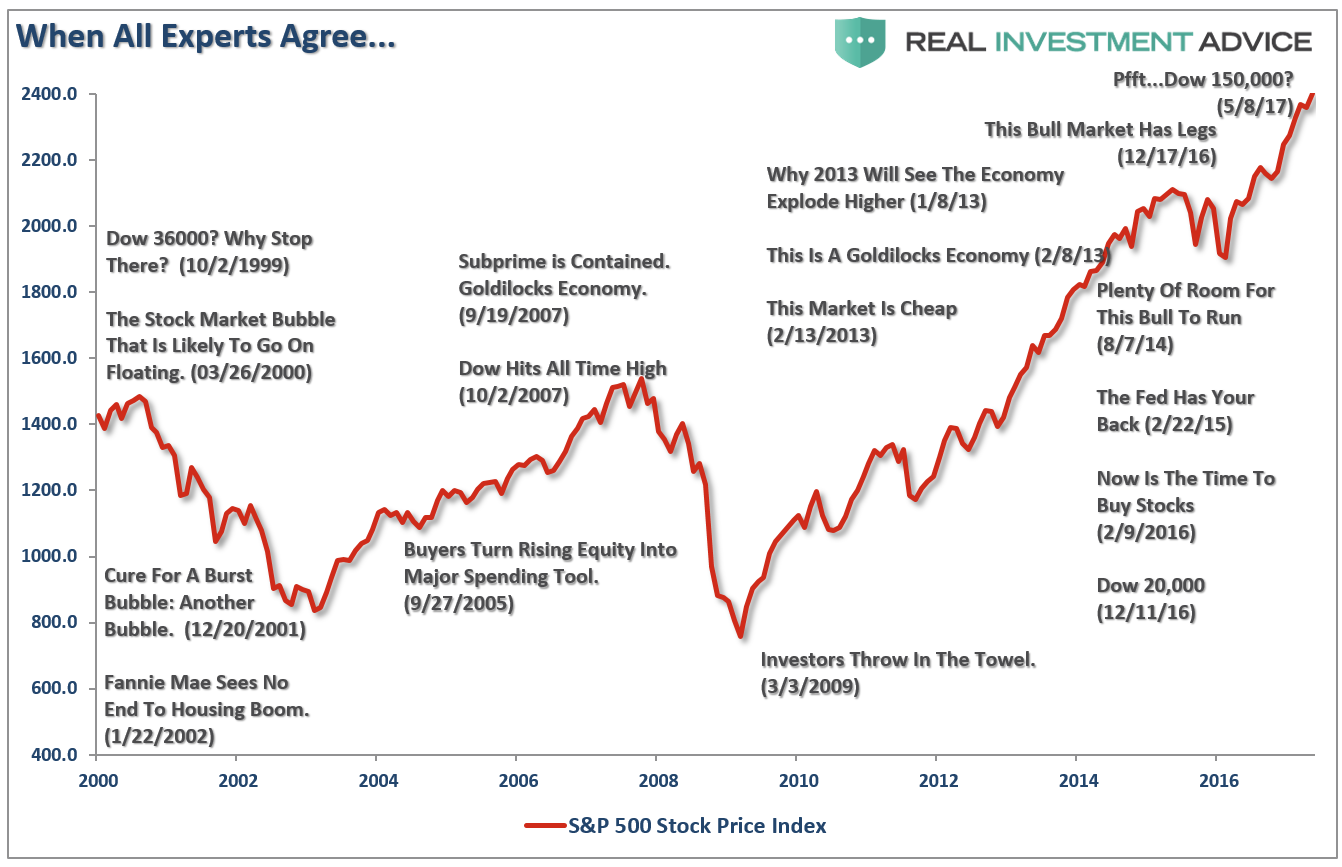
As individuals, we tend to seek out information that conforms to our current beliefs. If one believes that the stock market is going to rise, they tend to only seek out news and information that supports that position. This confirmation bias is a primary driver of the psychological investing cycle of individuals as shown below. I discussed this just recently in why “5-Laws Of Human Stupidity” and in “Media Headlines Will Lead You To Ruin.”
As individuals, we want “affirmation” our current thought processes are correct. As human beings, we hate being told we are wrong, so we tend to seek out sources that tell us we are “right.”
This is why it is always important to consider both sides of every debate equally and analyze the data accordingly. Being right and making money are not mutually exclusive.
The issue of “confirmation bias” also creates a problem for the media. Since the media requires “paid advertisers” to create revenue, viewer or readership is paramount to obtaining those clients. As financial markets are rising, presenting non-confirming views of the financial markets lowers views and reads as investors seek sources to “confirm” their current beliefs.
As individuals, we want “affirmation” our current thought processes are correct. As human beings, we hate being told we are wrong, so we tend to seek out sources that tell us we are “right.”
This is why it is always important to consider both sides of every debate equally and analyze the data accordingly. Being right and making money are not mutually exclusive.
2) Gambler’s Fallacy
The “Gambler’s Fallacy” is one of the biggest issues faced by individuals when investing. As emotionally driven human beings, we tend to put a tremendous amount of weight on previous events believing that future outcomes will somehow be the same.
The bias is clearly addressed at the bottom of every piece of financial literature.
“Past performance is no guarantee of future results.”
However, despite that statement being plastered everywhere in the financial universe, individuals consistently dismiss the warning and focus on past returns expecting similar results in the future.
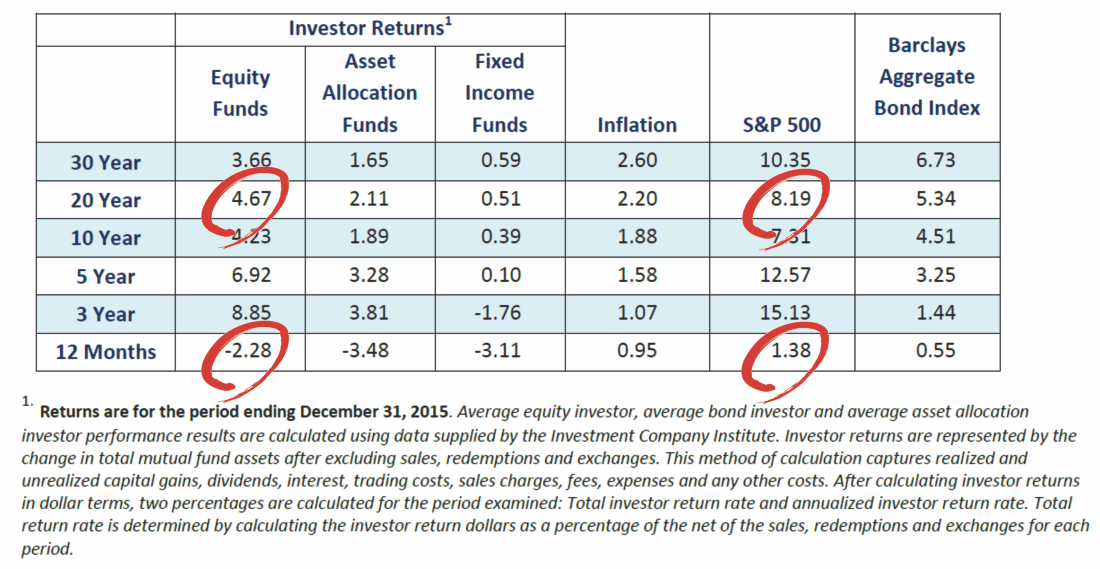
This is one of the key issues that affect investor’s long-term returns. Performance chasing has a high propensity to fail continually causing investors to jump from one late cycle strategy to the next. This is shown in the periodic table of returns below. “Hot hands” only tend to last on average 2-3 years before going “cold.”
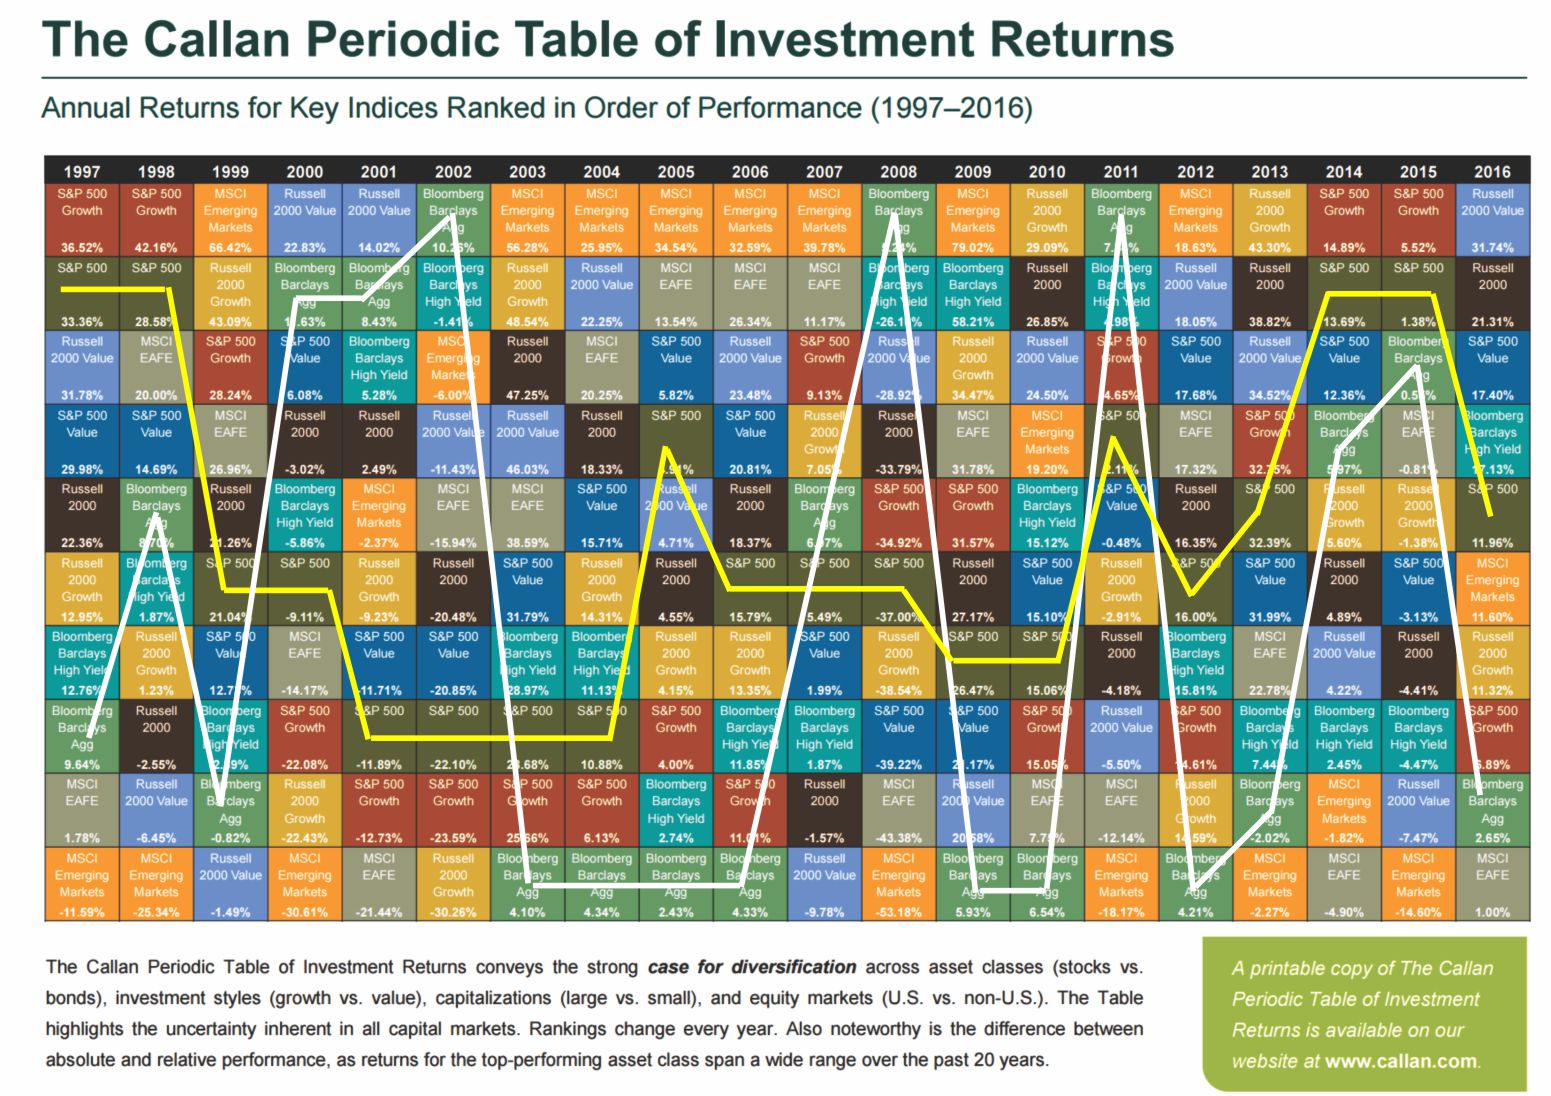
I traced out the returns of the S&P 500 and the Barclay’s Aggregate Bond Index for illustrative purposes. Importantly, you should notice that whatever is at the top of the list in some years tends to fall to the bottom of the list in subsequent years. “Performance chasing” is a major detraction from investor’s long-term investment returns.
Of course, it also suggests that analyzing last year’s losers, which would make you a contrarian, has often yielded higher returns in the near future. Just something to think about with “bonds” as one of the most hated asset classes currently.
3) Probability Neglect
When it comes to “risk taking” there are two ways to assess the potential outcome. There are “possibilities” and “probabilities.” As individuals, we tend to lean toward what is possible such as playing the “lottery.” The statistical probabilities of winning the lottery are astronomical, in fact, you are more likely to die on the way to purchase the ticket than actually winning the lottery. It is the “possibility” of being fabulously wealthy that makes the lottery so successful as a “tax on poor people.”
As investors, we tend to neglect the “probabilities” of any given action which is specifically the statistical measure of “risk” undertaken with any given investment. As individuals, our bias is to “chase”stocks that have already shown the biggest increase in price as it is “possible” they could move even higher. However, the “probability” is that most of the gains are likely already built into the current move and that a corrective action will occur first.
Robert Rubin, former Secretary of the Treasury, once stated;
“As I think back over the years, I have been guided by four principles for decision making. First, the only certainty is that there is no certainty. Second, every decision, as a consequence, is a matter of weighing probabilities. Third, despite uncertainty we must decide and we must act. And lastly, we need to judge decisions not only on the results, but on how they were made.
Most people are in denial about uncertainty. They assume they’re lucky, and that the unpredictable can be reliably forecast. This keeps business brisk for palm readers, psychics, and stockbrokers, but it’s a terrible way to deal with uncertainty. If there are no absolutes, then all decisions become matters of judging the probability of different outcomes, and the costs and benefits of each. Then, on that basis, you can make a good decision.”
Probability neglect is another major component to why investors consistently “buy high and sell low.”
4) Herd Bias
Though we are often unconscious of the action, humans tend to “go with the crowd.” Much of this behavior relates back to “confirmation” of our decisions but also the need for acceptance. The thought process is rooted in the belief that if “everyone else” is doing something, they if I want to be accepted I need to do it too.
In life, “conforming” to the norm is socially accepted and in many ways expected. However, in the financial markets, the “herding” behavior is what drives market excesses during advances and declines.
As Howard Marks once stated:
“Resisting – and thereby achieving success as a contrarian – isn’t easy. Things combine to make it difficult; including natural herd tendencies and the pain imposed by being out of step, since momentum invariably makes pro-cyclical actions look correct for a while. (That’s why it’s essential to remember that ‘being too far ahead of your time is indistinguishable from being wrong.’
Given the uncertain nature of the future, and thus the difficulty of being confident your position is the right one – especially as price moves against you – it’s challenging to be a lonely contrarian.”
Moving against the “herd” is where the most profits are generated by investors in the long term. The difficulty for most individuals, unfortunately, is knowing when to “bet” against the stampede.
5) Anchoring Effect
This is also known as a “relativity trap” which is the tendency for us to compare our current situation within the scope of our own limited experiences. For example, I would be willing to bet that you could tell me exactly what you paid for your first home and what you eventually sold it for. However, can you tell me what exactly what you paid for your first bar of soap, your first hamburger or your first pair of shoes? Probably not.
The reason is that the purchase of the home was a major “life” event. Therefore, we attach particular significance to that event and remember it vividly. If there was a gain between the purchase and sale price of the home, it was a positive event and, therefore, we assume that the next home purchase will have a similar result. We are mentally “anchored” to that event and base our future decisions around a very limited data.
When it comes to investing we do very much the same thing. If we buy a stock and it goes up, we remember that event. Therefore, we become anchored to that stock as opposed to one that lost value. Individuals tend to “shun”stocks that lost value even if they were simply bought and sold at the wrong times due to investor error. After all, it is not “our” fault that the investment lost money; it was just a bad stock. Right?
This “anchoring” effect also contributes to performance chasing over time. If you made money with ABC stock but lost money on DEF, then you “anchor” on ABC and keep buying it as it rises. When the stock begins its inevitable “reversion,” investors remain “anchored” on past performance until the “pain of ownership”exceeds their emotional threshold. It is then that they panic “sell” and are now “anchored” to a negative experience and never buy shares of ABC again.
This is ultimately the “end-game” of the current rise of the “passive indexing” mantra. When the selling begins, there will be a point where the pain of “holding” becomes to great as losses mount. It is at that point where “passive indexing” becomes “active selling” as our inherent emotional biases overtake the seemingly simplistic logic of “buy and hold.”
Conclusion
In the end, we are just human. Despite the best of our intentions, it is nearly impossible for an individual to be devoid of the emotional biases that inevitably lead to poor investment decision making over time. This is why all great investors have strict investment disciplines that they follow to reduce the impact of human emotions.
Take a step back from the media, and Wall Street commentary, for a moment and make an honest assessment of the financial markets today. Does the current extension of the financial markets appear to be rational? Are individuals current assessing the “possibilities” or the “probabilities” in the markets?
As individuals, we are investing our hard earned “savings” into the Wall Street casino. Our job is to “bet” when the “odds” of winning are in our favor. Secondly, and arguably the most important, is to know when to “push away”from the table to keep our “winnings.”

Strengths
- The best-performing precious metal for the week was palladium, up 4.18 percent. Bloomberg reports that rising automobile demand may be sending palladium futures toward the steepest rally since April 20.
- Bloomberg’s weekly poll of traders and analysts show the trending heading toward bullishness, with 10 bullish, five bearish and four neutral. Analysts point to concerns over terrorism, probes into President Donald Trump’s links to Russia and doubts that the Federal Reserve will raise rates in June, as factors that may spur investors to choose gold.
- China’s gold demand in 2017 is still the strongest in four years, reports Bloomberg. Although higher prices have deterred some buyers, dropping gold purchases from 15-month highs, the World Gold Council (WGC) sees demand growing to 900 to 1,000 metric tons for the full year.
Weaknesses
- The worst-performing metal for the week was gold, albeit still positive with a gain of 0.91 percent.
- The biggest gold miner ETF, the VanEck Vectors Gold Miners ETF, saw record outflows this week. On Wednesday, investors withdrew $662 million from the fund, making it the worst daily outflow since 2006. Similarly, the VanEck Vectors Junior Gold Miners ETF has had outflows of $804 million since March 31, after record inflows last quarter prompted the fund to change its portfolio structure. Bloomberg reports that the fund is now on track for the biggest quarterly outflow since the fund’s inception in 2009.
- A handful of gold mining stocks are experiencing challenges this week. Tragically, a fatal accident occurred at Torex Gold’s construction site at the El Limon Sur pit in Mexico. The ongoing ban on exports of mineral concentrate from Tanzania could cut Barrick Gold’s gold production by up to 6 percent this year, as Barrick’s equity interest in Acacia accounts for around 10 percent of its gold production. And Freeport-McMoRan has let go about 4,000 workers after a strike at the company’s Indonesian operations.
Opportunities
- Bank of America Merrill Lynch published a report this week on the company’s global mining conference in Barcelona. BofAML reports that most gold mining companies are in better condition than last year, due in great part to the better corporate discipline, with more focus on value over risk.
- Deutsche Bank published a special report on the global gold sector, stating “we feel investors should prepare for a flight to gold” in the uncertain global climate. The report also emphasizes the importance of looking for the gold stocks that offer better value, growth or leverage. Deutsche highlights the top global gold stocks as Newmont, Evolution Mining, St. Barbara Mining, Alacer Gold and Dacian Gold.
- Dacian CEO Rohan Williams told reporters that the recent deal between Eldorado and Integra signals the beginning of a cycle of mergers and acquisitions (M&A). More optimism for gold comes from Trump’s political troubles after Republicans criticized his budget. The gold price has risen, and gold’s open interest, a tally of outstanding contracts, has climbed to the highest since April 27. The chart below shows that the MACD (the gauge of price momentum) is above the “Sig,” or signal line, which is considered a bullish indicator. Yet another bullish indicator is that gold has experienced a golden cross, which happens when the 50-day moving average crosses above the 200-day moving average.

Threats
- Sibanye Gold recent acquisition of Stillwater Mining is under review in the courts. Some Stillwater investors contend that they were shortchanged with the purchase price of $18 per share. Sibanye is the U.S.’s only producer of platinum-group metals.
- South Africa is proposing to change the minimum black ownership of mining assets from 26 percent to 30 percent. Mines Minister Mosebenzi Zwane included this proposal in a mining charter. However, senior party policy officials said there may be negative consequences from such a measure, and that it may deter investment.
- Tanzanian Mines Minister Sospeter Muhongo was fired after an audit revealed that mineral exports had been understated. Acacia Mining has been investigated by a presidential committee, showing that Acacia reported certain containers held 26,000 ounces of gold, while the committee found those containers to hold 250,000 ounces. The magnitude of the discrepancy implies that the source mines, Bulyanhulu and Buzwagi, would actually be the world’s two largest gold producers. Those familiar with the events have called for an independent review. Acacia stock tumbled around 40 percent this week.

Dr. Michael Berry is the go-to guest when it comes to parsing the tea leaves of the central banks, the US Federal Reserve which has singularly the largest impact on interest rates, stock markets & commodity pricing.
….also: When People Pay No Price For Being Wrong


-
I know Mike is a very solid investor and respect his opinions very much. So if he says pay attention to this or that - I will.
~ Dale G.
-
I've started managing my own investments so view Michael's site as a one-stop shop from which to get information and perspectives.
~ Dave E.
-
Michael offers easy reading, honest, common sense information that anyone can use in a practical manner.
~ der_al.
-
A sane voice in a scrambled investment world.
~ Ed R.
Inside Edge Pro Contributors

Greg Weldon

Josef Schachter

Tyler Bollhorn

Ryan Irvine

Paul Beattie

Martin Straith

Patrick Ceresna

Mark Leibovit

James Thorne

Victor Adair