
Timing & trends
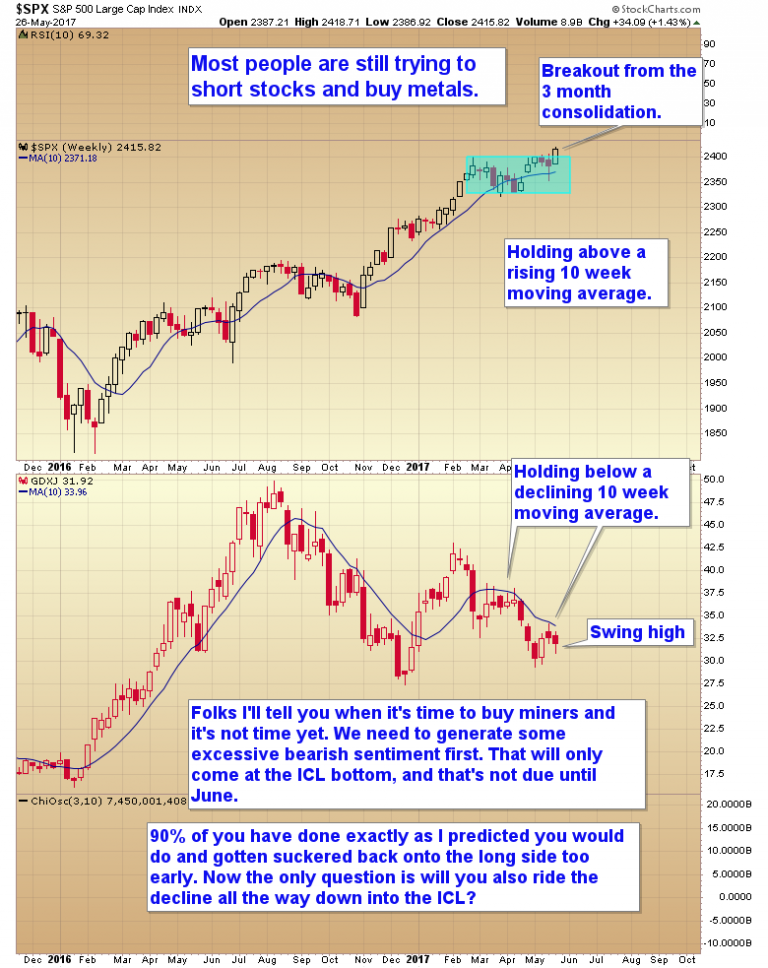
I’ll tell you when it’s time to buy miners and it’s not time yet. We need to generate some excessive bearish sentiment first. That will come only at the intermediate cycle bottom. And that’s not due until June.

 1. Marc Faber on Canada, Real Estate and Investing in Canada
Excess global liquidity pushing Canadian Real Estate and other topics. One point Marc makes is that when the US stock market comes under pressure money will begin to flow into resource stocks and a lot of money will flow into Canada.
2. Bank of Canada, Interest Rates, the Economy & Misery Loves Company
Stephen Poloz, Governor of the Bank of Canada said they are keeping rates the same for the 15th time in face of uncertainty. Also his views on the economy, challenges from the US including the selloff of their strategic oil reserve and more….
3. The Dollar’s Last Stand
The million dollar question remains, is the 2 year trading range a top or a consolidation pattern to the upside? Up to this point nothing is broken yet in regards to the big picture, but that could change in a heartbeat.
 The following is a summary of our recent Financial Sense Newshour podcast, which aired on Saturday here and on iTunes here.
The S&P 500, Dow Jones Industrial Average, and Russell 2000 have moved sideways over the last couple of months as global markets have outperfomed. Looking at long-term trends and forces, however, US stocks should continue in a structural bull market that will last years more, Piper Jaffray’s Craig Johnson recently told Financial Sense Newshour.
Long-Term Bull Market
We aren’t simply in a bull market, Johnson noted. Investors need to think of this specifically as a long-term, structural bull market.
There are two big forces coming to bear that will keep markets structurally bullish, Johnson stated. The current market has about 20 to 25 percent fewer stocks than in 2000. Also, we’re seeing companies buying back a huge amount of their own stocks.
As a result, there are fewer shares outstanding overall. If we get a repatriation of capital held outside the US due to tax reform or amnesty, it will go toward dividends and further share buybacks.
Though many have suggested valuations are already extended, Johnson doesn’t agree. If we see 10 percent earnings growth next year, coupled with a tax rate cut, we’ll likely see a pickup in bottom-line earnings growth, he noted.
“If the multiple of the market stays flat to where we are now … (markets) are not terribly expensive,” he said. “A lot of people say we’re at nosebleed levels, and at this point in time I don’t believe that is the case at all.”
This could see us push through his current 2424 target for the S&P 500, said Craig.
“This is going to be a structural move higher for equities,” Johnson said. “I think this is not a 1-year move — I think this is probably a 5- or 10-year advance. Because of that, any of these little dips we see in the marketplace … I want to be buyers of these dips for the longer term.”
Watch 10-Year Yields
The 10-year bond yield is the thing we should most understand about this market, Johnson stated. The spread between 2- and 10-year notes has closed quite a bit lately.
“From my vantage point, we need to see some inflation expectations come into the market,” Johnson said.
Everybody seems to believe the Fed is determined to raise rates, he added. While the Fed has a great deal of control on the short end, at the long end it has less control.
Right now, bond investors don’t believe there’s going to be a lot of inflation, and they’re also worried about the flattening of the yield curve, Johnson noted. This suggests they’re anticipating a weak economic environment ahead.
“I will tell you right now … the Fed is not going to be aggressively raising rates,” Johnson said. “They’ll stay on the sidelines. That’s what I think will ultimately be the shift in psychology that investors are going to face certainly in June and definitely July.”
If that proves to be the case, we should look for the 10-year bond yield to move up. Johnson favors a range of 2.75 to 3. As we move above that 2.75 level, we will begin to see the asset allocation shift he’s expecting.
Right now, Johnson suggests buying technology, energy, and materials. He suggests being very selective when buying in the energy sector, and inside technology, he wants to selectively add semiconductors.
This bull market has shrunk, and it looks like its continuing to shrink,” Johnson said. “I think we ultimately know what direction the market goes when that occurs.”
 Ludwig von Mises and Friedrich Hayek, the most prominent “Austrian” economists of the time, anticipated the 1929 stock market crash and correctly predicted the dire consequences of government attempts to artificially stimulate economic growth in the aftermath of the crash. John Maynard Keynes, on the other hand, was totally blindsided by the stock market crash and the economic disaster of the early 1930s. And yet, Keynes’s theories gained enormous popularity during the 1930s whereas the work of Mises and Hayek was largely ignored. Why was it so?
Keynes became popular because he told the politically powerful what they wanted to hear. In particular, he provided power-hungry politicians with intellectual support for the schemes they not only already had in mind, but in many cases were already putting into practice. Despite being riddled with errors, Keynes’ theories also appealed to many economists because the implementation of these theories would confer a lot more influence upon the economics fraternity. The fact is that in a free economy there wouldn’t be much for an economist to do other than teach economics. He/she would certainly never have the opportunity to be involved in the ‘management’ of the economy.
The points outlined in the above paragraph, along with Keynes’ charisma and salesmanship, explain why “Keynesian” economic theories became dominant, but it doesn’t explain how they managed to stay dominant in the face of an ever-growing mountain of evidence indicating that they result in long-term economic decline.
As far as I can tell, the theories have stayed popular for three main reasons. First, not only do they mesh with the personal goals of almost all current politicians, but also there is now a huge government apparatus in place that depends upon the continued application of these theories. In other words, a large chunk of the population now has a vested interest in perpetuating the myth that the government should ‘manage’ the economy. Second, it usually isn’t possible to disprove an economic theory using data, because the same data can usually be interpreted in different ways and used to justify opposing theories. The hard reality is that in the science of economics you must start with the correct theory in order to correctly interpret the data. Third, Keynesianism is more like a stream of anecdotes than a coherent theory, in that under this so-called theory most things are ‘explained’ by unforeseeable events and unpredictable shifts in “animal spirits”. It is impossible to invalidate an intellectual position that is constantly changing.
A good example of how the same data can be interpreted in different ways in order to support conflicting theories is provided by the 1937-1939 collapse of the US economy. According to the “Austrians”, the fact that the US federal government propped up prices, drastically increased its spending, inflated the money supply, began interfering with many industries and generally did whatever it could to prevent the corrective process from running its course following the 1929 stock market crash guaranteed that all signs of economic recovery would quickly disappear as soon as the artificial support was scaled back. The mistake, according to the “Austrians”, was to provide the artificial support. According to the “Keynesians”, however, the mistake was to remove the artificial support prematurely. They argue that the government and the Fed should have continued to do whatever was needed to postpone a collapse, the idea being that with enough government assistance in the form of new money, new regulations, handouts, price controls and job-creating public works projects the economy would eventually gain enough strength to become self-supporting.
Unfortunately, when throwing ‘Keynesian stimulus’ in the form of more government spending, more credit and more monetary inflation at an economic downturn doesn’t lead to a self-sustaining recovery, the followers of Keynes will always have two comebacks. They can always assert that the stimulus would have worked if only it had been done more aggressively and/or that as bad as the economy has performed it would have performed even worse if not for the stimulus.
You can’t argue with that. At least, it’s an assertion that can never be unequivocally invalidated because it is never possible to go back in time and show what would have happened with different policies.
Recent news regarding Moody’s credit downgrades in China will likely continue to roil the global markets and present multiple unique opportunities for strategic investors. As debt concerns grow throughout some areas of Asia and new US policy efforts shake up some common perceptions, a shift in capital is likely to occur over the next few months.
Today, I read about massive layoffs in India’s technology sector as a reaction to decreasing engagement of foreign IT services/support is a result of President Trump’s policies. When we take this news in combination with Moody’s credit downgrades for China and the fact that almost all of South East Asia is interconnected in terms of economy and trade, we begin to see a picture that is fairly clear in terms of transitional economic shifts.
If India and a portion of South East Asia suffer a technology driven economic contraction as a result of US policy shifts, how can we evaluate the approximately $900+ billion economic shift that may be unfolding. As this unfolds, unemployment, consumer spending and growth rates will differ vastly from projected levels. A minor 2~3% decrease in business activity for the Asian technology sector may have massive results if it persists over a longer term period of time (say 3~7+ years). This is exactly why we, as investors, need to be aware of these economic shifts and be able to profit from these moves.
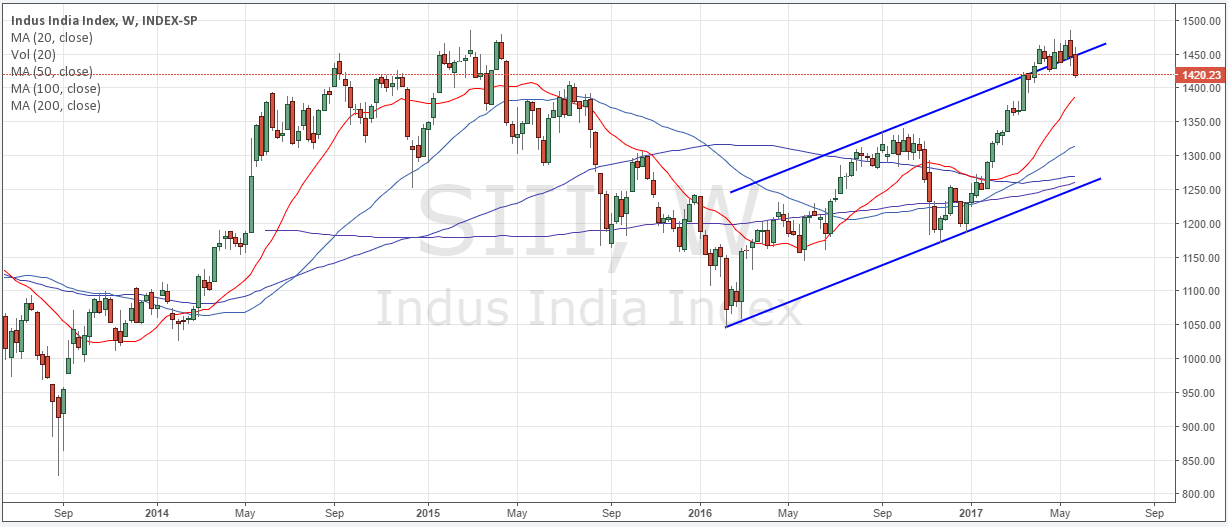
SIII (Indian Index)
The SIII has already rotated nearly 2% over the past two months from a near perfect Double-Top. The potential for a 10~20% market correction is rather strong knowing that massive layoffs in India will put further pressure on economic growth, consumer spending and economic outlook.
(Click to enlarge)
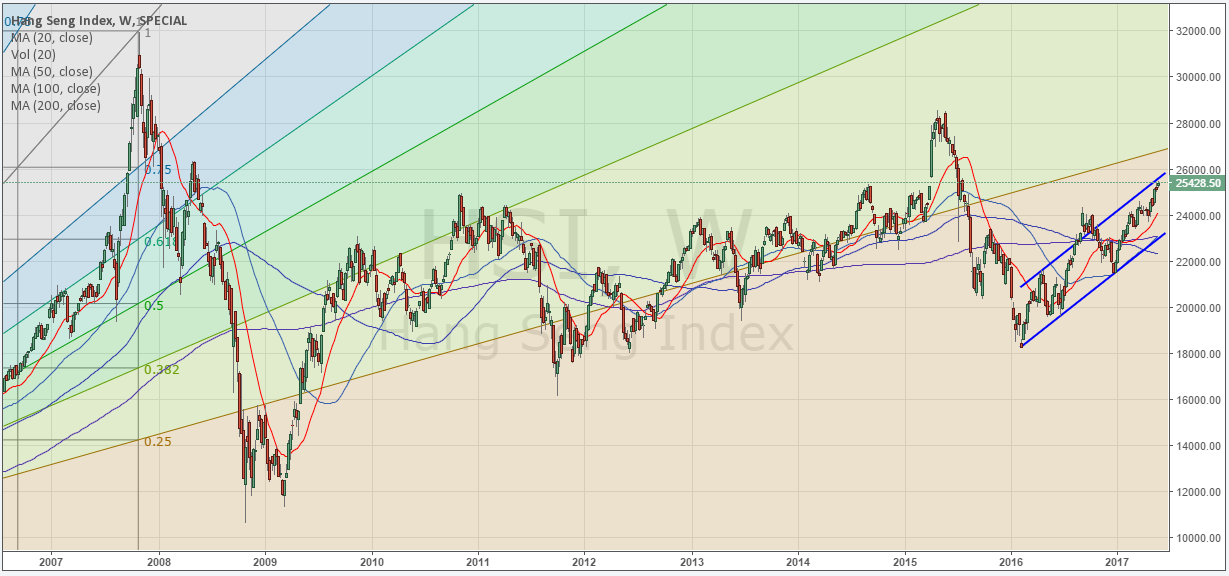
HSI (HangSeng Index)
The HSI is not showing signs of any market corrections yet. This is likely due to the fact that China is currently experiencing a technology/stock market bubble effect as a result of recent wealth creation. I would expect that any extended contraction in the bulk of South East Asia will also be seen and felt in China.
(Click to enlarge)
Custom BRICs Index
A custom BRICs Index shows a more defined price rotation and a clear series of lower high and lower low price trends. This would indicate that that the BRICs economies may have quite a large range of price volatility going forward with a potential for a 20~30% decline over the next few months.

(Click to enlarge)
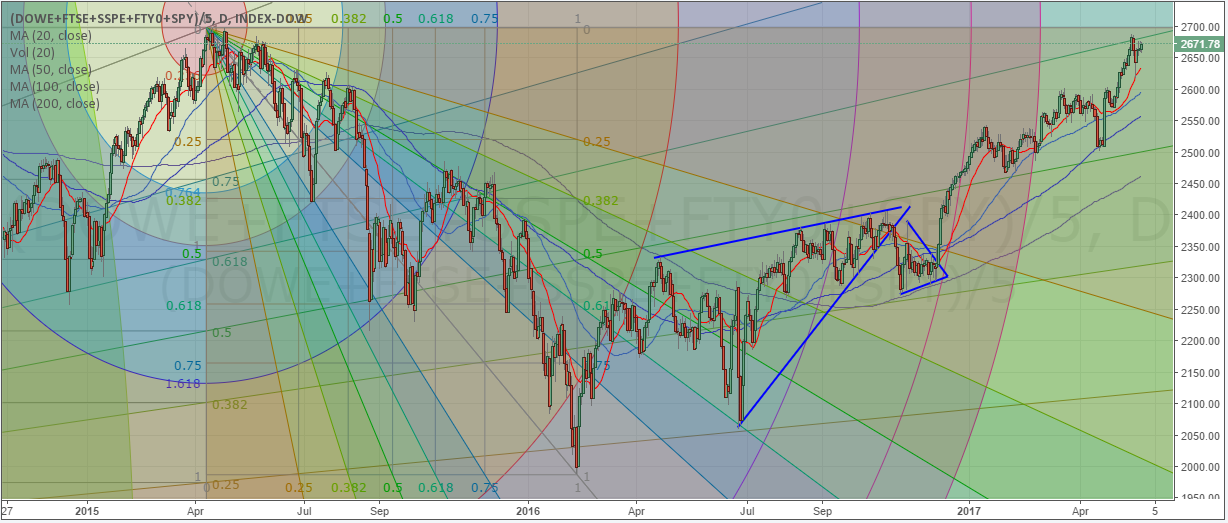
US/EU Custom Index
As this potential economic shift plays out, I suspect the US and European market will see a dramatic influx of capital investment and renewed economic activity. This chart of a custom index of US and EU indexes clearly shows the strength of these markets in relation to the economic shift that has been transacting. It is clear to see that shortly after the US Presidential elections (Nov 8th, 2017), this index has shot up 15%+ and has begun to retest 2015 highs. Could this be a massive double top to form later this year? It’s very possible.
(Click to enlarge)
Watch for this economic shift to continue to play out over the next 6~12+ months and watch for unique opportunities that will be presented by these moves..


-
I know Mike is a very solid investor and respect his opinions very much. So if he says pay attention to this or that - I will.
~ Dale G.
-
I've started managing my own investments so view Michael's site as a one-stop shop from which to get information and perspectives.
~ Dave E.
-
Michael offers easy reading, honest, common sense information that anyone can use in a practical manner.
~ der_al.
-
A sane voice in a scrambled investment world.
~ Ed R.
Inside Edge Pro Contributors

Greg Weldon

Josef Schachter

Tyler Bollhorn

Ryan Irvine

Paul Beattie

Martin Straith

Patrick Ceresna

Mark Leibovit

James Thorne

Victor Adair