
Bonds & Interest Rates

While the Fed may be raising rates, there is still a flight to quality underway that is giving a bid to US Treasury issues. Low Treasury yields may remain the norm even if the Federal Reserve raises rates again. At about 2.25%, 10-year yields have dropped to 2017 lows, even with the central bank signaling an imminent rate hike. Many still see the stock market crash and that also supplies a bit of an underlying bid right now. However, The Fed has also made it clear it will maintain a gradual approach to shrinking its massive bond portfolio thereby reversing the Quantitative Easing. We are in never-never-land where the Fed tightening will not yet have a direct impact upon the bonds on a one-for-one relationship.
….continue reading and view 3 more charts
….related from Martin:
US Pension Crisis Picking Up Full Speed

 On the heels of a wild week of trading in Bitcoin, what is happening in gold and the mining shares is going largely unnoticed but it is an all-time record and truly stunning.
From Jason Goepfert at SentimenTrader: Money keeps leaving the gold miners. Structural trouble in gold mining ETFs got a lot of media attention a couple of weeks ago, and investors have taken notice. The main gold mining ETFs have lost $5 billion in assets in less than 30 days…
…related:
Something Changed in the Silver Market in May: Here Are 3 Reasons Why

 Elon Musk is obsessed with speed. From rockets to hyperloops to electric cars, fast is kind of his thing.
Now he wants to apply the same aesthetic to manufacturing.
Critics argue it’s another pipe dream, born out of necessity. Tesla (TLSA), his controversial car business, is supposed to deliver 400,000 vehicles by 2018. Yet, his workers have never pushed annual production beyond 100,000.
Musk, however, is thinking beyond workers.
The future is total automation.
During the first Gilded Age, the assembly line transformed industrial production. This New Gilded Age is about information technology. Think intelligent software, sensors and incredibly precise, fast-moving robotics. These technologies promise exponential improvement in production.
Humans, at least those who fasten bolts or shift metal, become superfluous.
It’s not science fiction. Musk already has big plans for factories that are unencumbered by the physical limitations of humans.
In Tesla’s July 2016 mission statement he wrote about his epiphany: Turning the factory into a machine. He even gave it a cool name, the “alien dreadnought” the machine that makes the machines.
By his math, dreadnought version 3.0 could improve production by five- to ten-times. That’s still a few years away. Version 0.5 will debut in 2017, when the Tesla Model 3 begins production. Expect version 1.0 during 2018 when new equipment hits the factory floors.
In 2016, Musk secured a secret weapon to help him bring these futuristic factories closer to the present. Tesla bought Grohmann Engineering, a German automation specialist.
With 580 giant, robotic arms, current Tesla factories are already state-of-the-art. They push human limits. The Freemont, Calif., plant has seen a 400% increase in production since 2012. And workers — the human kind — have complained often about the frantic pace.
Dreadnought will supersede their frailties. In fact, robots will move so quickly and so efficiently that humans won’t be safe on the factory floors. So, just a skeleton staff of engineers will be on hand — and they will merely monitor production.
This would represent the first major advance in automobile manufacturing since Toyota introduced Just-in-Time in 1992. The premise is to produce cars on an as-needed basis, with minimum waste and maximum automation.
It’s the promise of the New Gilded Age. Most outcomes can be predetermined with access to computing power, data analytics and modeling software. Robotics-makers can build exactly what they need — and control it with incredibly sophisticated software.
A new industrial revolution is coming. And it will lead to unimagined profitability, and huge new opportunities for investors.
Dreadnought is the first step. Eliminating most humans, at least in theory, would improve production by orders of magnitude.
Engineering would be the sole arbiter of production. Raw materials would enter factories at one end. Finished cars would emerge from the other end.
It’s easy to want to bet against Musk. Automobile factory floors are already full of complex machines. The Robotics Industries Association estimates that 265,000 robots already work in U.S. factories. The consensus holds that all the potential efficiencies have been exploited.
However, Musk is ambitious, and talented. He is also in a hurry to get places.
He came up with a feasible plan for Hyperloop — a way to whisk passengers though a vacuum tube at 760 mph. His rocket company can deliver satellites to orbit, then return to Earth with pinpoint accuracy. His electric cars are safe, green and can blow away a Lamborghini.
He is used to doing what most people consider impossible. If he can pull off the alien dreadnought, the face of manufacturing will change forever. It’s a big deal.
I’m focused every day on finding the winners of the next industrial revolution. They’re lurking in all sorts of places you would not expect. Outside of Tesla, one of the best ways to bet on the growth of robots in factories is John Bean Technologies (JBT).
Here’s some more reading and listening on the subject:
- Tesla’s future is completely inhuman.
- Musk: Tesla’s factory will be an ‘alien dreadnought’ by 2018.
- Elon Musk just shared ‘the biggest epiphany’ he’s had this year.
- Tesla blog: Master Plan Part Deux.
- Video: How to Build the Future (Elon Musk interview).
- Industrial robots will replace manufacturing jobs — and that’s a good thing.
Best wishes,
Jon Markman
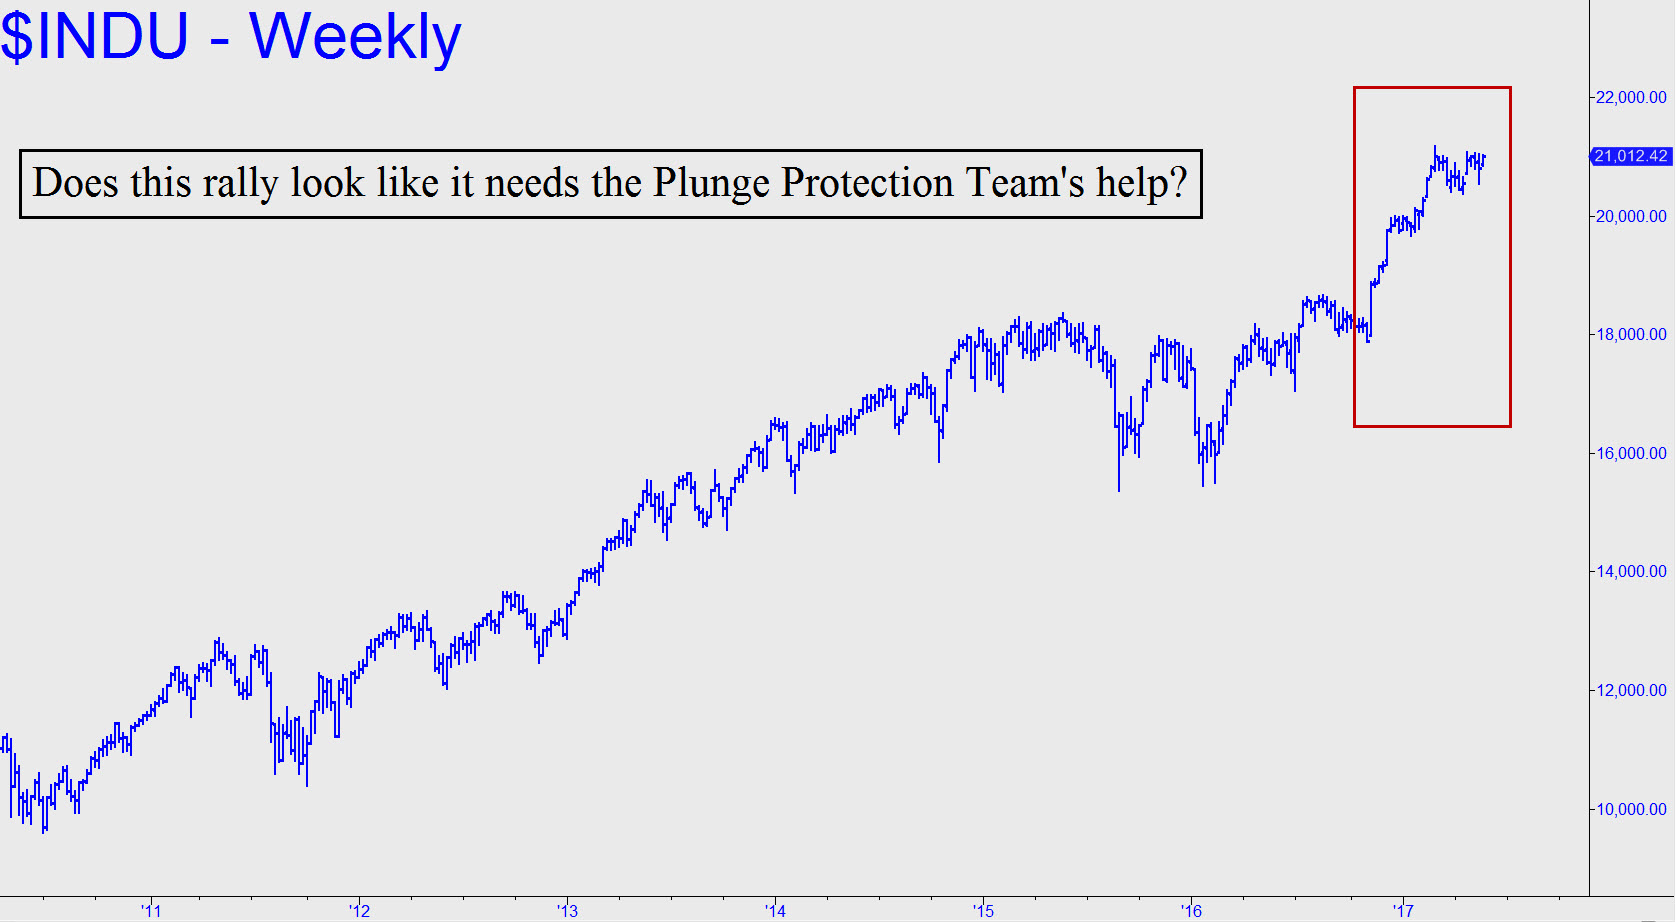
Zillionaire Asher Edelman was quoted on ZeroHedge the other day saying he has ‘no doubt’ that the Plunge Protection Team is behind the stock market’s steep rally since the election. With all due respect for Mr. Edelman and others who believe this, it is conspiracist poppycock. Yes, the Plunge Protection Team, which is officially known as the Working Group on Financial Markets, does exist, having been created under President Reagan. And I have no doubt that it will be pressed into action some day when the inevitable avalanche hits Wall Street. But the source of the stock market’s ongoing buoyancy at present is not the PPT, which has no reason to act unless there’s a crisis, but rather the unlimited sums of credit available at zero or near-zero interest rates to institutional investors and to companies that continuously buy back their own stock to artificially inflate earnings per share.
This dynamic is quite sufficient to keep stocks buoyant as long as the easy-money spigot remains open. Moreover, the bullish effect on stocks is powerfully augmented by short-covering, the most urgent source of buying — indeed, the only source of buying sufficiently powerful to push the broad averages through heavy layers of supply en route to new record highs. With that kind of boost the stock market hardly needs the Plunge Protection Team to keep the bull market going. Ultimately, however, and as anyone familiar with the history of the stock market could tell you, when the forces of nature usher in a bear market, as is inevitable, the PPT will be powerless to affect it, let alone stop it.
If you don’t subscribe but would like to join great traders from around the world in the chat room, click here for a free two-week trial subscription. You’ll also receive actionable trading ‘touts’ and invitations to frequent ‘impromptu’ sessions where Rick ‘takes requests’.

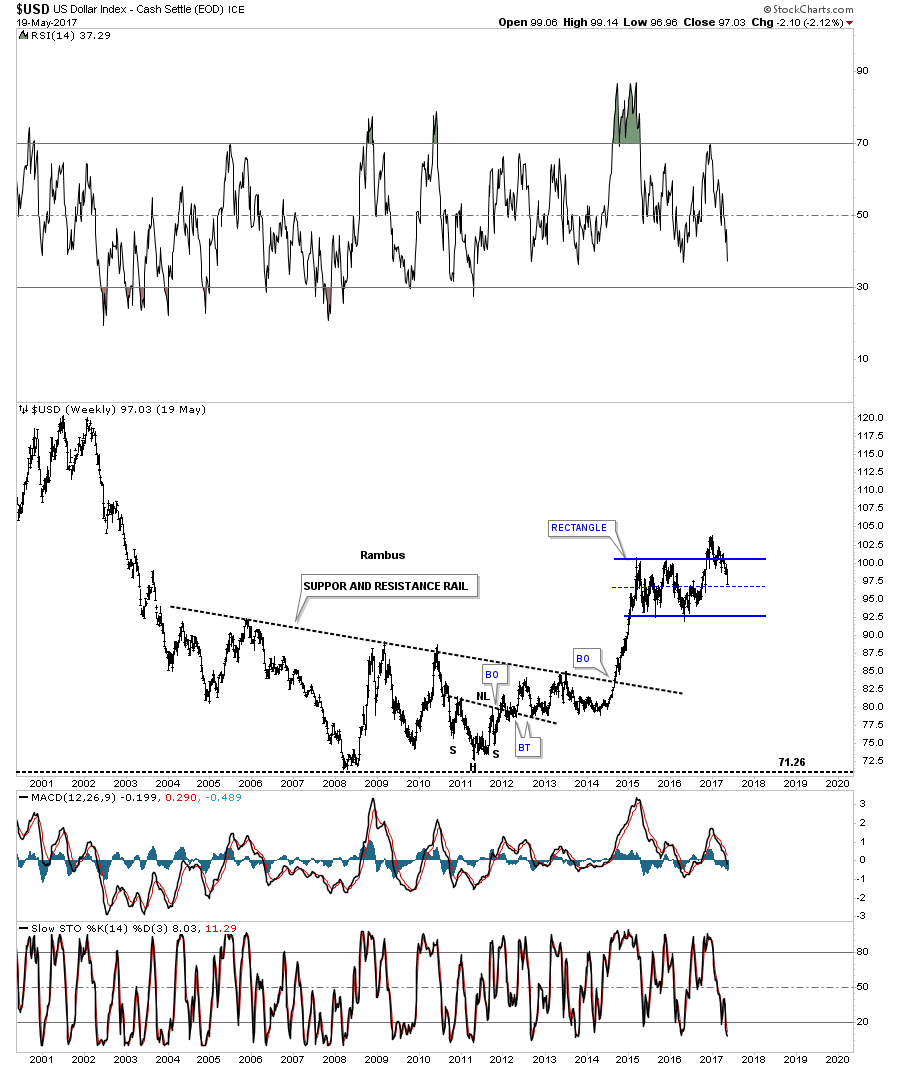
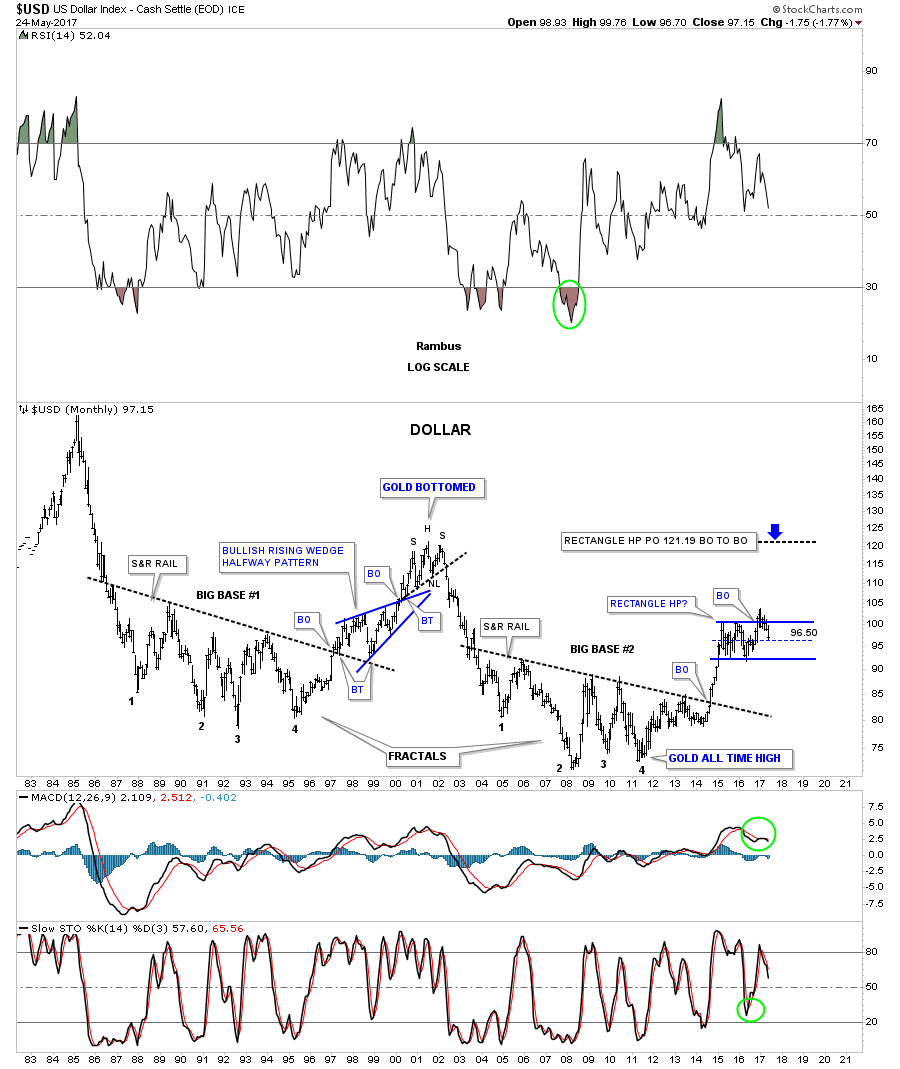
There is no doubt that the US dollar looks bad right now after breaking below the bottom rail of its 5 point falling wedge last week. Before I give up totally on the US dollar there is one thing I’m going to look for first. When all else fails I like to go back to the initial pattern which was a sideways trading range or a rectangle pattern. I’ve seen in the past that when you have a nice tight rectangle with a breakout above the top rail, there can be one very big shakeout move where the price action will decline back to the center mid dashed line, where final support may reside. If the dashed mid line fails to hold support then there are bigger problems. Below is a weekly chart for the US dollar which shows the price action testing the mid dashed center line.
The $US dollar daily line chart.
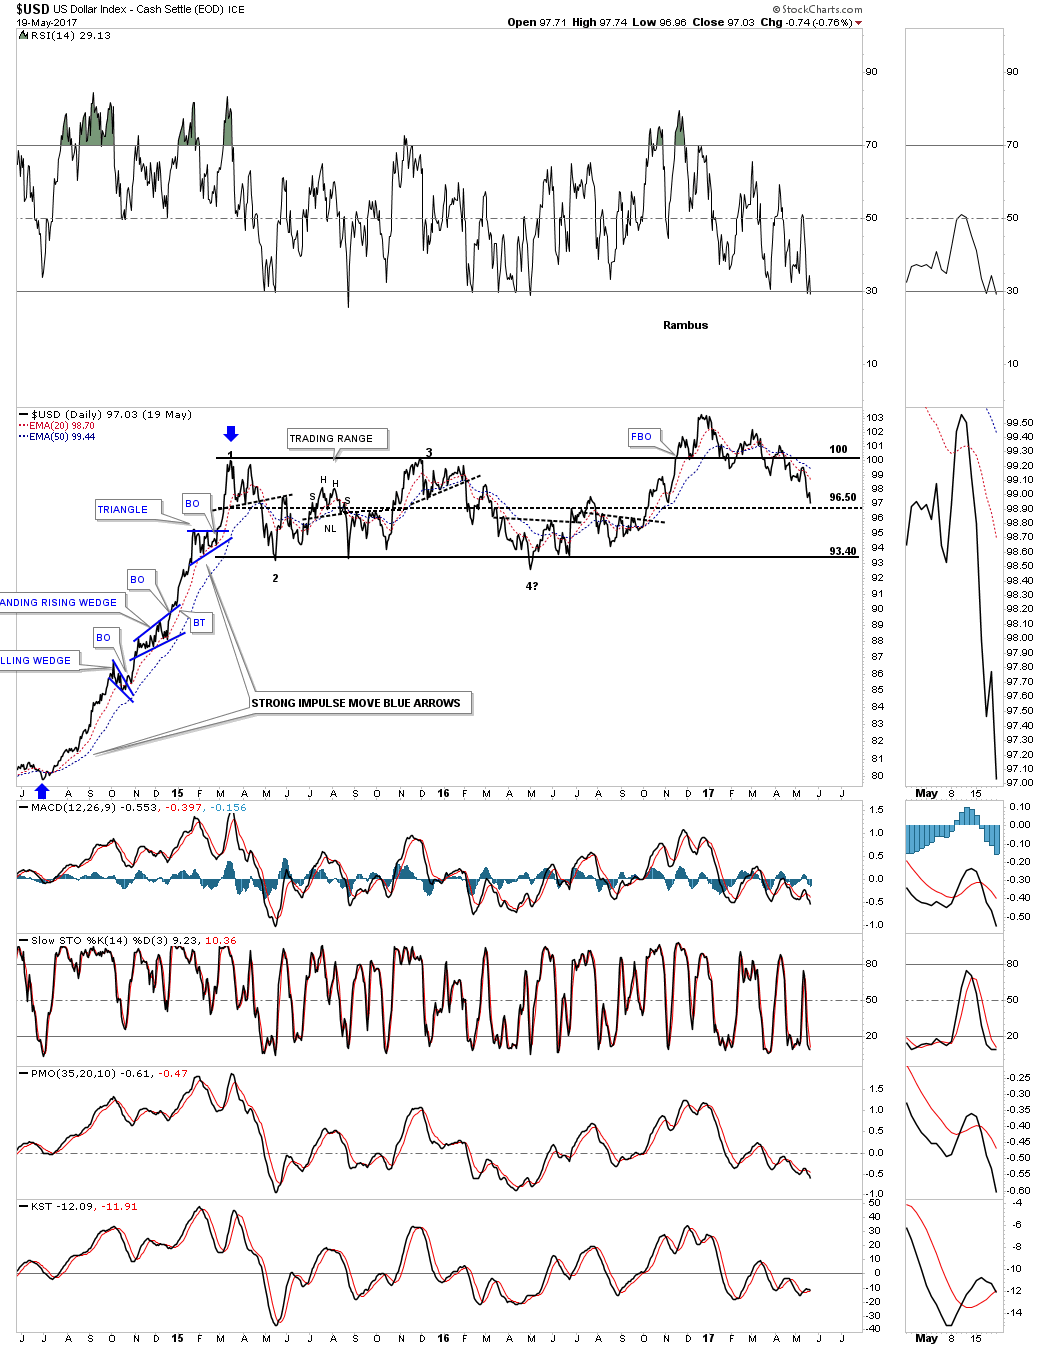
The daily chart below shows a potential downtrend channel with 2 blue consolidation patterns. If the blue bearish falling wedge is a halfway pattern to the downside the blue arrows shows a price objective down to the 96.20 area, which is labeled impulse move. The breakout to breakout price objective is a littler lower at 95.45. Those 2 price objectives come in pretty close to the mid dashed center line on the rectangle pattern above.

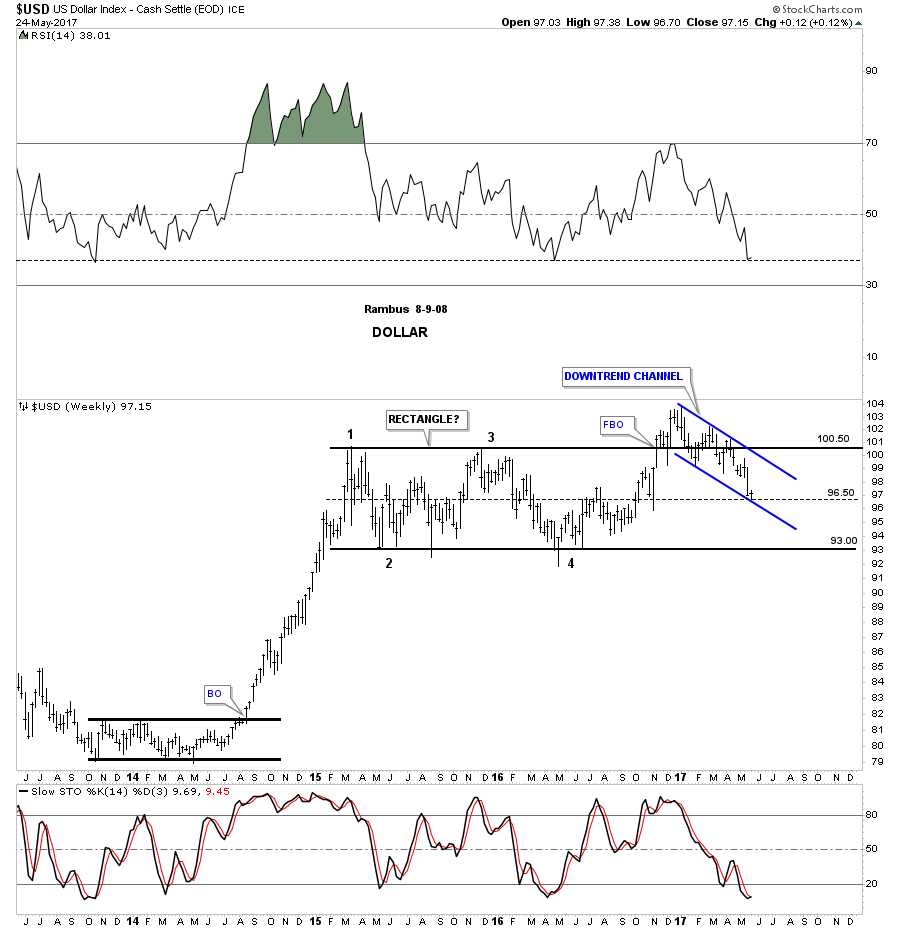
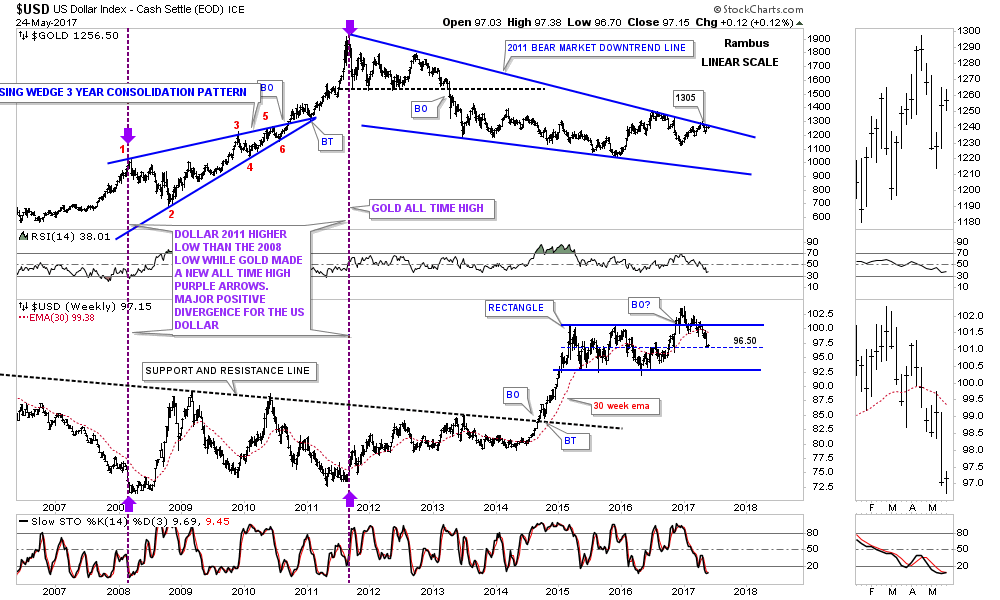
This weekly chart shows how the downtrend channel fits into the bigger horizontal trading range, which is now testing the dashed mid line. A break below the dashed mid line will most likely lead to a move down to the bottom of the rectangle.
The million dollar question remains, is the 2 year trading range a top or a consolidation pattern to the upside?
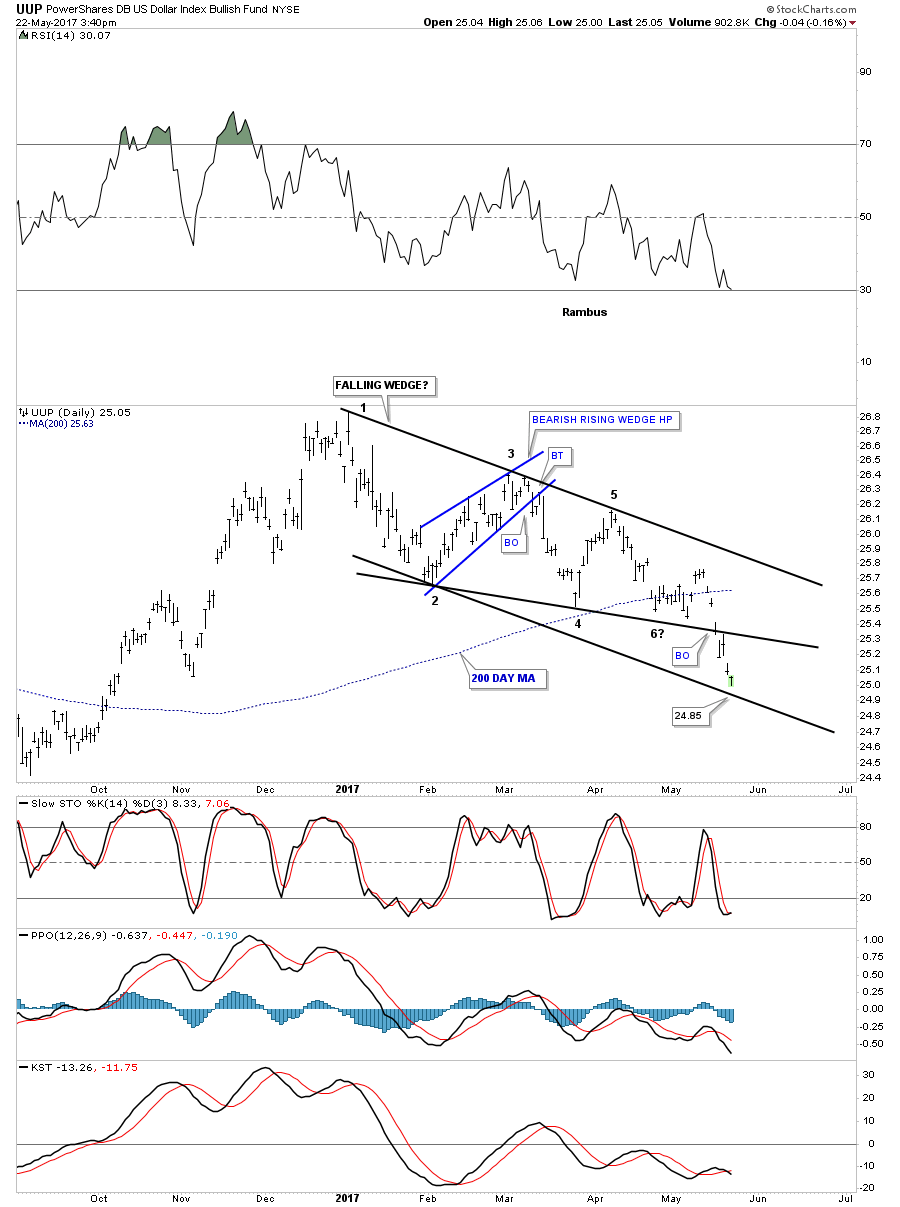
Below is a daily chart for the UUP which shows the original 5 point bearish falling wedge. I added a parallel bottom rail to the top rail which shows a possible bull flag if the bottom rail at the 24.85 area holds support.
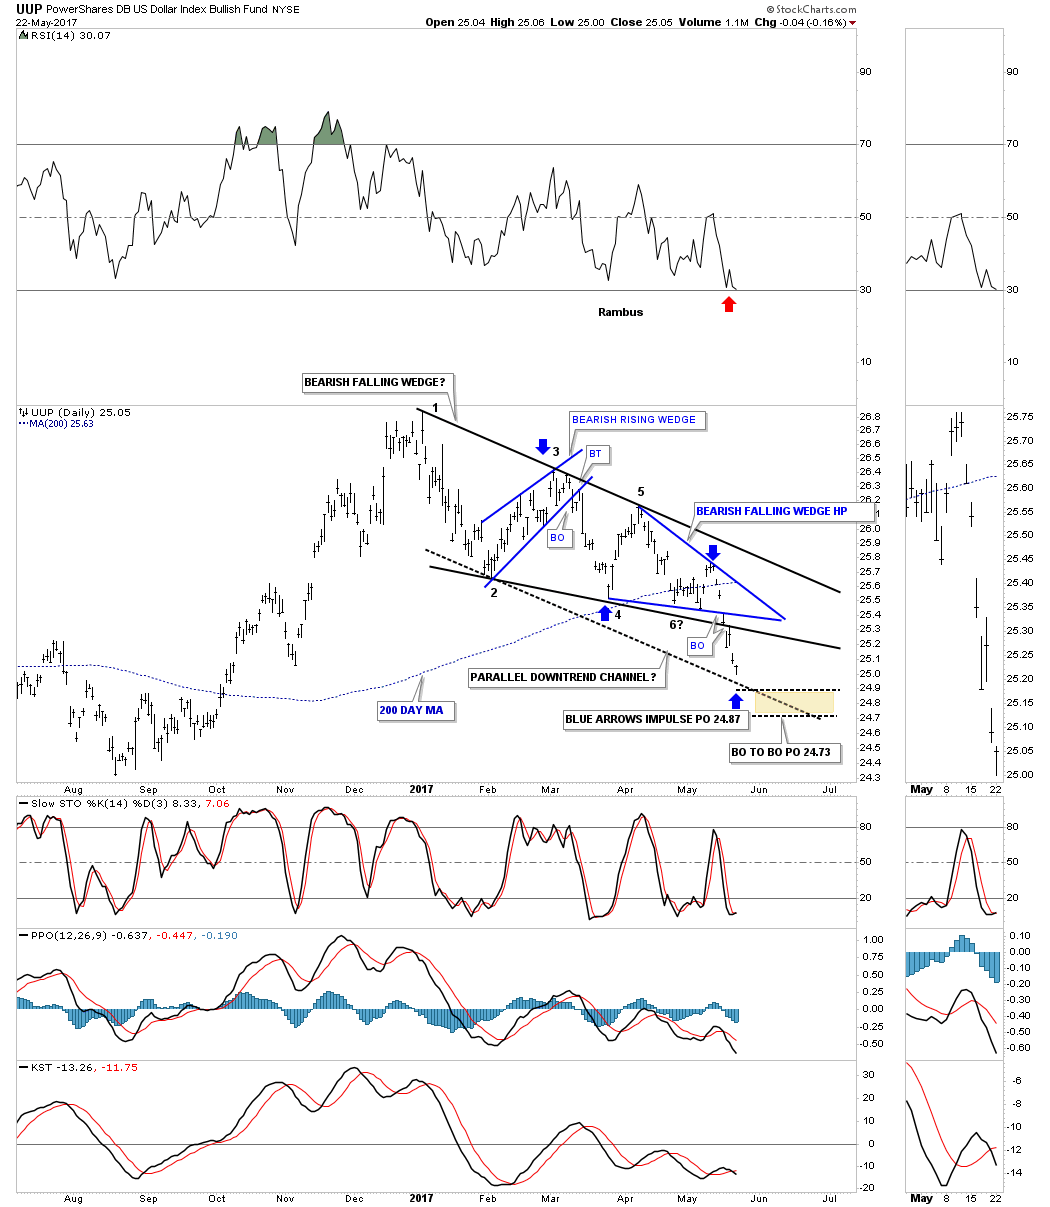
This next chart for the UUP is the same chart as the one above, but this one shows the 2 smaller blue consolidation patterns that make up the downtrend channel up to this point.. If the lower blue bearish falling wedge is a halfway pattern between the blue bearish rising wedge, the blue arrows show a price objective down to the 24.87 area. Likewise, if the blue bearish falling wedge is a halfway pattern the BO to BO price objective is down to the 24.73 area.
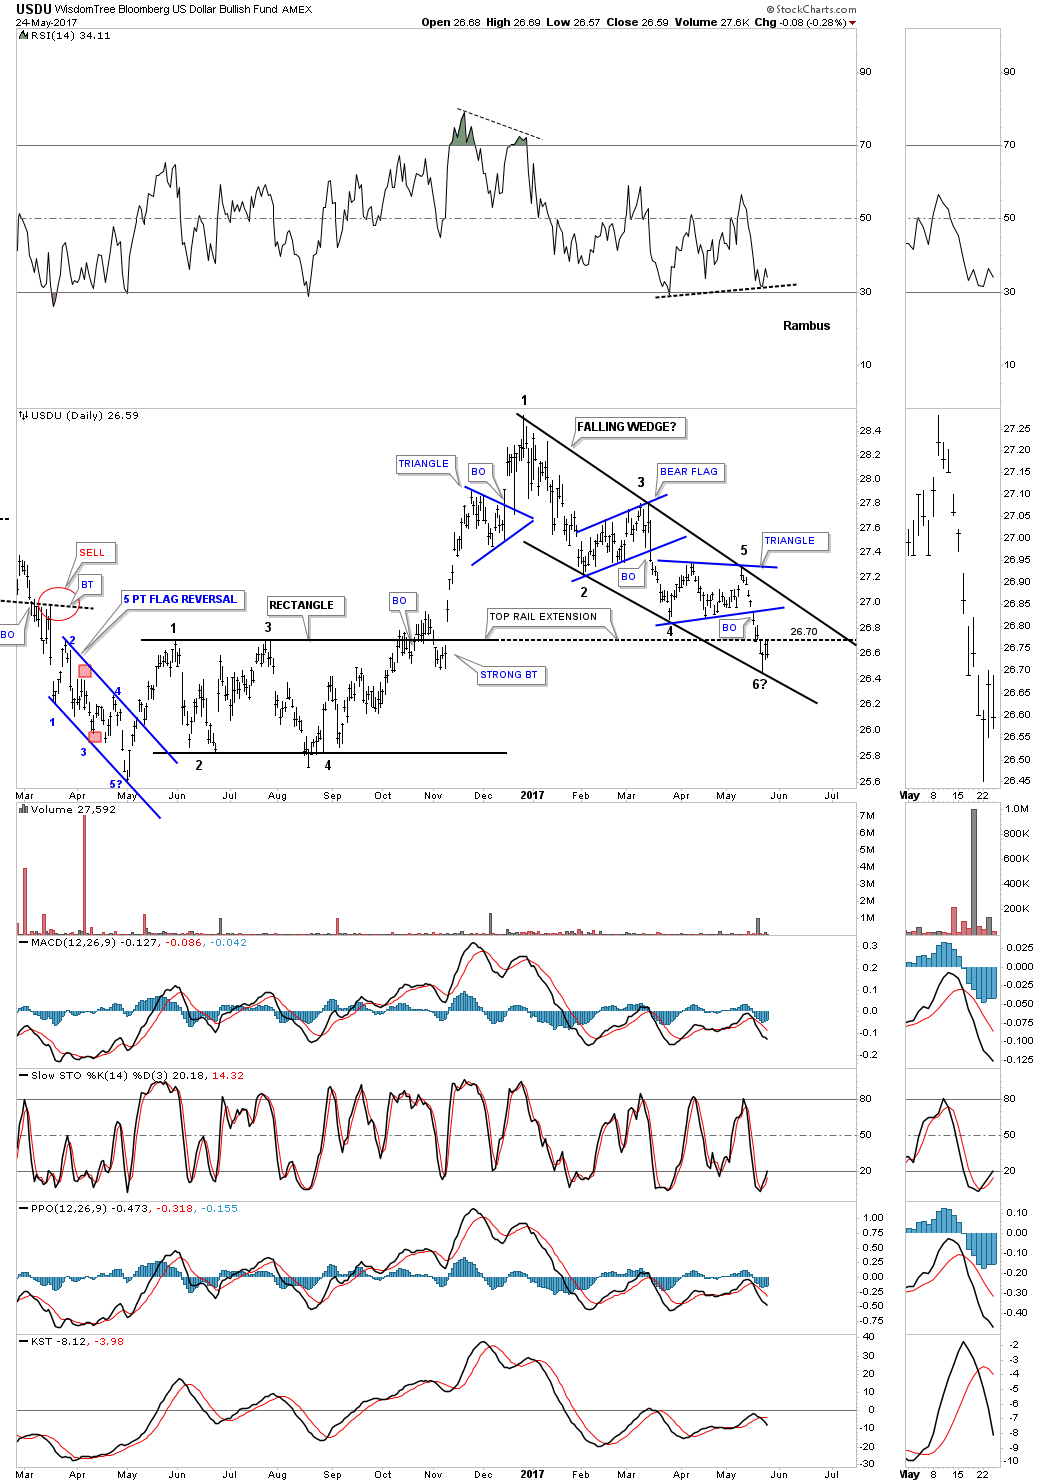
This next chart is a daily look at the USDU, Dollar Index, which has a more balanced makeup of currencies. Monday the price action hit the bottom rail of the falling wedge completing the 5th reversal point. If the falling wedge is going to be a bullish falling wedge, the USDU will have to start rallying and breakout above the top rail. Note the 4 point rectangle consolidation pattern that formed on the left side of the chart. From a Chartology perspective the top rail area should hold support when backtested from above, as shown by the top rail extension line which is now being strongly backtested.
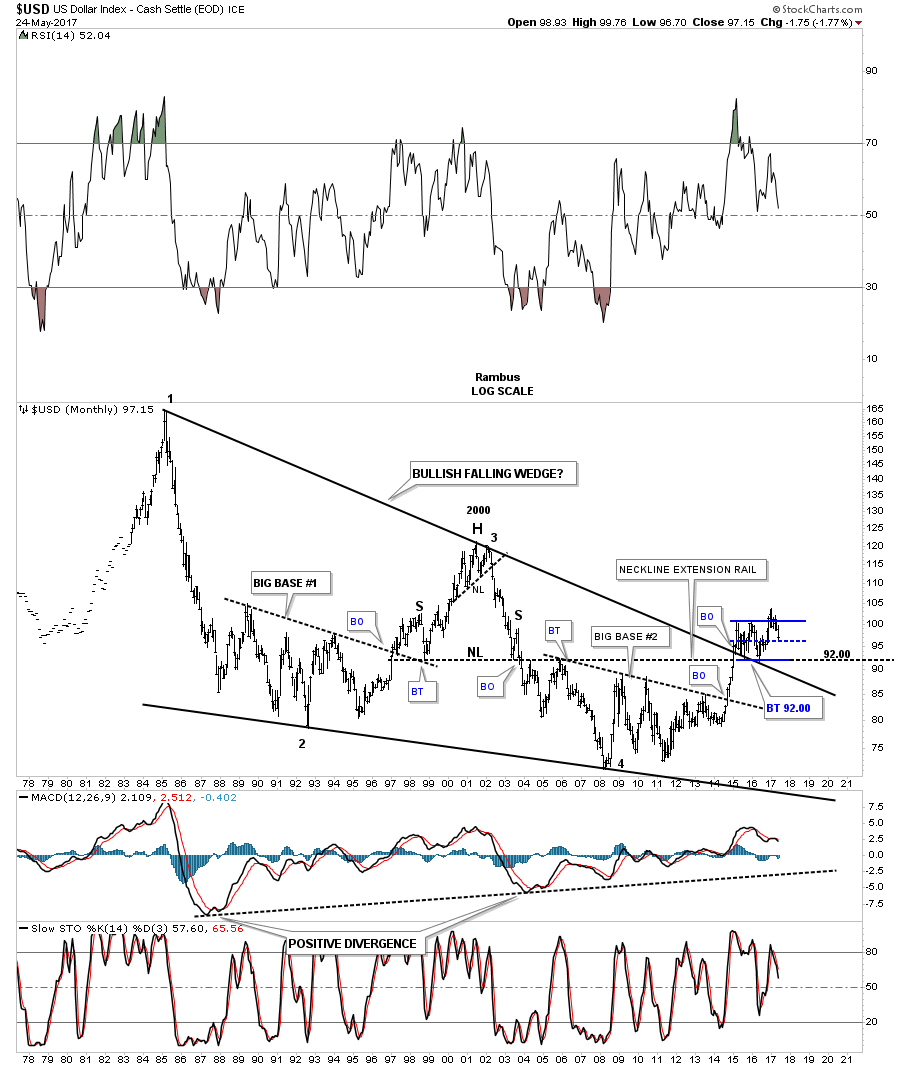
It’s been awhile since we last looked at this 40 year chart for the US dollar that shows a massive falling wedge with a breakout and 2 backtests to the top rail at 92 which is also the neckline extension line taken from the 2000 H&S top. From the 2011 low there still is a series of higher highs and higher lows in place. A break below 92 would change that.
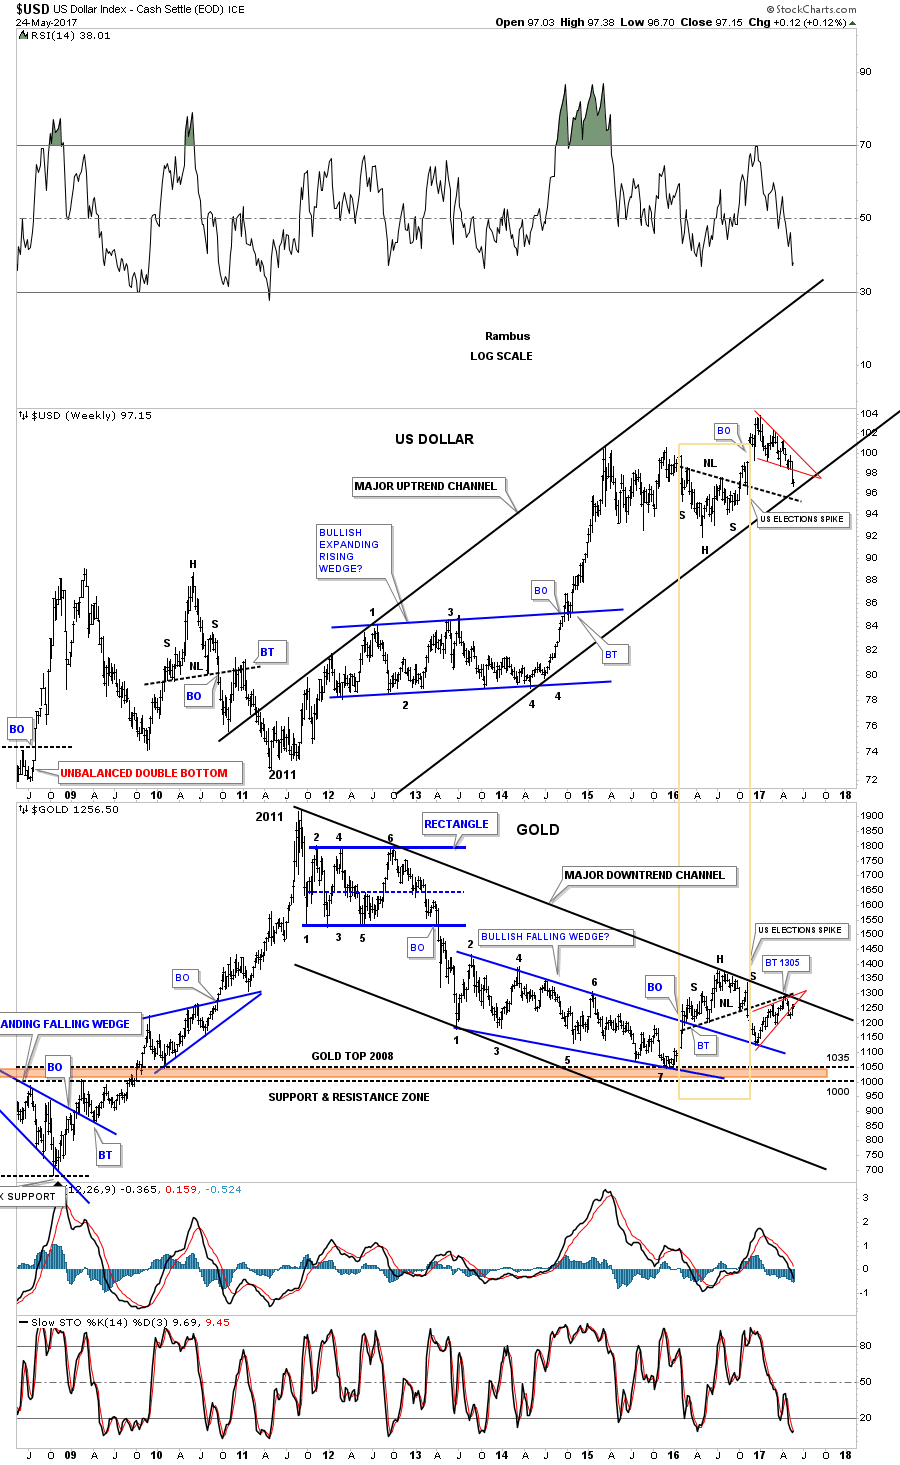
Below is a combo chart which has gold on top and the US dollar on the bottom. Six weeks ago gold hit the top rail at the 1300 area and backed off telling us that the top rail is hot. If the US dollar on the bottom chart can’t hold the 96 area, then there is a very good chance that gold will breakout above the top rail, possibly signaling the bear market is over. To say the 1300 area on gold is important is an understatement.
This next chart is another combo chart which has the US dollar on top and gold on the bottom which shows the inverse correlation these two generally have. The last time we looked at this chart the US dollar was still trading inside the red falling wedge and gold was still trading inside the red rising wedge. The only change I made was on the US dollar chart where I made the bottom rail of its uptrend channel parallel to the top rail. Gold was already in a parallel downtrend channel.
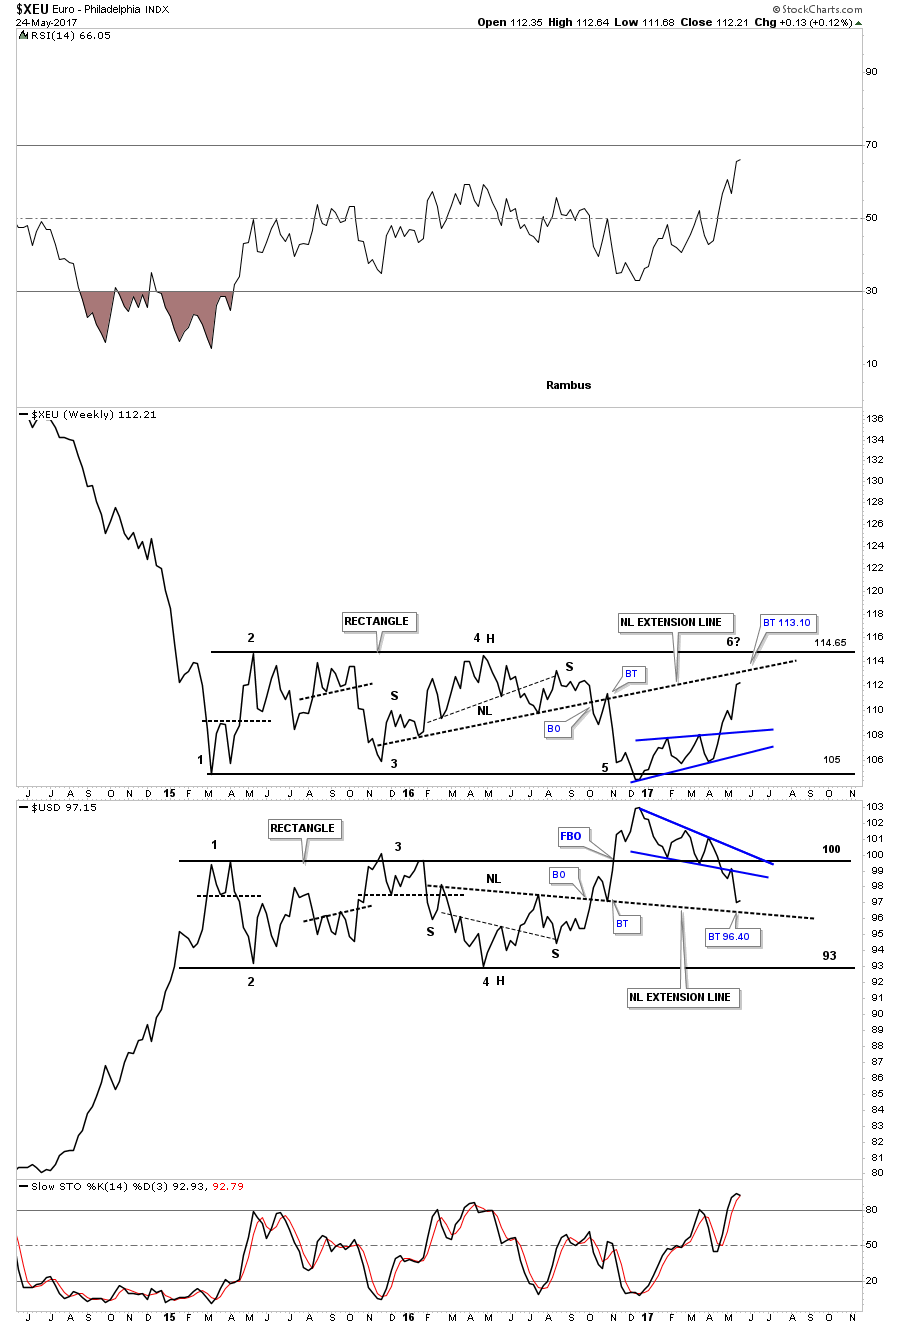
Below is a weekly line combo chart which has the $XEU on top and the US dollar on the bottom. As you can see the XEU on top is showing the blue bullish rising wedge while the US dollar is showing the blue bearish falling wedge. I’ve extended the necklines from the previous H&S patterns, labeled neckline extension line, which can be a place to look for a reversal to occur. The backtest to the neckline extension line on the XEU would come in around the 113.10 area while the neckline extension line on the US dollar would come in around the 96.40 area. Again, the million dollar question remains, is the XEU building out a consolidation pattern to the downside, and is the US dollar building out a consolidation pattern to the upside? Whichever direction these 2 year trading ranges breakout will have a big impact on many markets.
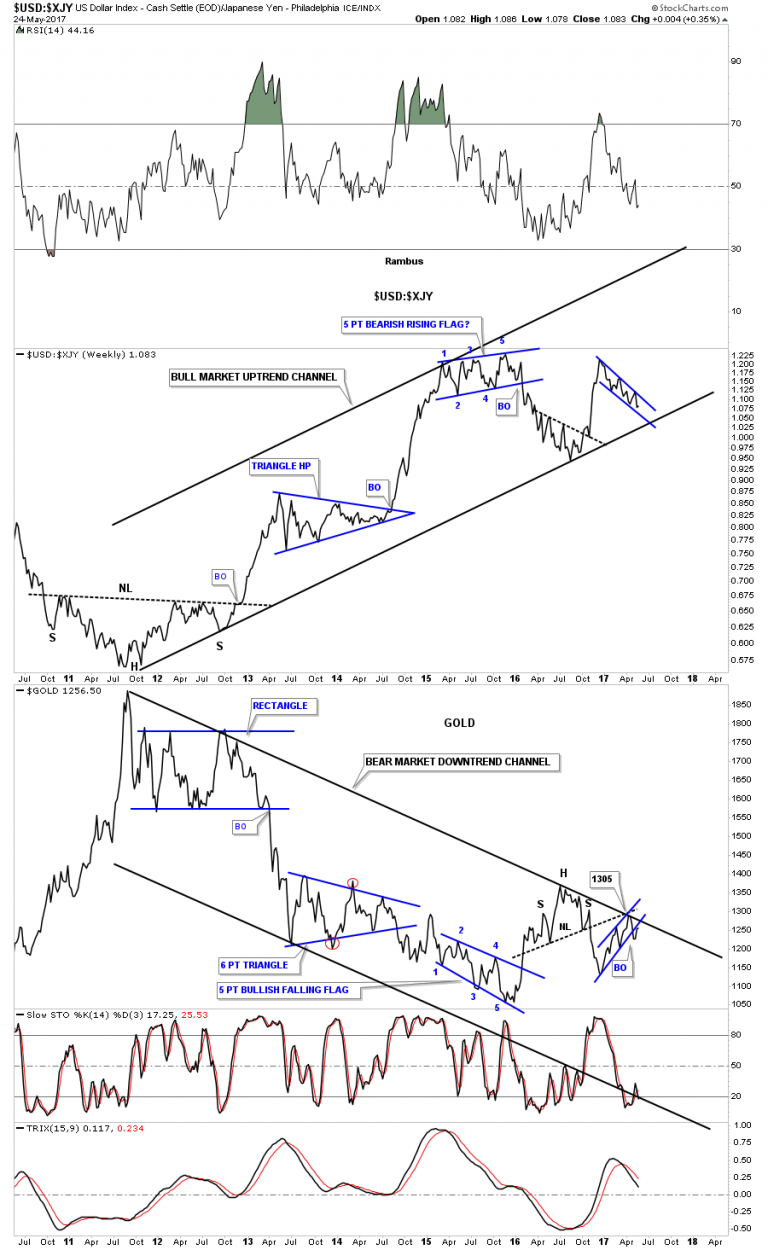
This last chart for tonight is a ratio combo chart which has the US dollar to the XJY on top, and gold on the bottom. Keep in mind we’ve been following these major trend channels since late last year before gold hit its top rail at 1305 and declined, so up to this point they have been following the script to a tee. The big question is, will they continue to follow the script to a tee? As you can see the ratio chart on top is building out a blue falling wedge while gold has built out a blue rising wedge.
It’s not everyday that you find charts like this at a very critical juncture which can change the major trend in a big way. Up to this point nothing is broken yet in regards to the big picture, but that could change in a heartbeat.
The Dollar is now at the currency equivalent of The Little Big Horn. Stay tuned.
All the best…Rambus
 https://rambus1.com/wp-content/uploads/2017/05/usd-xjy-184×300.png 184w, https://rambus1.com/wp-content/uploads/2017/05/usd-xjy-768×1250.png 768w, https://rambus1.com/wp-content/uploads/2017/05/usd-xjy.png 900w” sizes=”(max-width: 584px) 100vw, 584px”>

-
I know Mike is a very solid investor and respect his opinions very much. So if he says pay attention to this or that - I will.
~ Dale G.
-
I've started managing my own investments so view Michael's site as a one-stop shop from which to get information and perspectives.
~ Dave E.
-
Michael offers easy reading, honest, common sense information that anyone can use in a practical manner.
~ der_al.
-
A sane voice in a scrambled investment world.
~ Ed R.
Inside Edge Pro Contributors

Greg Weldon

Josef Schachter

Tyler Bollhorn

Ryan Irvine

Paul Beattie

Martin Straith

Patrick Ceresna

Mark Leibovit

James Thorne

Victor Adair