
Asset protection
When Nassim Nicholas Taleb looks at President Donald Trump, he doesn’t see “a trainwreck.” The real trainwreck, according to the trader turned author, is “unfettered globalization.” That’s the real danger that members of “the resistance” should be worried about, Taleb says during an interview with Bloomberg.
…for more written commentary go HERE or click image below:

…also from zerohedge:

There is a pattern forming on gold which wasn’t there yesterday. With yesterday’s big move up and no follow through to the upside today there is a potential H&S top building out. Many times I will use a neckline symmetry line which is taken from the neckline and moved up to the top of the left shoulder to show the possible high for the right shoulder. There is another technique I use where I will use a horizontal line from the top of the left shoulder that can sometimes show the height for the right shoulder. Today’s high at 1265 matches the high for the left shoulder. I’ve been showing the possible neckline as a S&R line, but now after yesterday’s move it’s looking more like a possible neckline. The breakout will come into play around the 1220 area which will confirm the H&S top.
Click twice on chart for largest version
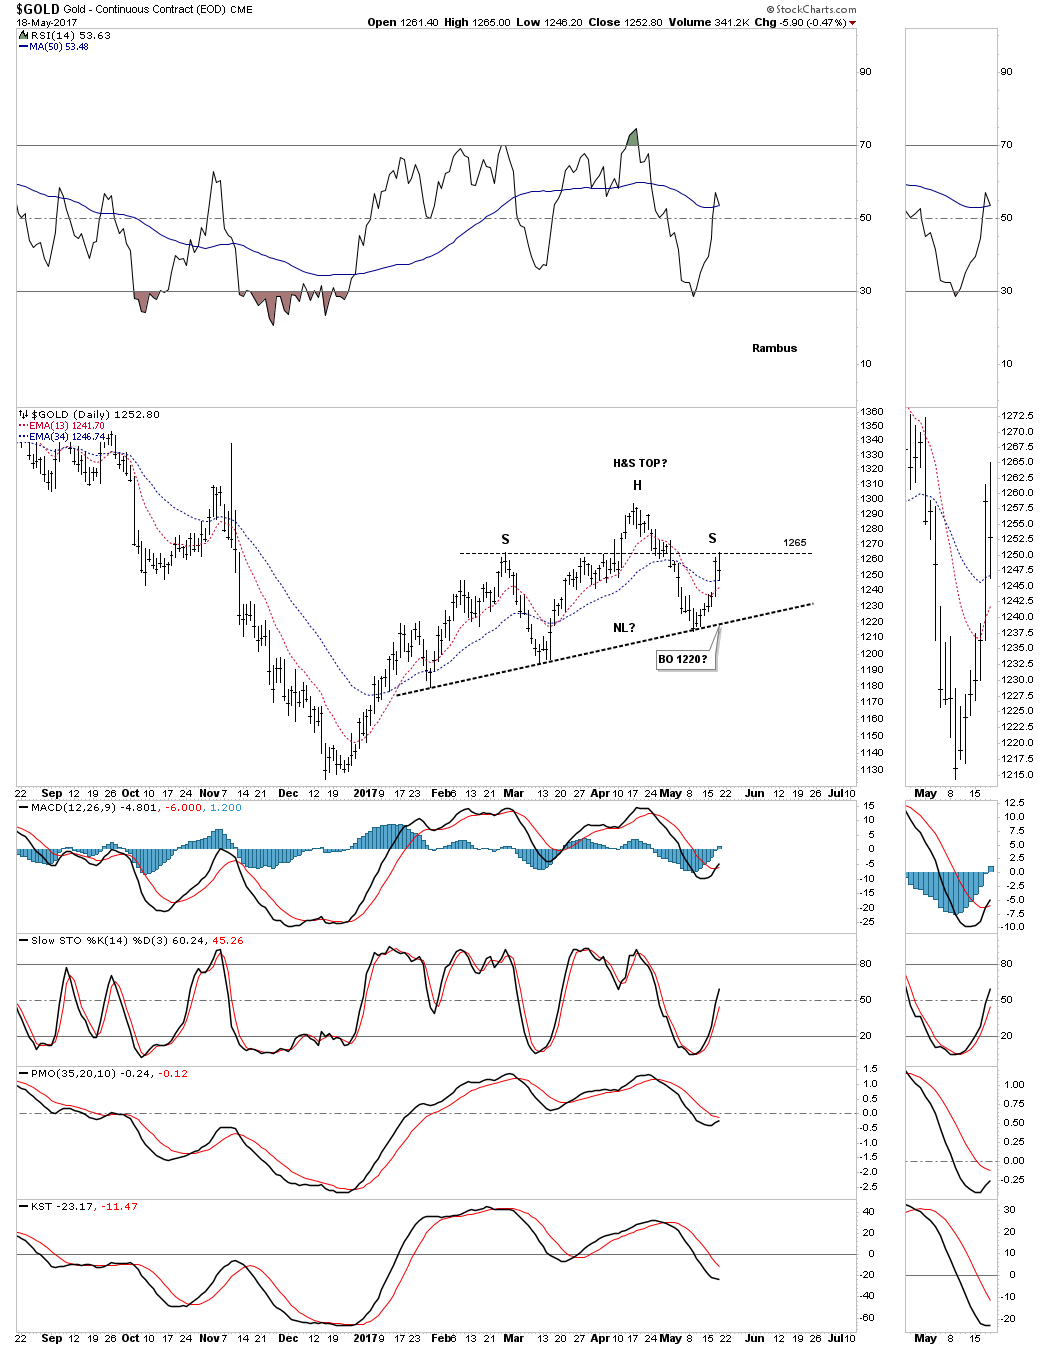
There is another technique I’ve shown you in the past that has to do with a wedge pattern. I’ve been showing you that gold has broken out of a bearish rising wedge with a breakout gap and a backtest today to the underside of the bottom rail. This technique I use shows how the left shoulder and head form inside the wedge and the backtest to the underside of the rising wedge forms the right shoulder. It ‘s still very early yet, but these two techniques show a strong possibility that gold may well be forming a H&S top.

Below is the PM combo chart which is showing yesterdays move may have been a strong backtest to the bottom rail of the triangle consolidation patterns as today’s price action closed below the bottom trendline. There were also several apex backtests which held resistance. Click twice on chart for largest version
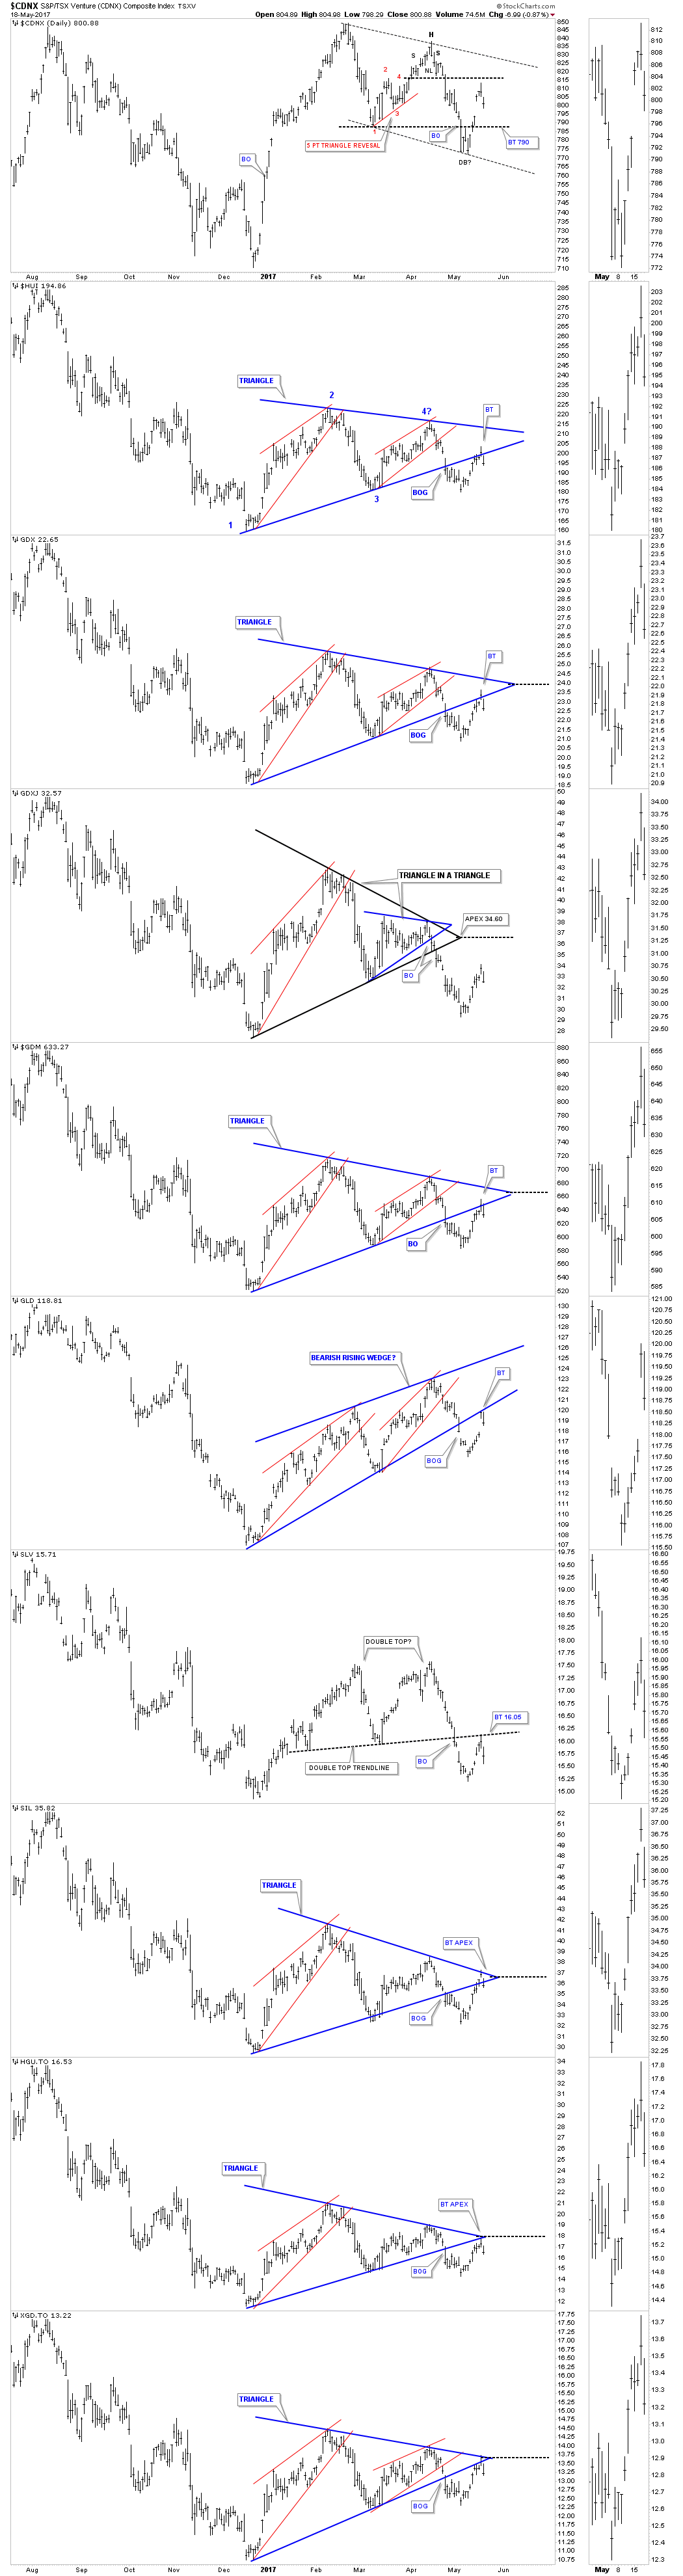
Yesterday I speculated on whether the gap opening was an exhaustion gap or a breakaway gap. With the price action trading back below the bottom rail of the triangle consolidation patterns it looks like we may have seen an exhaustion gap.
Based on that the possible exhaustion gap in play I’m going to jump back in and take an initial small position in the Kamikaze stocks. For most investors that’s almost an impossible thing to do, sell out one day and buy back in the next. Yesterday was called, shaking the bush day, to get the shorts to cover with what now looks like a strong backtest in place. Again this trade is not for everyone as the volatility is extreme in both directions. Only risk capital is used trading the Kamikaze stocks JNUG JDST DSLV and DGLD.
….also from Rambus:

Here at the Edelson Institute, we follow the war cycles very closely: Larry’s research shows that the cycles of war and conflict continue to ramp up. And that this escalation will not peak until the year 2020.
A huge part of the war cycles is cyber-warfare. And we are witnessing just the beginning.
Case-in-point: The lingering ransomware attack that began in Europe last Friday and continues hitting new targets in Japan and China this week.
The WannaCry software has locked thousands of computers in more than 150 countries. This ransomware attack, which hit 370,000 computers, stands far and away as the most severe malware attack so far in 2017.
The spread of this troubling ransomware is far from over. There are reports that link this attack to North Korea. If confirmed, it will add to the growing tensions between the U.S. and North Korea.
This is on top of other massive cyber-wars between countries, of which the Russian hacking of the U.S. elections is just the most recent in a firestorm of examples. We also see cyber-espionage by governments against each other and against their own people.
A disruptive cyber-attack on critical infrastructure in the United States (e.g., telecommunications, electrical power grids, gas and oil reserves, water supplies, financial institutions, and transportation and emergency services) would be extremely harmful … and costly.
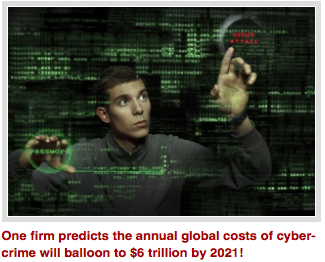 In fact, Cybersecurity Ventures – which tracks and analyzes trends in cyber-misconduct – predicts the annual global costs of cyber-crime will balloon from $3 trillion in 2015 to $6 trillion by 2021.
You read that right: $6 trillion by 2021!
The $6 trillion includes the damage and destruction of data, plus stolen money and lost productivity. And don’t forget about the theft of intellectual property, personal and financial data, embezzlement, fraud, and post-attack disruption to the normal course of business … all of which adds up to huge sums of money to restore and replace.
That’s a staggering list of damages and a heck of an outlay of cash.
Bur, frankly, I’m not one bit surprised.
As the war cycles ramp up, cash-strapped, over-indebted nations are going to be forced to spend more money than ever on national security. And cyber-protection is just part of that equation.
We will continue to see the spread of cyber-espionage and the outright loss of liberty and privacy. Cyber-crimes and cyber-warfare might become the greatest threat to every person, place, and thing in the world.
But, it’s not all doom-and-gloom. For a savvy investor, there are plenty of ways to protect and grow your investments. Here’s how to play it …
As cyber-attacks become more common, the need for protection against them will skyrocket, driving up demand for cyber-security software.
That’s why, right now, I have my eyes on a number of companies in the cyber-security space, including: FireEye Inc. (FEYE), Fortinet Inc. (FTNT), and Symantec Corp. (SYMC). And if you don’t want to bet on an individual company, you can always go with an ETF, like PureFunds ISE Cyber Security (HACK) or First Trust NASDAQ Cybersecurity (CIBR).
Best wishes,
David Dutkewych

3:00pm Pacific Thursday May 18, 2017
DOW + 56 on 50 net advances
NASDAQ COMP + 44 on 400 net advances
SHORT TERM TREND Bullish
INTERMEDIATE TERM Bullish
STOCKS: The market stabilized today after yesterday’s hissy fit and our best estimate is that we have seen a trading bottom.
That’s the way the market frequently acts. It gets overbought, investors buy every little dip and it won’t go down. Then finally a catalyst or some sort of unexpected news development takes it down hard and then it’s already oversold.
GOLD: Gold was down $5. Profit taking with a little help from a rebounding dollar.
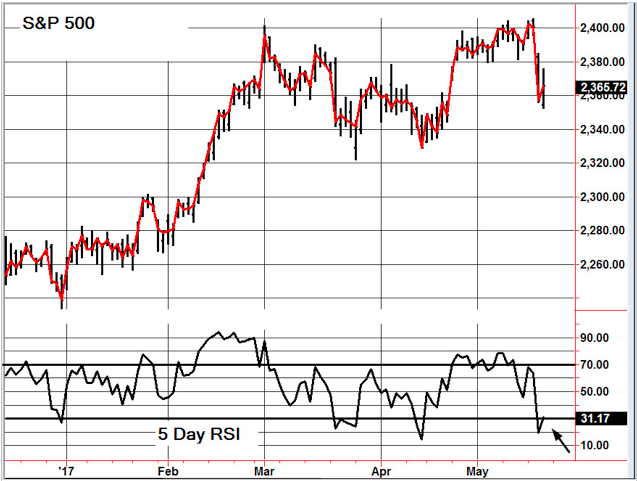
CHART The S&P 500 is just bouncing off an oversold 5 Day RSI (arrow). When this happens we normally have a few days on the upside.
BOTTOM LINE: (Trading)
Our intermediate term system is on a buy.
System 7 We are long the SSO from 86.27. Let’s put a stop in at 84.27 and remain long through Friday.
System 8 We are in cash. Stay there.
System 9 We are in cash. Stay there.
NEWS AND FUNDAMENTALS: Jobless claims were 232,000, less than the expected 240,000. The Philadelphia Fed Business Outlook Survey came in at 38.8, better than the expected 19.6. There are no important releases on Friday.
INTERESTING STUFF Wise men speak because they have something to say; Fools because they have to say something.— Plato
TORONTO EXCHANGE: Toronto stabilized, gaining 4.
BONDS: Bonds were flat.
THE REST: The dollar had a decent rebound. Crude oil managed a small rise.
Bonds –Bullish as of May 12.
U.S. Dollar -Bearish as of May 4.
Euro — Bullish as of May 4.
Gold —-Bullish as of May 12.
Silver—- Bullish as of May 12.
Crude oil —- Bullish as of May 5.
Toronto Stock Exchange—- Bullish from January 22, 2016
We are on a long term buy signal for the markets of the U.S., Canada, Britain, Germany and France – www.toddmarketforecast.com
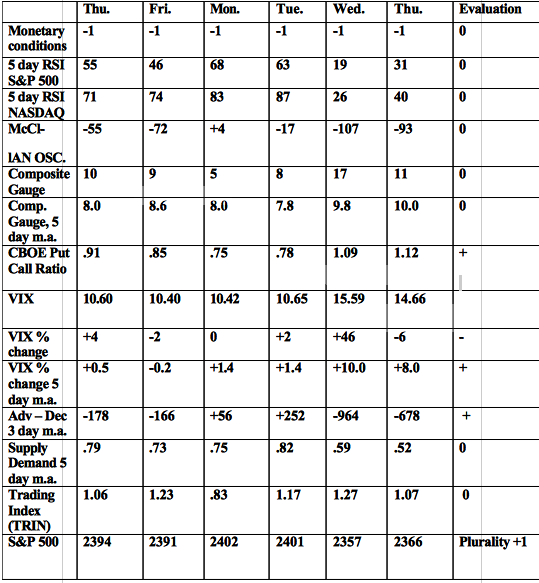
Monetary conditions (+2 means the Fed is actively dropping rates; +1 means a bias toward easing. 0 means neutral, -1 means a bias toward tightening, -2 means actively raising rates). RSI (30 or below is oversold, 80 or above is overbought). McClellan Oscillator ( minus 100 is oversold. Plus 100 is overbought). Composite Gauge (5 or below is negative, 13 or above is positive). Composite Gauge five day m.a. (8.0 or below is overbought. 13.0 or above is oversold). CBOE Put Call Ratio ( .80 or below is a negative. 1.00 or above is a positive). Volatility Index, VIX (low teens bearish, high twenties bullish), VIX % single day change. + 5 or greater bullish. -5 or less, bearish. VIX % change 5 day m.a. +3.0 or above bullish, -3.0 or below, bearish. Advances minus declines three day m.a.( +500 is bearish. – 500 is bullish). Supply Demand 5 day m.a. (.45 or below is a positive. .80 or above is a negative). Trading Index (TRIN) 1.40 or above bullish. No level for bearish.
No guarantees are made. Traders can and do lose money. The publisher may take positions in recommended securities.

Marc Faber sees the risk of an Economic collapse and financial crisis rising and it could occur at any moment. Getting informed about a collapse and crisis may earn you a lot, or at least prevent you from losing money. Interview May 15th/2017
….also from Marc: Marc Faber: The Markets to Crash within 12 Months


-
I know Mike is a very solid investor and respect his opinions very much. So if he says pay attention to this or that - I will.
~ Dale G.
-
I've started managing my own investments so view Michael's site as a one-stop shop from which to get information and perspectives.
~ Dave E.
-
Michael offers easy reading, honest, common sense information that anyone can use in a practical manner.
~ der_al.
-
A sane voice in a scrambled investment world.
~ Ed R.
Inside Edge Pro Contributors

Greg Weldon

Josef Schachter

Tyler Bollhorn

Ryan Irvine

Paul Beattie

Martin Straith

Patrick Ceresna

Mark Leibovit

James Thorne

Victor Adair