
Gold & Precious Metals
Silver prices are rising along the bottom of a 20 year log scale trend channel (shown later). There are no guarantees in a manipulated paper market, such as COMEX silver, but it is possible that silver prices will collapse further, or more likely, move substantially higher, sooner rather than later.Silver prices COULDfall from their current level of $16 – $17 to under $10. Other events that COULD occur include:
You could win the Powerball Lottery.
The U.S. congress could balance the budget and reduce debt.
The Federal Reserve could apologize for destroying the dollar.
President Putin and Hillary could sing “Kumbaya” together.
The Middle-East could ascend into a century of peace.
And it is possible that silver prices could drop under $10.
But realistically, we know:
- The Federal Reserve has devalued the dollar for over a century and is openly advocating for at least 2% inflation – more devaluation. Expect continuing declines in the purchasing power of the dollar.
- The U.S. congress, the President, the military, thousands of military contractors, the medical/health/sick care system, and millions of people collecting Social Security do NOT want spending decreased. Expect more spending, deficits, ever-increasing debt, and of course, more consumer price inflation. Silver prices will rise.
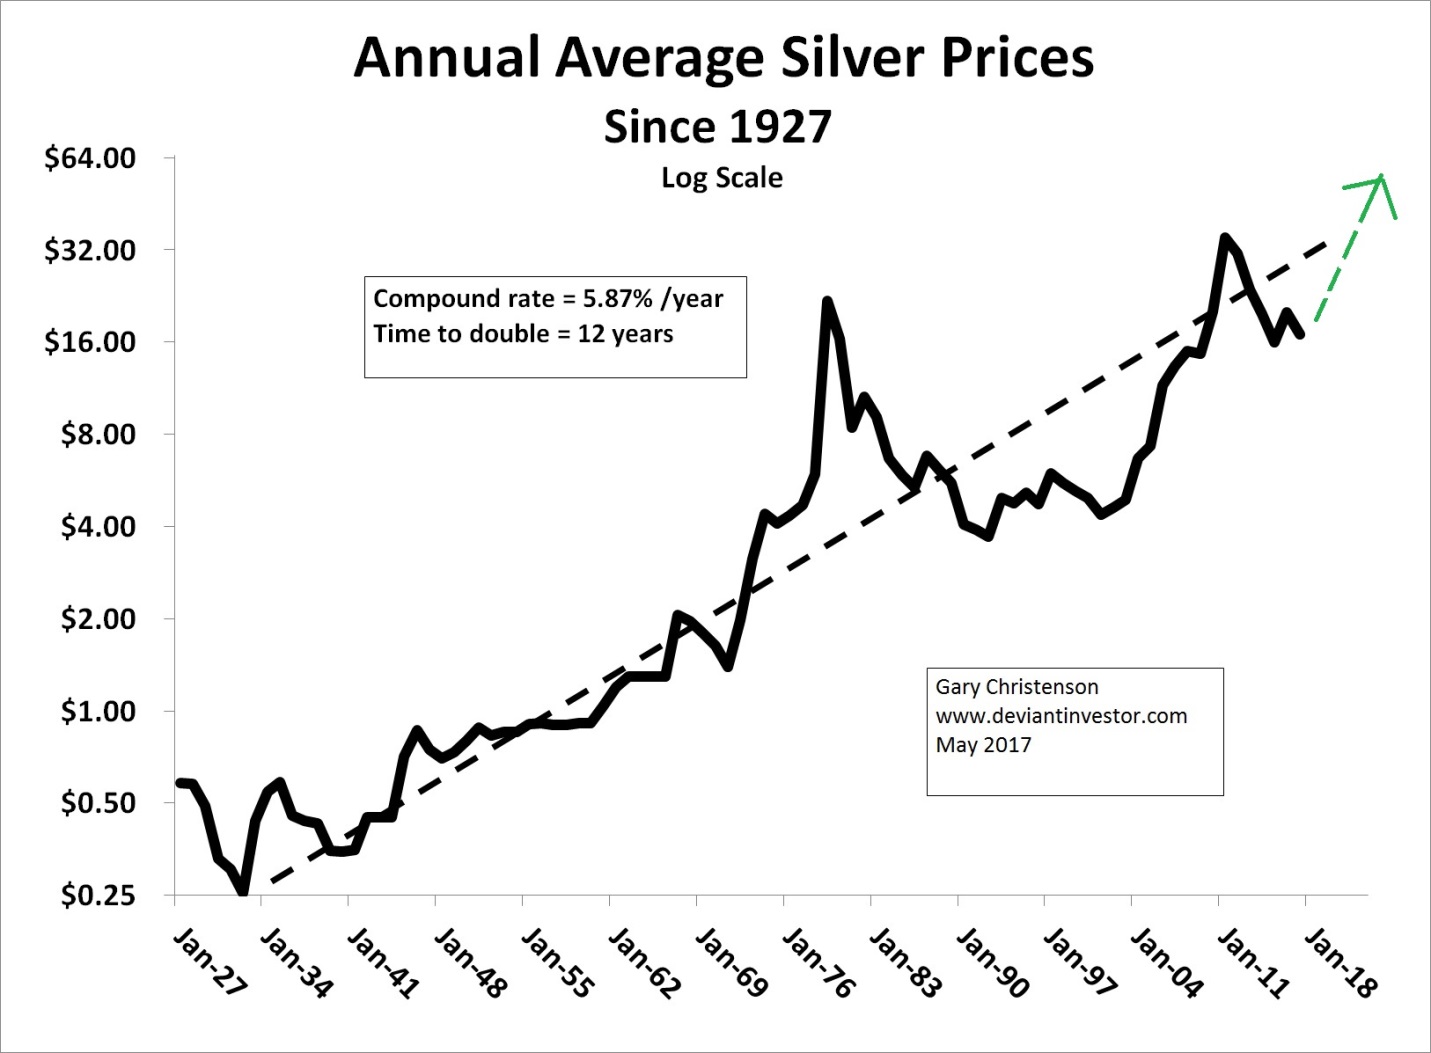
- Silver prices have risen exponentially for the past 90 years as the dollar has been consistently devalued. Expect continued silver price rises. See log scale graph below.
SILVER TO GOLD RATIO:
Examine the silver to gold ratio for the past 27 years. Low silver to gold ratios indicate long-term buy zones for silver. Silver prices are there now.

How High Will Silver Prices Rise?
The answer depends upon many variables. A partial list includes:
- COMEX silver prices are “managed” by large players, including JPM, which previously have wanted silver prices to remain low. That may be changing. Read Ted Butler.
- How rapidly will the Fed and commercial banking increase the supply of dollars and how much will they devalue the dollar?
- How extreme will our political circus become? Distractions will be necessary. The usual response is war after a suitable scapegoat has been identified.
- “False Flag” operations may direct blame and attention away from policy failures and toward some “common enemy.” Wars increase silver prices.
- When will U.S. citizens lose confidence in the dollar?
- How rapidly will foreign countries including China, Russia and Saudi Arabia redirect commerce away from the dollar?
- Hyper-inflation or 1970s style inflation?
- Rise of the IMF and Special Drawing Rights as a global currency?
SUMMARY:
Silver prices for the next decade are dependent upon many unknowns. However, a conservative chart interpretation is shown below.

The log trend channel has contained most silver prices for the past 20 years. A “more of the same” financial world suggests silver prices will rise toward $100 in the next 5 – 7 years.
A more aggressive chart interpretation shows prices for silver peaks rising rapidly during the past 17 years.

A blow-off rally in silver – quite possible – suggests silver prices rallying toward $200 – $300 per ounce. For comparison, Bitcoin was $3 a few years ago and recently exceeded $1,700. Amazon stock sold for about a buck 20 years ago. Today it is near $1,000. Silver near $200 is not impossible in a few years.
CONCLUSIONS:
- Silver prices have risen exponentially for 90 years as the dollar has been devalued. Expect further devaluation and higher silver prices.
- There are many financial and political catalysts that could propel silver prices well over $100.
- A conservative graphical interpretation shows $100 silver within a few years.
- A “blow-off” graphical interpretation shows $200 – $300 silver is possible in a few years.
- If the powers-that-be create or can’t stop hyper-inflation of the dollar, $500 silver will look inexpensive by the end of next decade.
- It is difficult to look beyond our “normalcy bias” and consider the possibility that the DOW could drop more than 50%, like it did in the 2008 crisis, or silver could increase in price by over a factor of 30, like it did from 1971 – 1980.
Read Steve St. Angelo: Amazing Leverage in Silver Market.
Read “Silver and Gold Find Support.”
The “silver train” has not left the station … yet.
Gary Christenson
The Deviant Investor

Legendary Short Seller Warns Stock Markets Will Accelerate To The Downside, But Gold Will See Buying
 The stock market actually cared about a bit of negative news for once, at least early on, as the indices fell by about 1% thanks to the current edition of the Trump Travails…
I have said before many times, and again recently, that when a mania is in force basically nothing can stop it, but after it is exhausted almost anything can take it down.
…..also from KingWorldNews:

Stock Trading Alert originally sent to subscribers on May 18, 2017, 6:55 AM.
Briefly: In our opinion, speculative short positions are favored (with stop-loss at 2,410, and profit target at 2,200, S&P 500 index).
Our intraday outlook is bearish, and our short-term outlook is bearish. Our medium-term outlook remains neutral, following S&P 500 index breakout above last year’s all-time high:
Intraday outlook (next 24 hours): bearish
Short-term outlook (next 1-2 weeks): bearish
Medium-term outlook (next 1-3 months): neutral
Long-term outlook (next year): neutral
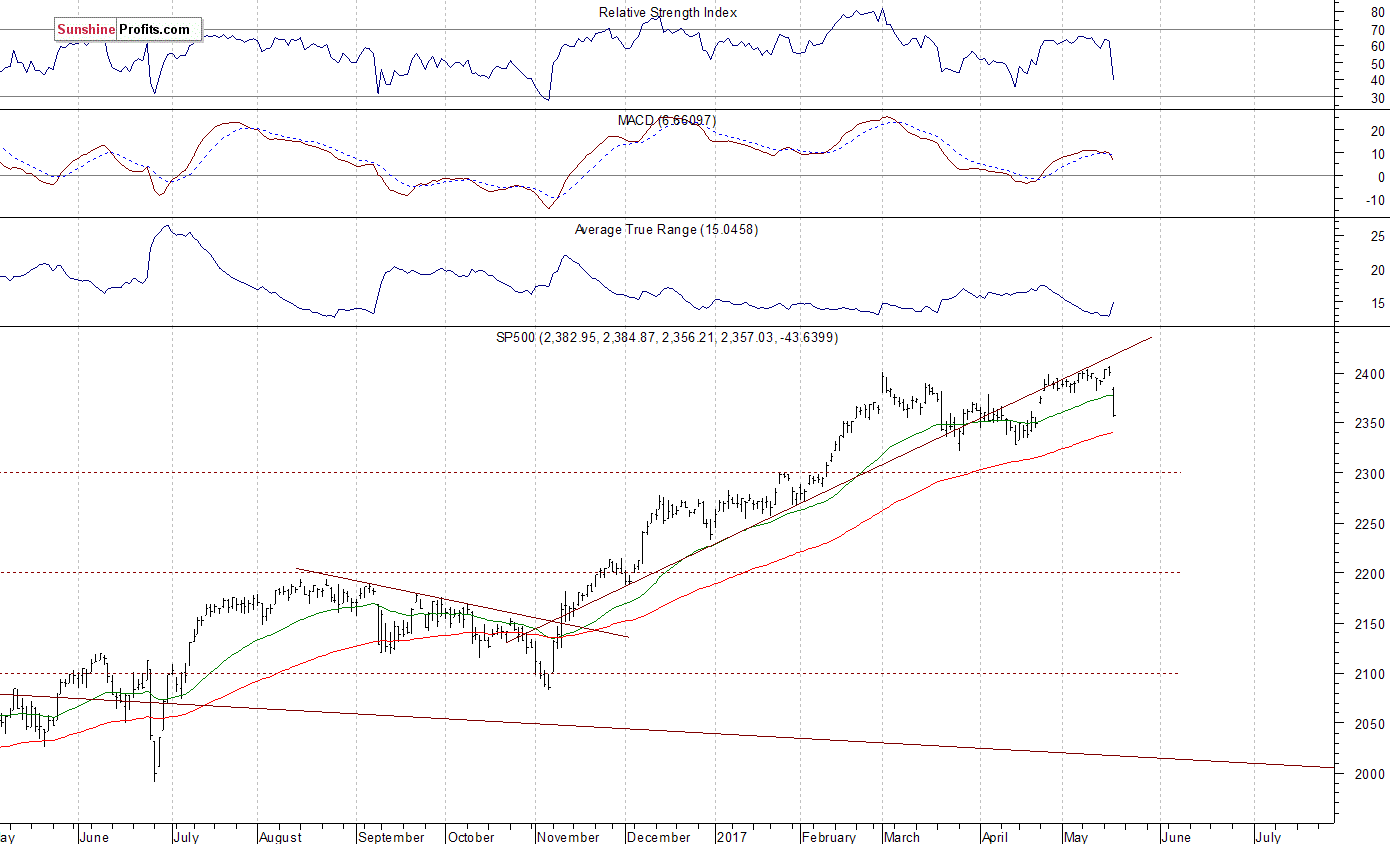
The U.S. stock market indexes lost 1.8-2.6% on Wednesday, breaking below their recent short-term consolidation, as investors reacted to U.S. politics news, among others. The S&P 500 index has reached new record high of 2,405.77 on Tuesday. However, it failed to continue the uptrend and sold off yesterday, following a gap down opening of the trading session. The Dow Jones Industrial Average got closer to level of 20,600 again, and the technology Nasdaq Composite index fell the most (-2.6%), as it got closer to 6,000 mark. The nearest important level of support of the S&P 500 index is now at 2,350-2.355, marked by late April daily gap up, among others. The next level of support is at 2,320-2,330, marked by previous local lows. On the other hand, resistance level is now at around 2,370, marked by previous level of support. The next resistance level is at 2,385-2,395, marked by yesterday’s daily gap down of 2,384.87-2,396.05. The resistance level is also at 2,400-2,405, marked by the above-mentioned new record high. Is this a topping pattern before medium-term downward reversal? The uptrend accelerated on March 1 and it looked like a blow-off top pattern accompanied by some buying frenzy. The S&P 500 index trades below its medium-term upward trend line, as we can see on the daily chart:
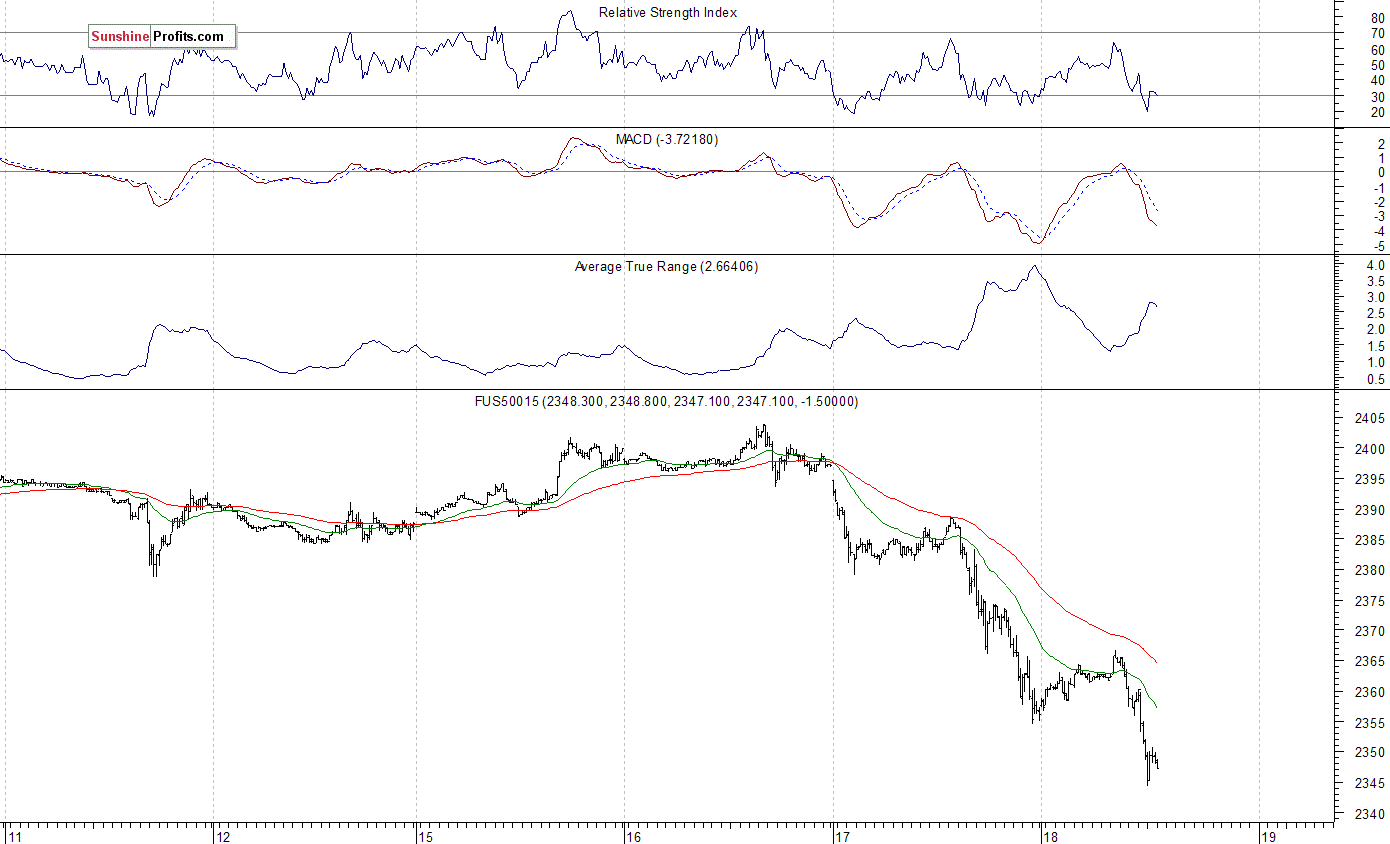
Expectations before the opening of today’s trading session are negative, with index futures currently down 0.3-0.5%, as investors’ sentiment remains bearish after yesterday’s move down. The European stock market indexes have lost 0.9-1.4% so far. Investors will now wait for some economic data announcements: Initial Claims, Philadelphia Fed number at 8:30 a.m., Leading Indicators at 10:00 a.m. The market expects that the Philadelphia Fed number was at 18.5 in May, and the Initial Claims were at 240,000 last week. The S&P 500 futures contract trades within an intraday downtrend, as it extends its yesterday’s sell-off. The nearest important level of resistance is at around 2,360-2,370, marked by an overnight consolidation. The next level of resistance is at 2,380-2,385, marked by short-term local highs. On the other hand, support level is at around 2,340, and the next support level is at 2,300-2,320, marked by some previous fluctuations. There have been no confirmed positive signals so far. But will the market continue its short-term downtrend? Or is this just a move down within an over two-month-long consolidation along new record highs?
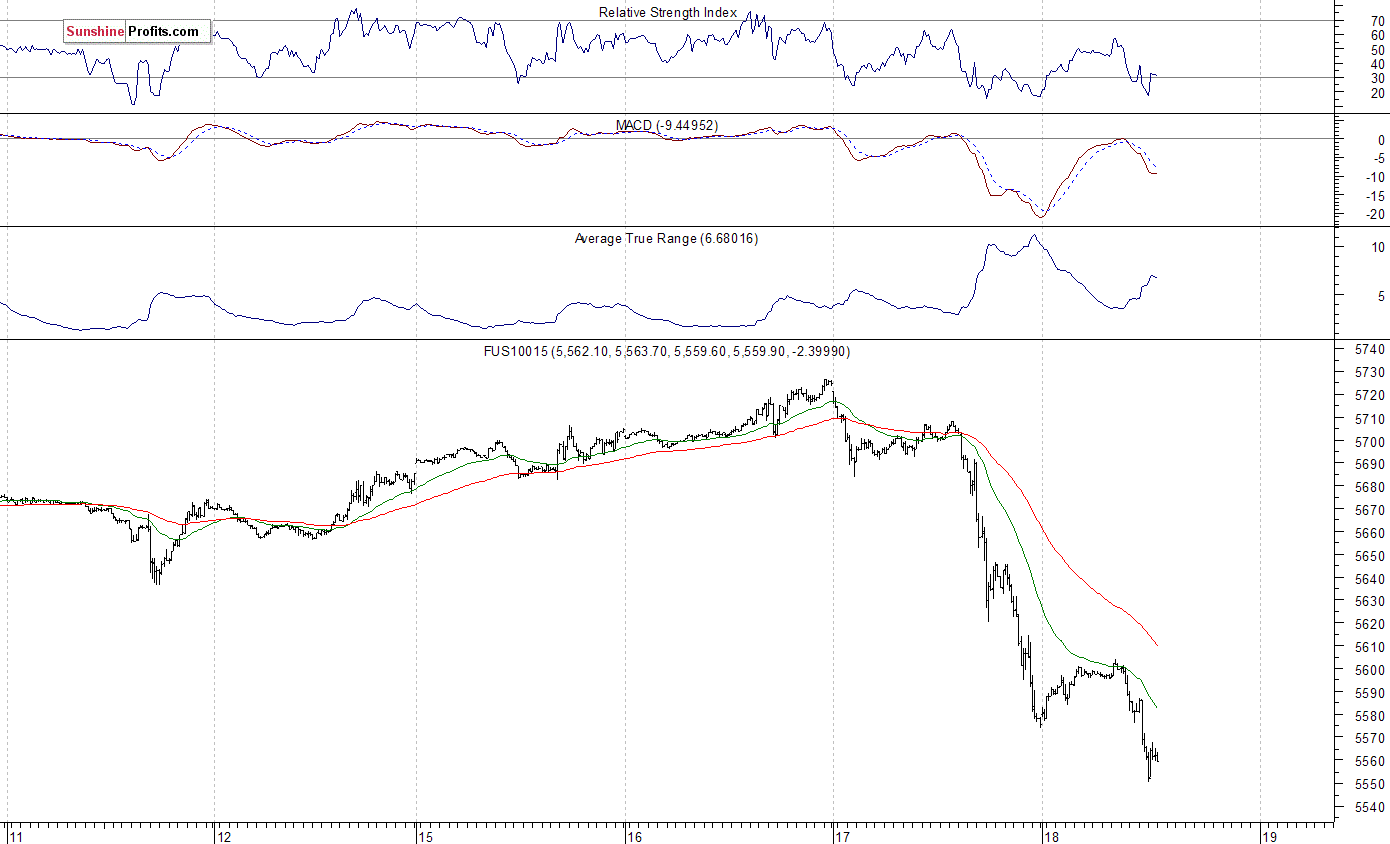
The technology Nasdaq 100 futures contract was relatively weaker than the broad stock market yesterday, as it retraced its few-week-long rally to new record highs above the level fo 5,700. It is now trading well below the level of 5,600. The nearest important level of support is at around 5,550, marked by an intraday local low. On the other hand, resistance level is at 5,600, and the next level of resistance is at 5,630-5,650, among others, as the 15-minute chart shows:
Concluding, the S&P 500 index broke below its short-term consolidation on Wednesday, as it got closer to the level of 2,350, following Tuesday’s move to new record high above 2,400 mark. Is this a new downtrend or just downward correction within an almost three-month-long consolidation? There have been no confirmed positive signals so far. For now, it looks like a new downtrend and the market may retrace more of its over year-long uptrend. We still can see medium-term negative technical divergences. Therefore, we continue to maintain our speculative short position (opened on February 15 at 2,335.58 – opening price of the S&P 500 index). Stop-loss level is at 2,410 and potential profit target is at 2,200 (S&P 500 index). You can trade S&P 500 index using futures contracts (S&P 500 futures contract – SP, E-mini S&P 500 futures contract – ES) or an ETF like the SPDR S&P 500 ETF – SPY. It is always important to set some exit price level in case some events cause the price to move in the unlikely direction. Having safety measures in place helps limit potential losses while letting the gains grow.
To summarize: short position in S&P 500 index is justified from the risk/reward perspective with the following entry prices, stop-loss orders and profit target price levels:
S&P 500 index – short position: profit target level: 2,200; stop-loss level: 2,410
S&P 500 futures contract (June) – short position: profit target level: 2,197; stop-loss level: 2,407
SPY ETF (SPDR S&P 500, not leveraged) – short position: profit target level: $220; stop-loss level: $241
SDS ETF (ProShares UltraShort S&P500, leveraged: -2x) – long position: profit target level: $15.47; stop-loss level: $12.98
Thank you.
Paul Rejczak
Stock Trading Strategist
Stock Trading Alerts
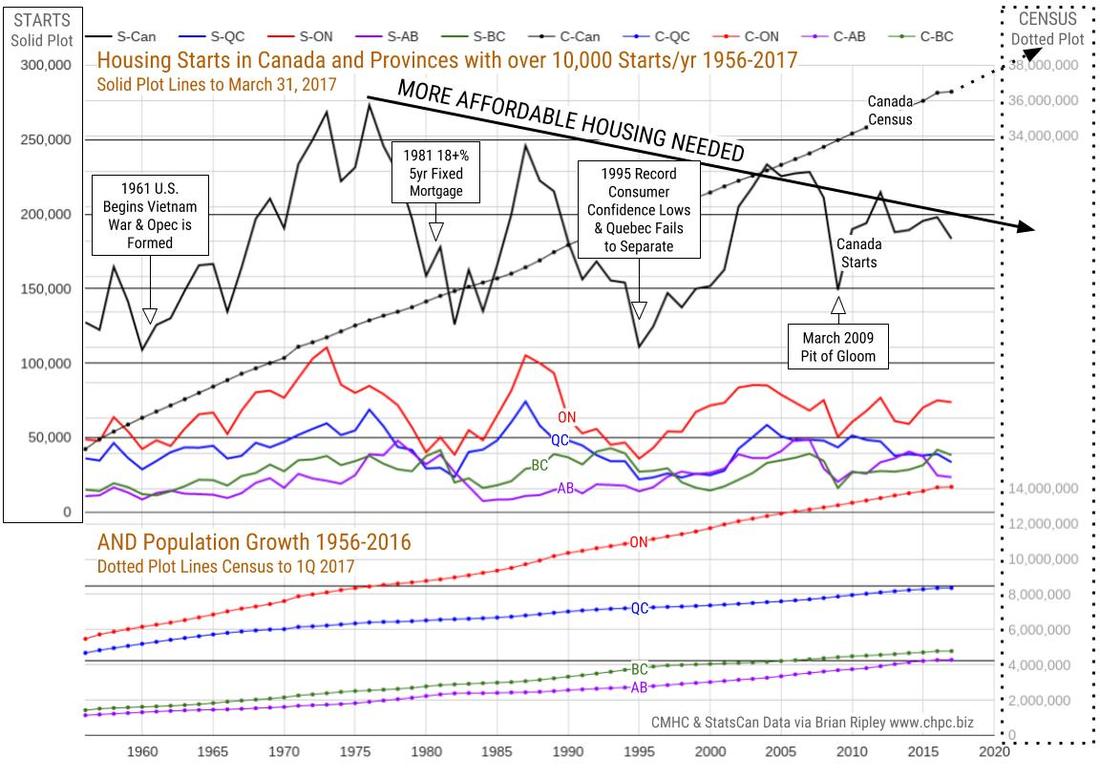
NOTE: The chart below shows the actual annual totals count from 1956 through 2016.
The 2017 data points on the chart are derived from the “annualized” provincial data set in the charts above and are therefor a projection of what year end 2017 might look like.
…..read more HERE including City, Provincial charts broken down
…related: Toronto, Hamilton and Victoria push Canada to another record on house prices

Up 10,000% in 16 months? These charts truly depict our crazy times
“One word, a question: Etherium,” said the guy at my swim club on Sunday. “What do you think? It’s a ten-bagger since January.” Meaning that the value of the cryptocurrency has multiplied by ten in the four months since January 16.
It’s actually more than a “ten-bagger.” At the end of 2015, it was worth $0.90. As I’m writing this, it’s worth $91.30. Those who bought it at the end of 2015 had a ten-bagger on their hands by January 16, 2017. Those who bought at that time also have ten bagger on their hands. Those that rode it all the way up over the 16 months have a 100-bagger. For percentage fans, that’s a gain of 10,000%.
Here is the chart of this financial miracle (via WorldCoinIndex):

What miracle “asset” did they get when they bought it? Don’t even ask. Just believe in it. It certainly isn’t a usable currency for legit purposes, obviously, given this kind of insane instability. But it really doesn’t matter what it is as long as it is going up.
By “market capitalization,” ethereum is now the second largest cryptocurrency at $8.4 billion.
READ MORE HERE: What The Heck’s Going On With Cryptocurrencies?
As I mention in my previous article, PAPER vs PHYSICAL: The Amazing Amount Of Leverage In The Silver Market:
Currently, the crypto-currencies are experiencing huge gains over the past several months. It doesn’t matter if an individual agrees with owning Bitcoin or one of the many crypto-currencies, the important thing to understand is that the tremendous price increases in many crypto-currencies are likely due to concern to the massive amount of Central Bank $1 trillion in asset purchases in the first four months of the year.
Furthermore, crypto-currencies are a likely a GOOD INDICATOR of what will take place in the gold and silver market when investors realize most STOCKS, BONDS and REAL ESTATE values will continue to implode as the U.S. and Global Oil Industries disintegrate.
The gold and silver prices are being capped because paper contracts can be added as more funds move in. However, crpyto-currencies do not have this problem because the amount of Bitcoins, as an example, are limited.
Precious metals sentiment is very similar to what was taking place in Ripple for the past several years as trading volume and interest were FLAT-LINED:

You will notice since the May of 2015, trading volume and interest in Ripple was very low. However, in just the past 11 weeks, Ripple’s price has increased 3,500%. It is interesting that interest in these Crypto-currencies has exploded as the Central Banks purchased $1 trillion in assets during the first four months of 2017.
The reason the Ripple Price is able to surge higher, is due to a LIMITED number of outstanding Ripple coins. This is much different than Gold and Silver that are traded on the exchanges. Gold and silver’s prices are capped as more and more paper contracts are added.
However, at some point, what is currently taking place in the Crypto-Currency Market will also take place in gold and silver.
Check back for new articles and updates at the SRSrocco Report.

-
I know Mike is a very solid investor and respect his opinions very much. So if he says pay attention to this or that - I will.
~ Dale G.
-
I've started managing my own investments so view Michael's site as a one-stop shop from which to get information and perspectives.
~ Dave E.
-
Michael offers easy reading, honest, common sense information that anyone can use in a practical manner.
~ der_al.
-
A sane voice in a scrambled investment world.
~ Ed R.
Inside Edge Pro Contributors

Greg Weldon

Josef Schachter

Tyler Bollhorn

Ryan Irvine

Paul Beattie

Martin Straith

Patrick Ceresna

Mark Leibovit

James Thorne

Victor Adair