
Currency
What in God’s name is happening?
It’s not a high.
It’s a record high.
Sweet mother of Mary…
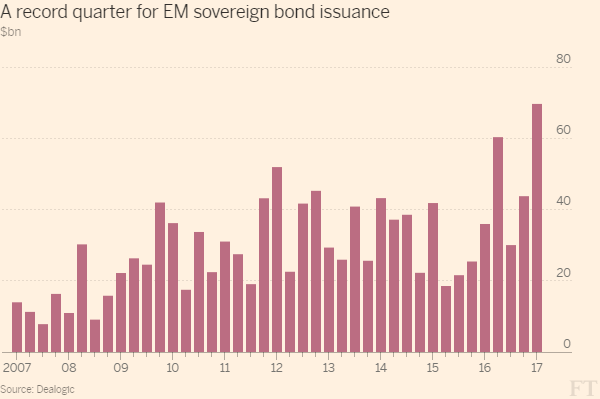
As we can see from the above chart courtesy of the FT, emerging markets sold a record amount of government debt in the first quarter of this year.
More from the FT here:
“Data from Dealogic, a research firm, show that sovereign bond sales from emerging markets rose to $69.6bn in the first three months of the year, an increase of 48 per cent from a year ago and a record amount for a single quarter. Corporate bond sales by companies in developing countries also surged, rising 135 per cent year on year in the first quarter to $105bn, according to Bloomberg data.”

Bitcoin Trading Alert originally sent to subscribers on May 15, 2017, 11:38 AM.
In short: no speculative positions.
A hacker attack has swept across the globe encrypting user files and crashing corporate services. In an article on CoinDesk, we read:
Extortionist hackers who may be using leaked computer exploits from the U.S. National Security Agency infiltrated computers in dozens of countries in a fast-spreading attack that forced British hospitals to turn away patients and breached systems at Spain’s Telefonica SA and organizations from Russia to Taiwan.
The ransomware used in Friday’s cyber-attacks encrypts files and demands that victims pay $300 in bitcoin for them to be decrypted, the latest in a vexing style of security breaches that, at the very least, forces organizations to revert to backup systems to keep critical systems running. The malicious software has infected more than 75,000 computers in 99 countries worldwide on Friday, most of them concentrated in Russia, Ukraine and Taiwan, according to Dutch cybersecurity company Avast Software BV.
Several other well-know companies have been affected such as Deutsche Bahn or Renault. Reports have also emerges claiming that people are unwilling to pay the ransom since it’s relatively complicated for them to set up a Bitcoin wallet.
This is bad publicity for Bitcoin as it highlights the features of the currency that have captured the imagination of mainstream media for some time now – the superficial anonymity and the possibility to use Bitcoin for illegal transactions. It is perhaps not fair for the currency – it is only a tool in the hands of criminals and there’s nothing inherently criminal in Bitcoin itself. Actually, the more interesting part of the story is that it is still too hard for people to use Bitcoin – a state of things that has prevailed for a couple of years now.
For now, let’s focus on the charts.
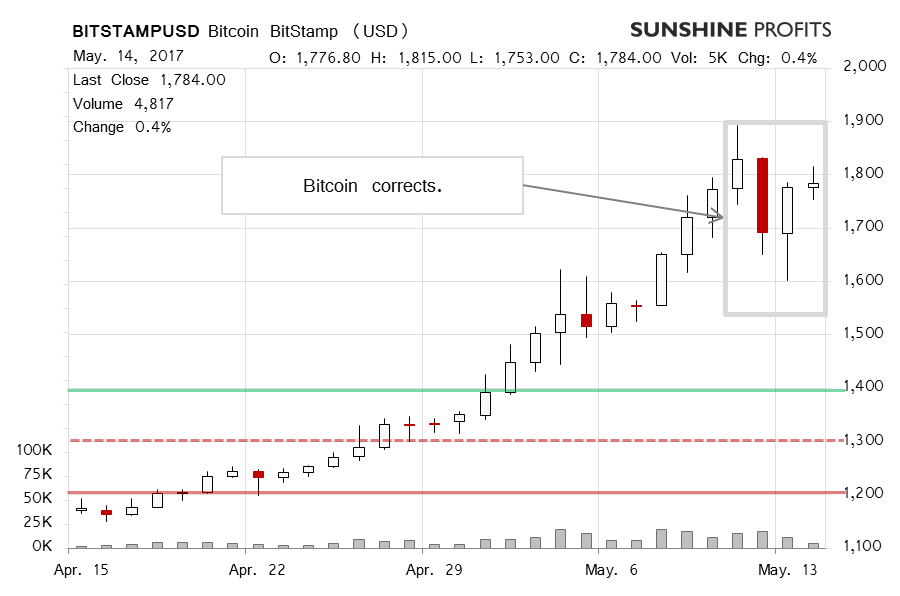
On BitStamp, we saw a correction. Not a strong one, but a move down nonetheless. Does this mean that the situation is bearish now? Let’s recall our recent comments:
The move up looks very overextended right now with the RSI over 90 (!). This is not a typical situation. This might mean that we’re in for a correction. If the correction transpires, its depth might be the most important situation in the market in months. For instance, if it’s shallow, we might have a buying opportunity on our hands.
The move down looks bearish on the face of it and it might just as well be the case that more declines will follow. At the same time, the decline was modest. Yes, the move on Friday was relatively deep in terms of price but it was also reversed, at least partially, on Saturday. More declines have followed since then (this is written around 11:30a.m. ET), but the volume hasn’t been convincing. So, we have a correction on relatively low volume. What might this mean for the market?
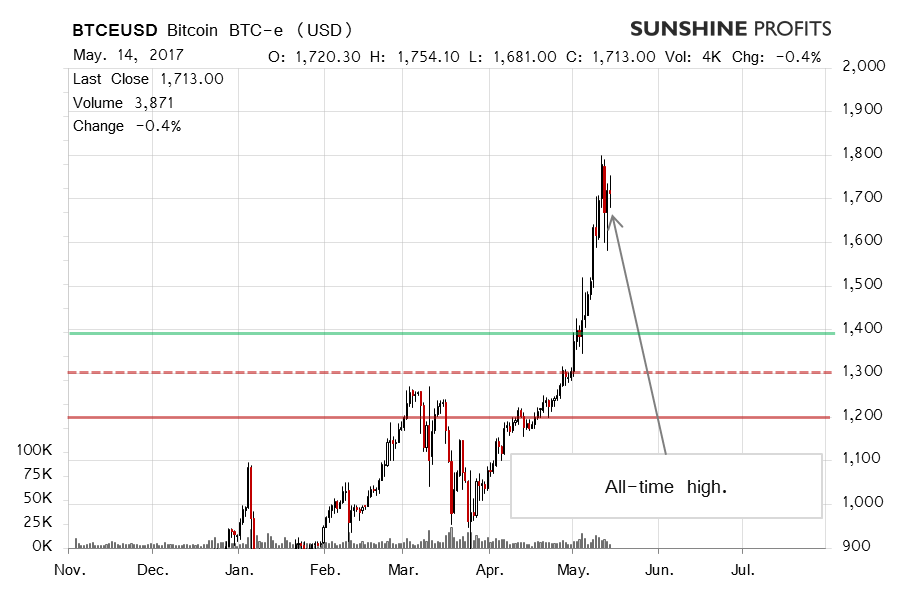
On the long-term BTC-e chart, we see the move down from the recent top. In our previous alert, we wrote:
The recent move to the $1,800 level doesn’t change much, in our opinion. Bitcoin has gone up very far very fast. The RSI at 90 also spells trouble for the short term. This might mean that a correction is long overdue. Is it possible for Bitcoin to move higher? Yes, this can’t be completely ruled out. At the same time, the balance of probabilities has actually shifted to slightly more bearish. The next move, if it in fact is a correction, might have far-reaching implications for the medium term. If Bitcoin breaks below $1,400, we might see a prolonged period of depreciation. If we see a move down, but not significantly lower and a bounce to the upside, we might be in for a continuation of the rally.
Much of what we wrote then is still up to date. We have seen a move down but not one strong enough, in our opinion, to change the short-term outlook and tilt it to significantly bearish. We might be in the first phase of a strong move down, however, it is still to soon to claim this decisively. The risk of seeing a rebound to the upside and an invalidation of the whole move lower is to great, in our view, to bet on lower prices just now. This might change in the next couple of days.
Summing up, in our opinion not having speculative positions might be favorable at the moment.
Trading position (short-term, our opinion): no positions.
Thank you.
Regards,
Mike McAra
Bitcoin Trading Strategist
Bitcoin Trading Alerts

Here at the outset, I want to share with you an interesting observation we made last week of gold’s seasonal trading pattern. As you can see in the chart below, based on data provided by Moore Research Center, the five-year pattern, represented by the orange line, is diverging from the longer-term trends. Note that the index on the left measures the greatest tendency for the asset to make a seasonal high (100) or low (0) at a given time.
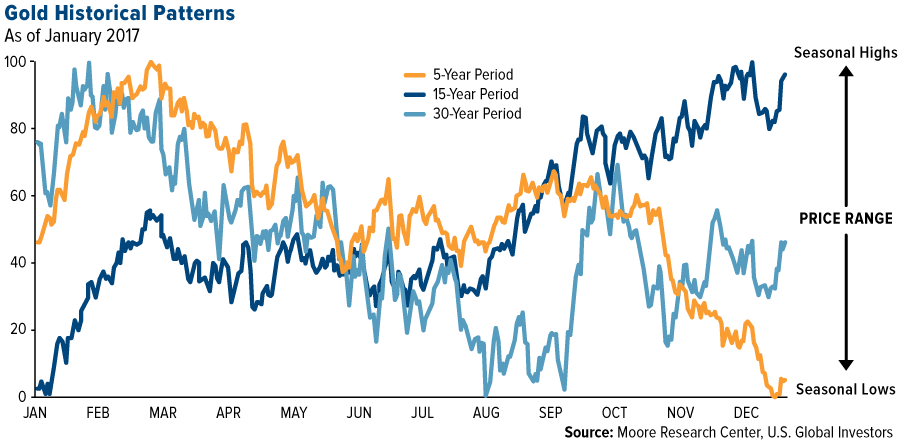
The data show that lows are now reached late in the year, not in January (according to the 15-year period, represented by the dark blue line) or August (according to the 30-year pattern, represented by the light blue line). Historically, September has seen the highest returns on gold as Indians make huge purchases in preparation for Diwali and the fourth-quarter wedding season, but lately we’ve seen changes. When we calculate the average monthly returns of the past five years, from January 2012 to December 2016, we find that January is the strongest month, returning 5.3 percent, following by August with 2.3 percent. September actually returns negative 1.3 percent.
There could be a number of reasons why this is, but it’s important to recognize that the five-year period captures the bear market that dragged gold from its high of $1,900 an ounce in August 2011 to a recent low of $1,050 in December 2015. The years 2013, 2014 and 2015 all saw negative returns, so it’s little wonder why the orange line trends down from February-March to December.
Inflation Props Up Gold
Consumer and producer prices rose in April compared to the same time last year, favoring gold prices going forward. Consumer goods climbed 2.2 percent, down slightly from March’s 2.4 percent. Wholesale goods, meanwhile, flew up 5.3 percent, higher than economists’ expectations and the strongest year-over-year increase in nearly six years.
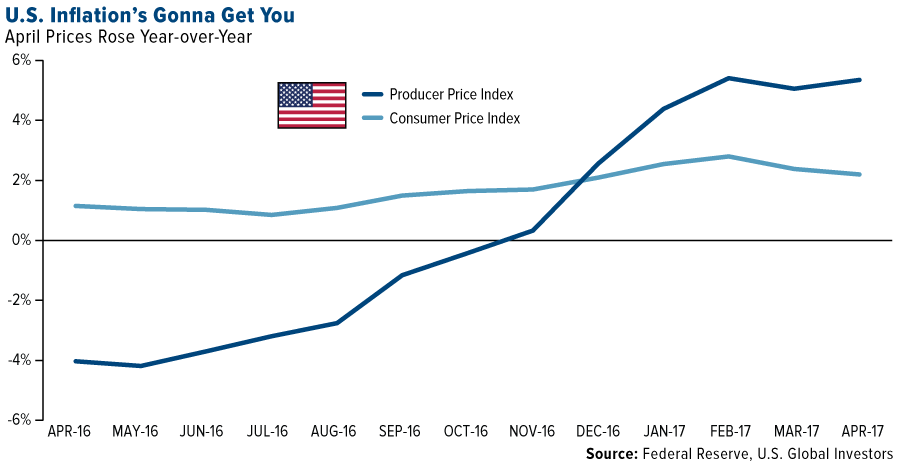
On numerous occasions I’ve shown that higher inflation supports demand for gold, which has often been seen as a safe haven investment. The money you have sitting in the bank right now is guaranteed to lose value over time. The five-year Treasury bond is currently yielding a negative return. Diversiying a part of your portfolio into gold and gold stocks could help mitigate the effects of inflation on your household wealth. I’ve always recommended a 10 percent weighting with annual rebalances.
Chindia Demand Was Strong in the First Quarter
In India, no one questions this. Aside from property, gold is seen as the most reliable store of value, which is why it’s routinely given as a gift during weddings, graduations, births and other important life events.
Indians’ demand for gold jewelry jumped 16 percent year-over-year in the first quarter, according to the World Gold Council (WGC), as the country slowly recovers from the economic shock of Prime Minister Narendra Modi’s demonetization scheme in November.
Demand in China for gold bars and coins had an unusually strong start to the year, fueled by concerns over a weakening renminbi and uncertainty over the country’s real estate market. The first quarter has historically been a good time for Chinese demand, as that’s when the Lunar New Year falls. This year, though, demand was up an amazing 30 percent, with 105.9 metric tons (tonnes) purchased during the three-month period. According to the WGC, this was the fourth-strongest quarter on record.

Looking ahead, gold prices could be supported by steadily declining mine production. Over the next five to 10 years, output from currently-operational mines is expected to drop off steeply as a consequence of deep spending cuts for project development as well as a lack of significant new deposit discoveries.
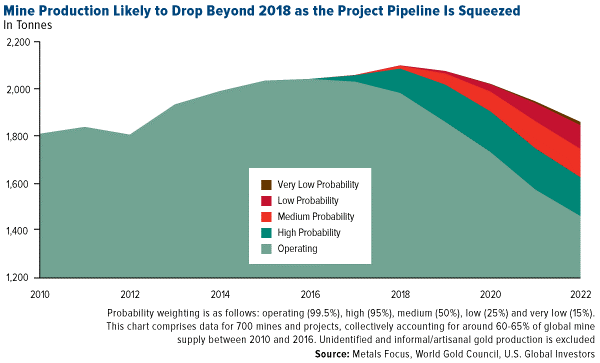
Between 2012 and 2016, capital expenditure for companies in the NYSE Arca Gold BUGS Index contracted 65 percent, the WGC reports. This will inevitably squeeze the supply chain and help prices firm up.
Stock Investors Have No Fear
In the near term, gold faces a number of headwinds, including a strong U.S. dollar, rising nominal interest rates and a still-robust stock market. Despite recent geopolitical shockwaves such as President Donald Trump’s surprise firing of FBI director James Comey, investors still see stocks as a good place to be, with the CBOE Volatility Index, or VIX, trading at lows last seen in 1993.

Popularly known as the “fear gauge,” the VIX measures expected volatility in the S&P 500 Index over the next month. That it’s trading so low suggests that geopolitical uncertainty doesn’t always translate into investor uncertainty. Evidently Wall Street doesn’t share the same sense of impending doom as some voters and media figures appear to have right now concerning Comey’s termination and the ongoing investigation into possible collusion between the Trump campaign and the Russian government.
This matters because gold has historically benefited in times of crisis and uncertainty, whether real or perceived. But with the VIX signaling near-record-low fear in the marketplace, some investors might see this as weakening the case for gold.
Where We See the Gold Opportunities
In this environment, we seek high-quality producers that are profitable and show improvements in revenue and cash flow. This yields junior companies such as Klondex and Wesdome, both of which have demonstrated strong fundamentals, low SG&A (selling, general and administrative expenses), cost-conscientious management and higher-grade ore.
The recent bubble in gold stocks unwound, which was harmful to some quality gold names that were affected by the issues involving the VanEck Vectors Junior Gold Miners ETF (GDXJ), which I wrote about last week. Since the GDXJ methodology update was announced, the ETF has recorded large redemptions, with assets plunging as much as 25 percent.
The GDXJ doesn’t have any smart beta attributes—instead, it relies on market cap. As portfolio manager Ralph Aldis put it, this means “we find a lot of high-quality companies being indiscriminately sold down.” We see this as an opportunity to nibble at some attractive small-cap growth names.

All opinions expressed and data provided are subject to change without notice. Some of these opinions may not be appropriate to every investor. By clicking the link(s) above, you will be directed to a third-party website(s). U.S. Global Investors does not endorse all information supplied by this/these website(s) and is not responsible for its/their content.
The Consumer Price Index (CPI) is one of the most widely recognized price measures for tracking the price of a market basket of goods and services purchased by individuals. The weights of components are based on consumer spending patterns. The Producer Price Index (PPI) measures prices received by producers at the first commercial sale. The index measures goods at three stages of production: finished, intermediate and crude.
The NYSE Arca Gold BUGS (Basket of Unhedged Gold Stocks) Index (HUI) is a modified equal dollar weighted index of companies involved in gold mining. The HUI Index was designed to provide significant exposure to near term movements in gold prices by including companies that do not hedge their gold production beyond 1.5 years.
Chicago Board Options Exchange (CBOE) Volatility Index (VIX) shows the market’s expectation of 30-day volatility.
The S&P 500 Stock Index is a widely recognized capitalization-weighted index of 500 common stock prices in U.S. companies.
Beta is a measure of the volatility, or systematic risk, of a security or a portfolio in comparison to the market as a whole.
Holdings may change daily. Holdings are reported as of the most recent quarter-end. The following securities mentioned in the article were held by one or more accounts managed by U.S. Global Investors as of 3/31/2017: Klondex Mines Ltd., Wesdome Gold Mines Ltd., VanEck Vectors Junior Gold Miners ETF.
U.S. Global Investors, Inc. is an investment adviser registered with the Securities and Exchange Commission (“SEC”). This does not mean that we are sponsored, recommended, or approved by the SEC, or that our abilities or qualifications in any respect have been passed upon by the SEC or any officer of the SEC.
This commentary should not be considered a solicitation or offering of any investment product.
Certain materials in this commentary may contain dated information. The information provided was current at the time of publication.

In direct contrast to the “euphoria days” of 2011, most investors have now turned bearish on gold after experiencing a multi-year bear market. Contrarian investors—who generally invest against the consensus or the crowd—argue that’s a good sign and believe the bear market in gold has likely reached an end.
One way to determine this is by looking at the behavior of retail investors, who are much smaller, speculative buyers, vs. the wholesale market, who buy much larger quantities and, often, when prices are more attractive.
….also from Financial Sense:
Oil Jumps as Saudis And Russians Agree to Extend OPEC Deal Into 2018

 ….also from Martin: The Coming Central Bank Crisis
People talk about the changing environment. In the financial world around us, things are also changing dramatically. What use to be is no more. There are no real ticker-tape parades any more and future pits are closing opting for online trading. What is changing and why can we not see it? The internet has changed the way people shop around the world with the retail sector currently dominated by Amazon, accounting for almost 65% of online sales. Amazon pasted Walmart (in market cap) back in 2015 and within the past two years has grown in value to be worth twice as much. Large department stores and the more traditional malls are closing but this is happening as retail spending continues to grow. Admittedly, online merchants have made it far easier, tap a button and our goods arrive at the doorstep the next day, but obviously at the expense of shop staff. The more comfortable we get with online retail the more intelligent we are shopping around and doing it ourselves. Is having the ease of service and renewed confidence a major influence upon why we are turning to index trackers and ETF’s rather than pay a money manager 2% to do it for us?
The ETF market has ballooned since the early 2000’s and is now worth approximately $2.5tn. With this “online” competition, the rumours are that the fees have been reduced to an almost nothing, with money managers taking just 20bp on the fund in the hope that they can make additional returns on the bid/offer spread. One of the problems we could face however, is that the derivative (ETF) becomes more liquid than the underlying. The relationship will work fine in an orderly market but will be tested in extremely or volatile conditions. The concern should be when will Market-Makers widen their spreads so just ensure you are not the last one to see the problems.


-
I know Mike is a very solid investor and respect his opinions very much. So if he says pay attention to this or that - I will.
~ Dale G.
-
I've started managing my own investments so view Michael's site as a one-stop shop from which to get information and perspectives.
~ Dave E.
-
Michael offers easy reading, honest, common sense information that anyone can use in a practical manner.
~ der_al.
-
A sane voice in a scrambled investment world.
~ Ed R.
Inside Edge Pro Contributors

Greg Weldon

Josef Schachter

Tyler Bollhorn

Ryan Irvine

Paul Beattie

Martin Straith

Patrick Ceresna

Mark Leibovit

James Thorne

Victor Adair