
Timing & trends
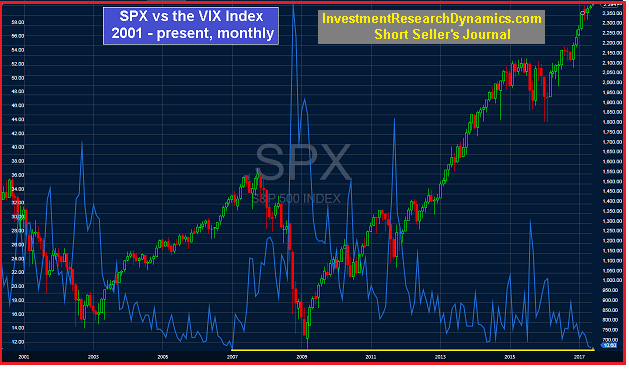
You’ve probably heard/read a lot lately about the VIX index. The VIX index is a measure of the implied volatility of S&P 500 index options. The VIX is popularly known as a market “fear” index. The concept underlying the VIX is that it measures the theoretical expected annualized change in the S&P 500 over the next year. It’s measured in percentage terms. A VIX reading of 10 would imply an expectation that the S&P 500 could move up or down 10% or less over the next year with a 68% degree of probability. The calculation for the VIX is complicated but it basically “extracts” the implied volatility from all out of the money current-month and next month put and call options on the SPX.
The graph above plots the S&P 500 (candles) vs. the VIX (blue line) on a monthly basis going back to 2001. As you can see, the last time the VIX trended sideways around the 11 level was from 2005 to early 2007. On Monday (May 8) the VIX traded below 10. The last time it closed below 10 was February 2007. The VIX often functions as a contrarian indicator. As for the predictive value of a low VIX reading, there is a high correlation between an extremely low VIX level and large market declines. However, the VIX does not give us any information about the timing of a big sell-off other than indicate that one will likely (not definitely) occur.
In my opinion, an extremely low VIX level, like the current one, is signaling an eventual sell-off that I believe will be quite extreme.
The true fundamentals underlying the U.S. economy – as opposed the “fake news” propaganda that emanates from uncovered manholes at the Fed, Wall Street and Capitol Hill – are beginning to slide rapidly. The primary reason for this is that the illusion of wealth creation was facilitated by the inflation of a massive systemic debt and derivatives bubble. Government and corporate debt is at all-time highs. The rate of debt issuance by these two entities accelerated in 2010. Household debt not including mortgages is at an all-time high. Total household debt including mortgages was near an all-time high as of the latest quarter (Q4 2016) for which the all-inclusive data is available. I would be shocked if total household was not at an all-time high as I write this.
The fall-out from this record level of U.S. systemic debt is beginning to hit and it will accelerate in 2017. In 2016 corporate bankruptcies were up 25% from from 2015. So far in 2017, 10 big retailers have filed for bankruptcy, with a couple of them completely shutting down and liquidating. Currently there’s at least 9 more large retailers expected to file this year. In addition to big corporate bankruptcies, the State of Connecticut is said to be preparing a bankruptcy filing.
The household debt statistics show a consumer that is buried in debt and will likely begin to default on this debt – credit card, auto, personal, student loan and mortgage – at an accelerated rate this year. The delinquency and charge-off statistics from credit card and auto finance companies are already confirming this supposition.
In the latest issue of the Short Seller’s Journal, I review the VIX and the deteriorating consumer debt statistics in detail and explain why the brewing financial crisis will be much worse than the one that hit in 2008.

According to the most recently released data from Chile’s Ministry of Mining, the country’s silver production declined a stunning 26% in the first quarter of 2017. This is a big deal as Chile is the fourth largest silver producing country in the world. The majority of Chile’s silver production comes as a by-product of copper production.
Chile is the largest copper producer in the world, by a long shot. Last year, Chile produced 5.5 million tons of copper compared to Peru, who took a distant second place at 2.3 million tons.
Regardless, Chile’s silver production declined to 283.4 metric tons (mt) Q1 2017 versus 383.8 mt during the same quarter last year. Again, this is a huge 26% decline in the first three months of the year:
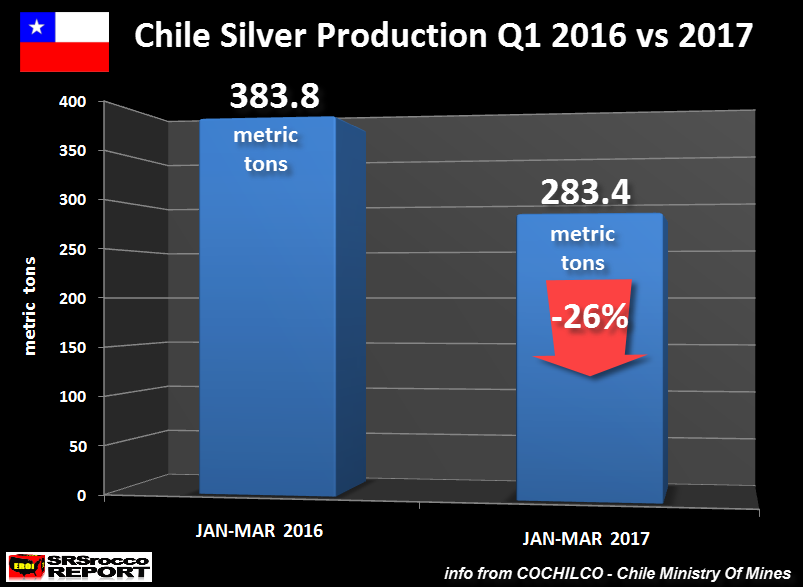
Chile’s silver production declined 101 mt (3.2 million oz) Q1 2017, due to a strike at the country’s largest copper mine, Escondida, as well as a drop off in copper production from many other producers.
For example, of the 20 copper producing mines (& companies) listed on the Chile’s Ministry of Mining Report, 12 of them stated lower copper production Q1 2017 compared to the same period last year. Thus, the strike at Escondida only accounted for a portion of the overall decrease in by-product silver production experienced across the entire industry.
The majority of the Chile’s silver production decline took place in March:

According to the COCHILCO’s data, silver production fell 16% in January, 29% in February, and 34% in March. In just the month of March, Chile’s silver production declined 45 mt. That is a huge drop off in just one month.
Even though Chile’s Ministry Of Mining forecasts that copper (and by-product silver) production will recover by the second half of the year, the world economy continues to stagnate under a massive amount of debt and derivatives. I believe we will see falling copper prices as overall demand for the king base metal continues to weaken during the latter part of 2017, and into 2018.
This will put a great deal of stress on many of Chile’s copper mining companies ability to make profits. So, we may soon experience PEAK GLOBAL COPPER PRODUCTION… once and for all.
For those individuals who want to make sure that I am not pulling these figures off the top of my head, here is the actual table of gold and silver production from Chile’s Ministry of Mining website:

Not only is Chilean silver production (plata) down 26% in the first three months of the year, gold mine supply (oro) is also down 22%. While a 22% decline in Chile’s gold production is substantial, the country only produced 43.3 mt (1.4 million oz) in 2016, compared to 1,496 mt (48.1 million oz) of silver.
Chile isn’t the only country suffering from falling silver production this year. As I stated in a previous article, Huge Decline In Peru’s Silver Production Suggests Future Production At Risk, Peru’s silver production declined 12% FEB 2017 versus the same month last year:

So, what were are witnessing here is that world’s top two copper producers are suffering large declines in their by-product silver production. This to me is a WARNING SIGN that the situation for by-product silver production will likely continue to deteriorate in the future as base metal prices trend lower as economic activity slows.
Clarification On Silver Supply & Demand Forces
There seems to be many precious metals investors (on my site and on other blogs) who believe that all these supply and demand figures are meaningless because the price of silver hasn’t really performed all that well since 2012. I agree. However, my focus on silver supply and demand forces is not to determine a SHORT TERM SILVER PRICE, rather I look at what is taking place over an ongoing trend.
For example, I have published articles on the huge increase in physical silver investment demand since the 2008 U.S. Housing and Banking Crisis. My focus was not to state that the silver price was going to be determined upon a single year’s worth of rising silver investment demand, rather it was to show that the world is waking up the SILVER STORY.
Furthermore, putting out articles on what it taking place as it pertains to world silver supply isn’t to forecast what the change will do to the price of silver in 2017, but rather how the declining trend will impact the price going forward.
So, for those who precious metals investors who continue to BELLY-ACHE that all these supply and demand figures don’t really change the silver current price that much, I KNOW THAT fer pete sakes… LOL. I am more concerned about the ongoing trend and what it going to happen over the mid to longer term.
Lastly the Silver Institute just released their 2017 World Silver Survey, and I have been looking over it. I will be publishing a few interesting articles on some of the data from the report as I believe they are a tell-tale sign that owning physical silver will benefit those immensely in the future.
Check back for new articles and updates at the SRSrocco Report.

Rosengren & Carney
Draghi Heckled
Treasury Hat Trick
Stop Drinking Now
A Brief Commercial
Orlando, Washington DC, St. Thomas, and SIC 2017
Basic economics tells us all resources are scarce, but our demand for them is not. Hence we need methods to allocate the limited supply of each resource. A significant part of economics is the study of those methods.
One exception to the rule, though, has developed in the last few years: The amount of information available to us is practically unlimited. Open your internet browser, and most of that information is just a few clicks way. But if media industry profits (or lack of them) are any indication, demand for that information is anything but infinite.
One problem with information is that much of it is biased. I know, for instance, that when I read a certain economist commenting on recent data, he is going to put a spin on it that reflects the particular economic soapbox he prefers to stand upon. And while I will occasionally take time to read such people, just to kind of keep up on “influencers,” they often don’t really add much to the conversation.
Then there are those who are always delivering fascinating surprises. They do enormously deep dives into arcane data and tease out insights of real importance – connections to other ideas or solutions to challenging problems – they come up with new and different way of looking at the world. I don’t know what you call them, but “seekers of truth” is how I label them. They are just as curious as I am about how the Grand Puzzle all fits together, and they are describing the pieces as viewed from the another side of the table. I value these thinkers. (Sitting here thinking about it, I realize that I need to put a list together of some of my best resources. Some of them are expensive to access; but, surprisingly, more and more of them are either cheap or free. I will get around to that project and make it available to you one day.)
Back to the main plot line. What is scarce isn’t information itself (we’re all nearly drowning in it) but the ability to process it into something useful. All of us, including me, are still figuring out that part. And the creation of really valuable information takes time. I have had a vivid demonstration of that fact myself these last few weeks as I try to launch a new business andprepare for the upcoming Strategic Investment Conference. You cannot believe how much personal preparation goes into talking with every one of the speakers and figuring out how to blend their ideas so that something coherent emerges from our shared experiences at the conference.
And then there are the challenges of keeping up with my regular writing and research andputting in the many hours it takes to be a dad and granddad, always in the middle of a crisis or two. Life is what actually happens after you make careful plans.

My own particular approach to drinking from the enormous information firehose has a couple of key features.
First, be a connoisseur of good information sources. I hope that for you I am a trusted and reliable source. I do my best to deserve the precious time that you devote to me.
Second, depend on trusted colleagues and associates to pre-process information for you. Let me give you an example. It’s just one out of what could be dozens, but I think it’s a good illustrative choice. High among the sources who keep me reliably up to date and surfing (rather than drowning in) a flood of information is Peter Boockvar, a man whose ability to process raw financial data and quickly transmute it into intelligible, digestible pieces is superhuman. I honestly don’t know how Peter does what he does, but it’s awe-inspiring and very, very helpful.
Today I’m going to share a small sample of Peter’s daily output. Below are three articles he published on one day – Thursday, May 11, 2017. And he does this every day, week and month and year in and out. He never fails to make cogent, interesting points about the day’s events. Think about the brainpower it takes to generate this sort of creative output every working day.
Then, if you’re at SIC, shake Peter’s hand and tell him “Thank you for keeping John sane.” You might even share a drink with him and soak up a little wisdom. I work hard to encourage all my speakers to make themselves available to the attendees at the conference. Take advantage of that.
Here are Peter’s three pieces for May 11. I’ll be back afterward with a few more thoughts.
Rosengren’s 180, Mark Carney Boxed In
United States
In case you missed his comments yesterday, Boston Fed President Eric Rosengren, a currently non voting member, has really done a 180. I always considered him a card carrying bleeding heart dove and now he is one of the most hawkish members of the Fed. It’s the reverse of ex member Narayana Kocherlakota who went the exact opposite route and embraced zero rates and was jealous of the Europeans who went negative.
Rosengren yesterday said he wants to hike rates three more times this year and start tapering after the June meeting. He fears the economy is overheating which is ironic after a 0.7% Q1 GDP print but his point is more on the labor side as he realizes the hole they are now in with the labor market continuing to tighten, the unemployment rate continuing to fall and the Fed is sitting there with its benchmark rate of just 0.875% at the same time their balance sheet is still at emergency levels. Also highlighting the tug of war I’ve talked about all year between hoped for fiscal reform and its tailwind vs the headwind of monetary tightening, Rosengren said the more fiscal stimulus we see, the more monetary tightening we will get as well.
Bottom line, of course this is just his opinion and he doesn’t vote and it only matters what the troika thinks but if his line of thinking, coming from an ex dove, starts to permeate, watch out. That said, I don’t expect Yellen to adopt Rosengren’s stance as it’s just not her nature. We’ll most likely get two more hikes and a December announcement on quantitative tightening. In fact, Bill Dudley today essentially told Rosengren to reign it in as he said “there is no great urgency for Fed to tighten aggressively” and he used that word ‘gradual’ again. He also said that they’ll look at QT later this year or in early 2018. Another noteworthy comment from Dudley was after taking its balance sheet from under $1T to $4.5T he said there is “a lot of uncertainty over how much QE depressed rates.” Funny.
The UK
After the BoE left policy unchanged they hinted at a possible rate hike and warned markets not to be so nonchalant about current policy staying the same. As it was sort of a lame warning, the pound is down and gilt yields are little changed. They also raised their 2017 CPI forecast to 2.7% from 2.4%. What’s keeping the BoE from at least taking away the emergency rate cut after Brexit? They said that their economic forecasts “rely on pickup in wages that had yet to materialize.” I argue they have it backwards. If they cared more about controlling inflation and the plunge in the pound, we’d by definition see a pick up in real wages. Mark Carney in his press conference said “it will be a more challenging time for households.” Well, he’s partly responsible for that with his emergency monetary policy that is crushing wage earners, savers and pensioners while inflation flares. With a straight face he also said that “BoE stimulus isn’t excessive, it’s appropriate.” Appropriate for what? Armageddon? Their balance sheet has never been bigger, they’ve partly nationalized the corporate bond market and their benchmark rate sits at .25% with 10 year inflation expectations at 3.10%, actual consumer price inflation approaching 3% and wholesale input prices seeing near 20% growth.
Evidence that Mark Carney is getting stuck in a stagflationary type environment, March industrial production in the UK fell .5% m/o/m after an .8% drop in February. The estimate was down .4% and the y/o/y gain slowed to 1.4% and was driven by a slowdown in manufacturing.
Continuing Claims/Inflation/Draghi Heckled
United States
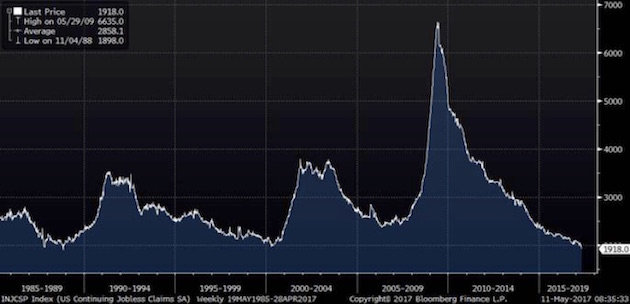
Initial jobless claims totaled 236k, 9k less than expected and compares with 238k last week. As a 234k print dropped out, the 4 week average was little changed at 244k. Continuing claims, delayed by a week, fell another 61k to the lowest level since 1988. See chart. Based on this visual, we historically have had only one way to go from here and it also highlights how far behind the 8 ball the Fed is and how much they missed this rate hike cycle. Employers continue to be reluctant to fire employees as its tougher to find good ones and they have high hopes for a tax and regulatory driven acceleration in growth.
Producer prices rose more than expected at all levels. The headline gain was .5% m/o/m, more than double the estimate of up .2%. The core level was higher by .4%, twice the estimate and also taking out trade saw prices spike by .7% vs the .2% forecast. The y/o/y gains for all three was 2.5%, 1.9% and 2.1% respectively. It was mostly the services side of the equation that drove the upside as the BLS said it contributed to 2/3 of the rise. Within this they said that 25% was “attributable to prices for securities brokerage, dealing, investment advice and related services which increased 6.6%.” I thought those prices are falling but whatever. They also cited higher prices for “guestroom rental, loan services, machinery equipment, parts, and supplies wholesaling, portfolio management, and airline passenger services.” On the goods side, cigarette prices was a main driver as they rose 2.2% while prices for food, natural gas and pharma products rose as well.
Bottom line, the demise of the inflation trade is a bit premature. To highlight in the commodity space, the Journal of Commerce index which I continuously refer to is down just 4.5% from its February high which comes after rising by 18% y/o/y. Also, services inflation is sticky and doesn’t just fade away. This said, the markets care more about CPI which we will see tomorrow. Rent growth is slowing and might keep a lid on it as housing makes up 40% of the index. The US 10 yr yield is unchanged on the day but up 1-2 bps from just before the number came out. European sovereign yields also moved higher.
Europe
One last thing, in case you missed it, Mario Draghi was basically heckled in the Dutch Parliament yesterday as they view the evils of monetary extremism similar to the Germans. He was accused of “raiding Dutch pensioners’ wealth” according to the FT. The FT also reported that “at one point following the ringing of bells in the Tweede Kamer, the lower House of the Dutch Parliament, one MP called out that the sound was the ‘end of your QE policies.’
Also the FT reported, and this is a good one, “MP’s finished the session with a gift of a solar powered tulip, to remind Mr. Draghi of the country’s famous asset price bubble and financial crisis in the mid 17th century. ‘We want you to look at this tulip before your meetings,’ said Pieter Duisenberg, the head of the MP’s committee, and son of Wim Duisenberg, the ECB’s first president.”
[JM here: I love people who can give me snippets of information that really illuminate the context of the politics central banks find themselves immersed in. I must confess that even though I have a subscription to the Financial Times, I simply don’t have enough time to read it all. I keep my subscription because people send me links and tell me that I should read this or that article. And I have a few friends who are FT junkies and who keep me up on all the important pieces.]
A Hat Trick of Weak Treasury Auctions
We have a hat trick of weak Treasury auctions this week as the 30 year bond offering was soft. The yield at 3.05% was about 1.5 bps above the when issued. The bid to cover of 2.19 was below the one year average of 2.30 and dealers got stuck with almost 36% of the auction vs the 12 month average of 29%. Prices and yields are not responding as it’s likely explained because the supply is now done for the week and prices adjusted all week. The 30 yr yield today stands at 3.05% vs 2.98% last Friday. The 10 yr yield is up by 5 bps and the 2 yr is higher by 3 bps on the week.

With insurance companies and pension funds typically heavy buyers of 30 yr paper, it’s not as an effective measuring stick of market sentiment compared to the 10 yr and the short end auctions. The recent uptick in yields seems more in response to the rise in Europe post French vote than any positive feel on US economic data. The US Citi Surprise index sits today at -19.2 from -18.2 last Friday.
John here again. All that was just ones day’s output for The Boock Report. But it’s not simply the length – these are relatively short articles. It’s more the density. You could spend hours teasing out all the implications of Peter’s analysis.
Spending hours on this sort of analysis is exactly what most people shouldn’t do, of course. Certainly not every day. It tends to have a kind of paralyzing effect. With Peter’s help I can spend 5–10 minutes and understand all the key data flow that’s happening on a given day. And he does this every day. And has been doing it for years. He has an encyclopedic knowledge of the detail behind every bit of data that comes out.
What makes me particularly lucky is that I have at least a dozen Peters in my life. I have become friends with most of them over the years, and they are my “distillers” of information.
Then there are another dozen or so writers that I read for their thoughtful insights. They too have a keen understanding of how data translates into real-world developments. There is a lot of knowledge available out there, but wisdom – really good thinking – is a rare commodity.
And then, too, the project of researching and writing a book on what the world will look like in 20 years has been an enormous help for my thinking. The project has become something of a fetish for me. I really am compelled to get a grasp on how things are changing. Let me tell you, my views on how the future will develop have changed over the last five years, and not all for the better. I’m increasingly concerned about what I’m calling the Great Reset.
I see my role, as it has developed over the years, as a processor of information who shares an in-depth and hopefully authentic view of “what it all means.” And by authenticity I mean that I’m trying not to spin the data or use it to promote some particular worldview. I do, of course, have my own evolving worldview, and it does show up here and there in these letters, but I try to make sure that I’m reading and talking and thinking on as many sides of the issues as possible.
I try to take all the information that comes at me from the firehose and intuit how it’s all connected. I often have friends tell me that one of the things they like most about my writing is how I pull together so many sources and introduce them to so many new ideas and people.
In addition to the sources I’ve mentioned above, there are perhaps another half dozen people whom I have come to respect over the years as connoisseurs and conduits of information. When they send me something to read, I pay attention. Can I always get around to reading what they send? No, but I try hard. Because the world is getting more and more complicated, and finding that wisdom, that sensible path forward, seems to be getting harder. My job is to try to make it easier for you.
Yes, “drinking from a firehose” is a pretty good metaphor to describe the information flows hitting investors today. Get an inch too close and the pressure will blow your head off. But here’s the thing: You really, really need a firehose in certain situations. Most houses, most of the time, are not going up in flames. But if yours is, you want a firehose on the scene as fast as possible.
By analogy, most days in the financial markets don’t require any action from most investors. But once in a while things burst into flames and you need a firehose. In those situations, Peter Boockvar has a pretty good one. You should visit his website and get a free trial. Then subscribe if it fits your needs – or come back later when you smell smoke.
The Strategic Investment Conference is again sold out, although there are a few spots that always turn up at the last minute . If you can make it, we’ll be glad to see you.
As noted above, Peter will be speaking at SIC, along with two dozen or so equally talented financial and geopolitical experts. SIC is itself a kind of firehose, delivering widsom in controlled bursts. It’s a chance to escape from the daily headlines and refocus on larger trends. And we have a lot of fun, too.
SIC equips you to take advantage of the massive shifts that are destabilizing our world. Change brings risk – but also opportunity for those who know where and how to look.

I really wish every single one of my readers could be with us in Orlando. If you can’t, the next best thing is our SIC Virtual Pass. If you order now at the early-bird price, you’ll get…
• 22 hours of audio sessions packed with insights and recommendations from world-renowned experts
• All the slide presentations from SIC 2017, brimming with actionable investment ideas
• The SIC 2017 highlights video
• Transcripts of every speech, presentation, and on-stage discussion at SIC 2017
I find the written transcripts particularly useful. We have actual humans listen to the sessions and type them out verbatim for you, with a little editing for clarity. It takes a few days extra to prepare these, but then you can browse through them at your leisure.
The Virtual Pass is only $350 if you pre-order before the conference. The price will go up afterward, so now – with SIC just a week away – is the time to move on this. Click here for more information and to place your order.
Orlando, Washington DC, St. Thomas, and SIC 2017
My next trip will be to the Strategic Investment Conference, May 22–25 in Orlando. On the 26th, Shane and I fly up to Washington DC to be with Neil Howe and bride Gisela at their wedding. And in late June Shane and I will fly to St. Thomas for a special occasion and a week of vacation.
I was reminded this week just how critically important it is to make sure you’re surrounded with good people. My teams at both Mauldin Economics and Mauldin Solutions really did jump into the breach this week and pick up the slack when I needed them to. I have an amazing group of people who work with me, and I’m totally grateful for all they do. In a world where business is changing so fast, my teams not only adapt to the changes but also respond to those special situations that crop up from time to time. It seems that one of my really lucky gifts is to be able to pick great partners to work with.
My twin daughters, Amanda and Abigail, are coming in later tonight from Tulsa, and then some of the kids will be coming over even later to all just hang out. And with that I think I’ll hit the send button.
Your thinking I’ll turn off the firehose tomorrow (at least for a day) analyst,
John Mauldin

John Mauldin
subscribers@MauldinEconomics.com
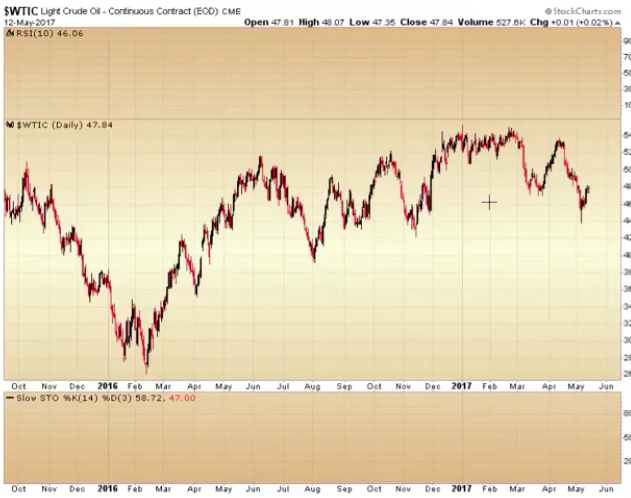
The next big trending move will occur in the energy markets. All the technical and cyclical signs are in place to suggest a major bottom is forming. In the precious metals market we have the exact opposite setup. This video will clarify how these two markets are likely to behave in the next several months.
https://blog.smartmoneytrackerpremium.com/

1. Gold: A Tsunami of Selling
A chain reaction is forming the last great gold stock buying opportunity of the decade, says Lior Gantz, editor of Wealth Research Group.
2. Is Canada The Next Hot Money Victim?
One of the interesting things about the Great Recession was how Canada’s financial system sailed through it largely unscathed. Its banks were regulated wisely and behaved prudently, its citizens avoided the extreme stupidity of their credit-addicted neighbors to the south, and its government refrained from doubling its debt every eight years.
But instead of Americans learning from Canada, Canadians appear to have concluded that we had it right after all.
2. The Oracle Speaks … and Here’s What We Learned
Over the weekend, the annual Berkshire Hathaway shareholder meeting took place, an event sometimes described as the “Woodstock for Capitalists.”
This event always generates a lot of press, and this year’s event was no exception. Here are a few of what I think are the most-interesting takeaways from Berkshire meeting.

-
I know Mike is a very solid investor and respect his opinions very much. So if he says pay attention to this or that - I will.
~ Dale G.
-
I've started managing my own investments so view Michael's site as a one-stop shop from which to get information and perspectives.
~ Dave E.
-
Michael offers easy reading, honest, common sense information that anyone can use in a practical manner.
~ der_al.
-
A sane voice in a scrambled investment world.
~ Ed R.
Inside Edge Pro Contributors

Greg Weldon

Josef Schachter

Tyler Bollhorn

Ryan Irvine

Paul Beattie

Martin Straith

Patrick Ceresna

Mark Leibovit

James Thorne

Victor Adair