Timing & trends

Eerie Calm Shrouds Markets

calm
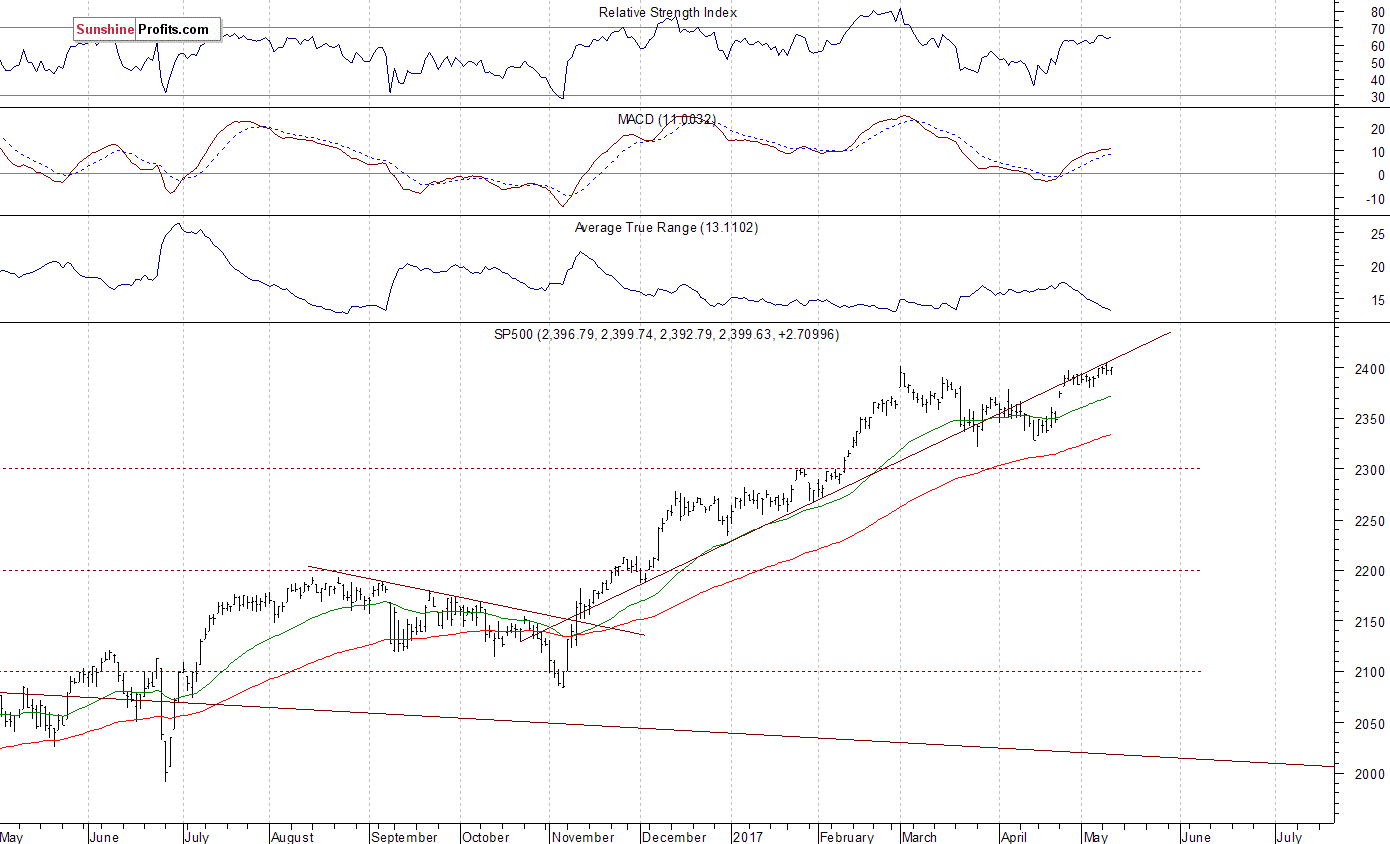
The VIX, the volatility  of the S&P 500, is sometimes touted as a “fear index.” Today is it extending its push below 10%, to fall to its lowest in nearly a quarter of a century.  
 
There has been four (Finland, Austria, the Netherlands, and France) successive European election that did not produce a victory for the euro-skeptics, who want to leave either the EU or EMU or both.  In Germany, the AfD has imploded and may be lucky to be represented in the Bundestag after the national elections in September.  A few months ago, some were talking about the possibility that Merkel is defeated in her bid for a fourth term as Chancellor.  Merkel and the CDU have done well in the state elections, and will likely do well in this weekend’s contest in NRW, the most populous German state.  
 
Three-month implied volatility in the euro, a common benchmark has broken below 7% to trade at its lowest level since late 2014.  The low since at least 1999 was set in 2014 near 4.75% and besides briefly in 2007, it has not traded below 5%.    The fact that volatility has come off suggests participants are less worried about macro-events and in terms of the spot are anticipating range trading.  
 
The risk-reversal (skew in the pricing of puts and calls equidistant from the money, in this case, 25 delta)  has steadily moved to reduce the premium that is paid for euro puts.  In February, the premium for (three months) puts over calls swelled to more than 3%.  This was the most in five years. The premium fell and today stands near  0.25%.   Calls were briefly at a premium last February for the first time since 2009.  
 
The yen, like the VIX, is often thought of as some sort of fear measure.  Yet to think of the yen as a safe haven may be misleading.  When anxiety is running high, and the pendulum of market sentiment swings toward fear from greed, global investors are not rushing to buy Japanese stocks or bonds.  
 
Instead, two things happen.  First, the US Treasury market is the safe haven.  Investors do in fact flock to the depth, breadth, and security of the US Treasury market.  This exerts downward pressure on US interest rates and weakens the yen through the differential.  Second, often in such anxious moments, Japanese investors who typically exports their savings, stop doing so.  Given Japan’s current account surplus (driven, incidentally, by investment income (e.g., coupon payments, dividends), without the export of savings to recycle the inflows, the yen “naturally” rises.  
 
In any event, the yen has been weakening steadily since the middle of April.  On April 17, the dollar bottomed in front of JPY108.   The US 10-year yield bottomed the next day near 2.16%.  The dollar poked through JPY114.00 for the first time since the Federal Reserve hiked rates in the middle of March.  The dollar has punched through the downtrend line from the year’s high and March highs to approach the 61.8% retracement objective of this year’s decline (~JPY114.65) 
 
Three-month implied yen volatility is a little firmer today after reaching its lowest level in more than a year yesterday a little ahead of 8.0%.  The correlation between the implied yen volatility and the VIX (percentage change 60-day rolling basis) is near 0.35 today, the highest so far this year.  
 
Looking at the put-call skew, one sees that the premium for dollar puts has been sharply reduced since the end of February when it reached 2%.  The skew is now less than 0.5%, the least since late January.  Historically, dollar puts (yen calls) often trade a premium.  The thought was that Japanese corporations who have dollar receivables hedge in the options market by buying dollar puts (yen calls).  One thing the options market may be telling us is that participants are less concerned about a weaker dollar.  
 
The price of gold has fallen for the past three weeks.  With today’s losses, the yellow metal is back to levels seen in mid-March when the Fed last hiked.  It fell through the 200-day moving average last week ($1250) and appears to be making a decisive break of the 100-day moving average (~$1224). Gold appears headed toward a test on the $1180-$1210 area, which may help shape the medium term view.  
 
One need not be a hardcore contrarian or an options trader to take notice of the markets’ calm.  Minsky warned that due to the perverse dynamics and incentive structure, stability could itself can fuel instability.   The French and UK elections next month are interesting but unlikely to shake up investors.    Success is an aphrodisiac, and the former Socialist Macron is drawing candidates that want on his banner.  In the UK there is little doubt that May will lead the Tories into victory.   The German election in September is Merkel’s to lose.  
 
Many observers seem to recognize that Italy’s election next year may be the next important European test.  However, it is a year away.  Perhaps Italian banks are the “ultimate” risk asset.  An index of Italian bank shares is up by more than a third since the end of February.  Yesterday, it reached its highest level since April 2016.  
 
Geopolitics can always come back to bite.  Consider that just yesterday, for the first time this year, a Russian jet violated Estonia’s airspace.  Reports indicate that it did so around half a dozen times last year.  Russia’s foreign policy agenda may not be dependent on who occupies the US White House. Recall, Russia invaded Georgia in 2008 when George W Bush was president.  General Eisenhower was president when the Soviet Union invaded Hungary.   Johnson, who had projected US power in Vietnam, the Middle East, and the Caribbean when the Soviet Union invaded Czechoslovakia.  
 
Russia’s asymmetrical warfare has been successfully deployed on what it calls the near abroad.  It borders.  It has harassed the Baltic States, like Estonia.  The airspace incursions are a subject of diplomatic protests, but not an escalation of tensions.  Where is that line?  Russia can find a small border town in a Baltic country that the majority of people speak Russian and may even have Russian passports.  Isn’t this a logical “next move” in the chess game Putin is playing in central and eastern Europe?  
 
Meanwhile, the Trump Administration is pursuing less antagonistic policies toward China. Remember, after the electoral college victory, Trump spoke to the president of Taiwan, and even questioned the US one-China policy. Trump has not levied a 25% tariff on Chinese goods.  China has not been cited as a currency manipulator.  The US may also be backing off from challenging China in the South China Sea.  The New York Times reported that the Department of Defense had rejected the last three proposals for freedom of navigation operations.  These essentially are a display of US force in waters that some countries, such as China, claim are theirs.  
 
The point here is to note the extremely low levels of anxiety in the market.  The VIX, US Treasuries, gold and the volatility of the yen and the euro, all are pointing in the same direction.  There is not the reason it cannot continue, and this should not be read as a call that the Sky is Falling.  It is meant to show how extreme the calm is, and remind ourselves, that large moves typically do not happen when volatility is high, and investors are anxious and nervous.  It happens when things are calm, and investors see TINA (there is no alternative).   Geopolitics and the divergence of policy, and asset/liability and duration mismatches have not gone away.   It is a reminder that we are often lulled into complacency just before being shocked by how treacherous things really are.  

The Top Producing Diamond Mines In 2016

While diamond industry experts warn that demand is expected to outstrip supply as early as 2019, the largest mines keep producing the coveted rocks at full steam.

Here are last year’s top 10 diamond mines in terms of output and value, based on data compiled by expert Paul Zimnisky.

dia1005A

(Image courtesy of De Beers Group.)

1. Jwaneng, Botswana

Produced 11,975,000 carats, worth $2,347 million
Jwaneng, the richest diamond mine in the world, is located in south-central Botswana in the Naledi river valley of the Kalahari. It’s 2 kilometres across at its widest point and patrolled by colossal 300-tonne trucks that labour up the terraced slopes.
Nicknamed “the Prince of Mines”, Jwaneng was opened in 1982, as the diamond trade helped Botswana go from being one of the world’s poorest countries to one of Africa’s wealthiest.

Sunrise at Yubileyny open-pit. (Image by Ruslan Akhmetsaphin | ALROSA.)

2. Jubilee, Russia Produced 9,231,000 carats, worth $1,431 million
Belonging to ALROSA, the world’s top diamond miner by output in carats, the Jubilee mine (also known as Yubileinaya), has been in production since 1989. It’s among the world’s biggest diamond mines by area.

Image courtesy of Diamond Producers Association

3. International, Russia

Produced 3,948,000 carats, worth $829 million
Also known as Internatsionalny, this underground mine has been in operations since 1999. ALROSA estimates the deposit will run out of diamonds by 2022.

Image courtesy of Diamond Producers Association

4. Orapa, Botswana

Produced 7,931,000 carats, worth $753 million
The Orapa mine is the ninth largest diamond mine in the world by reserve and the world’s largest mine by area. It has been in production since 1971. It’s owned by Debswana, a joint venture of De Beers and the Botswana Government.
Currently Orapa is mining at a depth of 250 metres and is expected to reach 450 metres by 2026.

Aerial view of Debmarine’s Debmar Atlantic vessel, which mines diamonds off the coast of Namibia. (Image courtesy of Diamond Producers Association)

5. Debmarine, Namibia

Produced 1,169,000 carats, worth $585 million
De Beers’ Debmarine uses a fleet of five specialized marine mining vessels to screen material recovered from the ocean floor.
These deposits are then airlifted by helicopter for further processing on shore. It’s Namibia’s largest diamond producer, accounting for 70% of the country’s output of these stones.

(Image courtesy of Wenco)

6. Catoca, Angola

Produced 6,700,000 carats*, worth $570 million
This diamond mine is the world’s fourth largest. It’s owned by a consortium of international mining interests, with Endiama (the state mining company of Angola) having a majority stake.
* = Figure not officially confirmed

(Image courtesy of ALROSA)

7. Nyurbinskaya, Russia

Produced 5,001,000 carats, worth $565 million
The Nyurba Mining and Processing Division (MPD) is one of the youngest enterprises of ALROSA. It operates at the Nakyn ore field, which includes the Nyurbinskya and Botuobinsky open-pits, and two same-name alluvial placers.

The impressive Diavik. (Image: Rio Tinto.)

8. Diavik, Canada

Produced 6,658,000 carats, worth $539 million.
Operated by Rio Tinto, which owns 60% of the mine, Diavik began production in 2003 and has an annual output of some 6-7 million carats of predominantly large, white gem-quality diamonds. It’s Canada’s largest diamond mine in terms of carat production. Dominion Diamond owns the remaining 40%.

Aerial view of the Ekati mine, 300 kilometres northeast of Yellowknife. (Image: Dominion Diamond Corporation)

9. Ekati, Canada

Produced 5,200,000 carats, worth $463 million
The Ekati Diamond Mine (named after the Tlicho word meaning “fat lake”) is Canada’s first surface and underground diamond mine. Located about 300km north-east of Yellowknife, near Lac de Gras in Canada’s North-West Territories, is run by Dominion Diamond Corporation (DDC).

(Image courtesy of ALROSA)

10. Mir, Russia

Produced 3,191,000 carats $463 million
Although open pit mining at this operation ended in 2004, ALROSA built a series of underground tunnels, which have continued to yield high-quality rough diamonds. The remaining pit is so huge it creates a vortex potentially strong enough to suck helicopters into its depths.

By Cecilia Jamasmie via Mining.com

Stock Trading Alert: Stocks Fluctuate Along Record Highs – Topping Pattern Or Just Pause?

Sent to subscribers on May 11, 2017, 6:56 AM.

Briefly: In our opinion, speculative short positions are favored (with stop-loss at 2,410, and profit target at 2,200, S&P 500 index).

Our intraday outlook is bearish, and our short-term outlook is bearish. Our medium-term outlook remains neutral, following S&P 500 index breakout above last year’s all-time high:

Intraday outlook (next 24 hours): bearish
Short-term outlook (next 1-2 weeks): bearish
Medium-term outlook (next 1-3 months): neutral
Long-term outlook (next year): neutral

The main U.S. stock market indexes were mixed between -0.2% and +0.1% on Wednesday, extending their short-term fluctuations, as investors took short-term profits off the table. The S&P 500 index remains close to its Tuesday’s new all-time high at the level of 2,403.87. The index has broken slightly above the March 1 high on Tuesday, before closing lower by 0.1%. The Dow Jones Industrial Average remained below the level of 21,000, and the technology Nasdaq Composite index continued to trade above the level of 6,100. Will the broad stock market index continue its eight-year-long bull market? The nearest important level of support of the S&P 500 index is now at 2,390, marked by short-term local low. The next support level remains at 2,375-2,380, marked by the April 25 daily gap up of 2,376.98-2,381.15. The support level is also at 2,355-2,370, marked by the April 24 daily gap up. On the other hand, the nearest important level of resistance is at 2,400-2.405, marked by new record high, among others. We can see some volatility following six-month-long rally off last year’s November low at around 2,100. Is this a topping pattern before medium-term downward reversal? The uptrend accelerated on March 1 and it looked like a blow-off top pattern accompanied by some buying frenzy. The S&P 500 index is currently trading along its medium-term upward trend line, as we can see on the daily chart:

1

Expectations before the opening of today’s trading session are slightly negative, with index futures currently down 0.1-0.2%, as the market extends its short-term consolidation. The main European stock market indexes have been mixed so far. Investors will now wait for some economic data announcements: Initial Claims, Producer Price Index, Core Producer Price Index at 8:30 a.m. The market expects that the Producer Price Index along with Core Producer Price Index grew 0.2% in April. The S&P 500 futures contract trades within an intraday downtrend, as it retraces some of its yesterday’s late-session advance. The nearest important level of support is now at around 2,385-2,390, marked by previous local highs. The next support level remains at 2,375-2,380, marked by previous short-term local lows. The support level is also at 2,365, marked by previous consolidation. On the other hand, resistance level is at around 2,400-2,405, marked by March topping consolidation, and the new all-time high slightly above 2,400 mark. Will the market break above two-month long consolidation? Or is this just another upward correction? We can see some medium-term negative technical divergences, but will they lead to a downward correction?

S&P 500 futures contract - S&P 500 index chart - SPX

The technology Nasdaq 100 futures contract remains relatively stronger than the broad stock market, as it is currently trading just 0.4% below its Tuesday’s new record high of around 5,690, following better-than-expected quarterly corporate earnings releases. The nearest important support level is at around 5,650, marked by previous resistance level. The next support level is at 5,630-5,640. The support level is also at 5,600, marked by previous short-term consolidation. On the other hand, level of resistance is at around 5.690-5,700. There have been no confirmed negative signals so far. However, we can see short-term overbought conditions:

Nasdaq100 futures contract - Nasdaq 100 index chart - NDX

Concluding, the S&P 500 index reached new all-time high at the level of 2,403.87 on Tuesday. However, it failed to continue short-term uptrend, as it gained just 0.1% on Wednesday. The broad stock market is still relatively weaker than the record-breaking technology Nasdaq Composite index. Will the broad stock market continue towards more new record highs? The index is currently trading along its six-month-long medium-term upward trend line. There have been no confirmed negative signals so far. However, we still can see medium-term negative technical divergences. Therefore, we continue to maintain our speculative short position (opened on February 15 at 2,335.58 – opening price of the S&P 500 index). Stop-loss level is at 2,410 and potential profit target is at 2,200 (S&P 500 index). You can trade S&P 500 index using futures contracts (S&P 500 futures contract – SP, E-mini S&P 500 futures contract – ES) or an ETF like the SPDR S&P 500 ETF – SPY. It is always important to set some exit price level in case some events cause the price to move in the unlikely direction. Having safety measures in place helps limit potential losses while letting the gains grow.

To summarize: short position in S&P 500 index is justified from the risk/reward perspective with the following entry prices, stop-loss orders and profit target price levels:

S&P 500 index – short position: profit target level: 2,200; stop-loss level: 2,410
S&P 500 futures contract (June) – short position: profit target level: 2,197; stop-loss level: 2,407
SPY ETF (SPDR S&P 500, not leveraged) – short position: profit target level: $220; stop-loss level: $241
SDS ETF (ProShares UltraShort S&P500, leveraged: -2x) – long position: profit target level: $15.47; stop-loss level: $12.98

Thank you.

Paul Rejczak
Stock Trading Strategist

Gold: A Tsunami of Selling

A chain reaction is forming the last great gold stock buying opportunity of the decade, says Lior Gantz, editor of Wealth Research Group.

Gantz5-7-17-2 1.jpg

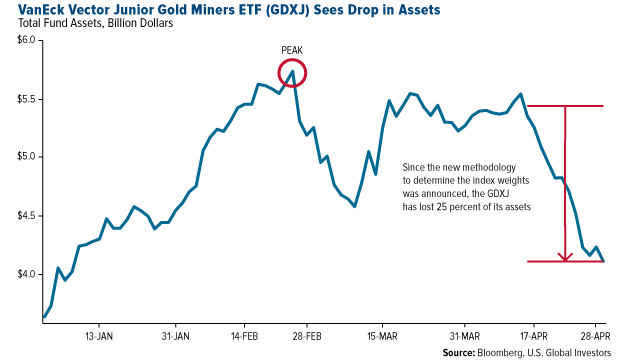
I want you to take a close, hard look at this chart: 

Large Outflows from Gold ETF

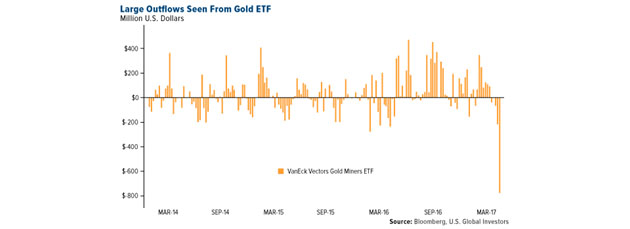
The GDXJ (VanEck Vectors Junior Gold Miners ETF) is the ETF that has become one of the world’s most popular investment vehicles for gold investors over the last decade.

The idea behind ETFs is luring many investors by allowing you to buy and sell broad baskets of stocks with a single trade.

It’s a one-click way to buy a basket of small-cap gold exploration, development and production companies, and from January 2010 to May 2017, the market capitalization of the GDXJ grew by 480%. 

Since it became so popular, a technical challenge has emerged: by definition, junior gold stocks don’t have large market caps and their shares don’t have tremendous trading liquidity. The GDXJ grew in popularity so much that it had too much cash and not enough places to put it.

Here’s where this becomes interesting. I know many precious metal investors who are hurting big time right now because they missed the phenomenal move between January and August of 2016 and have been seeing nothing but a massacre ever since. 

My gut and the research I’ve put together suggests that we are about to undergo a frenzy sell-off, something that will cause some gold investors (who have too much of their net worth weighting in gold-related stocks) to feel like puking, but for those who prepare, I am telling you that this is your “Bitcoin at $3” moment.

GDXJ Sees Drop in Assets

The sell-off has already begun, and it’s due to no fundamental reason at all—it is a “forced selling” based on technical issues.

Many junior gold stocks are Canadian. As soon as an entity owns more than 20% of a Canada-listed company, regulations restrict its trading ability and make holding the position a bureaucratic mess.

Because the ETF got so popular and the small-cap miners are truly a tightly knit group of companies that are not collectively worth that much, the ETF couldn’t find ways to deploy cash. As a result, it now has to rebalance its components.

This rebalancing is already underway, with hedge funds, short-selling funds and retail investors all looking for a way to either make a killing due to this selling avalanche or protect their holdings from further declines.

The rebalancing is set for June 16.

Between now and then, expect significant volatility in all the sub-$1 billion market cap junior and mid-tier gold companies. Shares of companies will be sold by the GDXJ so the new ETF can become a “large mid-tier to small major” gold ETF.

The Chain Reaction: Margin of Safety Will Be at All-Time High 

Margin of Safety is the most important term in finance, according to Warren Buffett and his mentor, Benjamin Graham. Essentially, the idea is that no investment—and certainly no trade—are bulletproof, therefore the cheaper you can buy it, the better. 

It goes deeper than that: a more effective use of Margin of Safety is contrarianism.

This means that you’re buying when assets are out of favor (and therefore cheap), with the certainty that demand will be increasing later.

But the most effective use of Margin of Safety is buying so cheap that the company actually trades at or below its liquidation value.

The GDXJ is going to dump close to $4 billion worth of junior mining shares—that’s a massive amount.

We all know how the market reinforces our most innate emotions, and as this forced regulatory selling commences, panic selling will ensue.

Gold stock investors will hit stop losses and dump shares, which will create more selling.

What may be in the cards here is a self-reinforcing cycle of forced, ignorant selling that will feed on itself and cause a panic in some of the world’s best small-cap gold stocks. It could be a chain reaction, and again, this is coming on June 16, right when the Federal Reserve next announces an interest rate decision.

Wealth Research Group’s Strategy
We follow a proprietary due-diligence process in order to sift through the hundreds of publicly traded companies.

We are currently reviewing all the companies that the GDXJ will be forced to sell. I can already tell you that I have personally taken profits on a number of dividend-paying stocks and liquidated a real estate holding in order to be cashed-up. 

The reason I did this is because at the bottom, after some companies’ stock prices basically go back in time to levels lower than 2015’s historical lows, guys like my partners and I—or funds like Marin Katusa’s, or Sprott Asset Management and Peter Schiff’s Euro Pacific—and other legendary investors in the space will be making our most aggressive move yet.

Gold is not in a bubble, nor has it displayed any “bubble-like” golf stick-shaped chart.

Instead, it’s a highly depressed market where demand is high, but concentrated short positions by large funds who are long the S&P 500 are absolutely creating havoc for the retail investor. As I said last week, once the entire investment community begins taking profits after a nine-year bull market, the over-leveraged short positions they currently hold in mining shares will be liquidated, and you will most likely be among the rare breed of investors that get to experience a 100-fold move in a stock you own.

At the moment, a total of 52 companies are estimated to be under excessive liquidation by the GDXJ, and we’re preparing for this as we speak.

You need to make a decision—one that will define you regarding gold stocks from here on out. You need to be absolutely sure that you can stomach high volatility, which will test every fiber of your being, because buying when Margin of Safety is at an all-time high is not as easy as it sounds. It requires nerves of steel, and most of all, it entails forgetting all about the pain you endured (if you endured any) by mismanaging positions in the past or getting the timing wrong.

There’s no escaping this—it will get bloody before we get our chance to create dynasty money.

Now is the absolute ideal time to learn exactly how industry insiders are finding the best values.

Lior Gantz, an editor of Wealth Research Group, has built and runs numerous successful businesses and has traveled to over 30 countries in the past decade in pursuit of thrills and opportunities, gaining valuable knowledge and experience. He is an advocate of meticulous risk management, balanced asset allocation and proper position sizing. As a deep-value investor, Gantz loves researching businesses that are off the radar and completely unknown to most financial publications.

Related Articles


Want to read more Gold Report articles like this? Sign up for our free e-newsletter, and you’ll learn when new articles have been published. To see a list of recent articles and interviews with industry analysts and commentators, visit our Streetwise Interviews page.

Disclosures:
1) Statements and opinions expressed are the opinions of Lior Gantz and not of Streetwise Reports or its officers. Lior Gantz is wholly responsible for the validity of the statements. Streetwise Reports was not involved in the content preparation. Lior Gantz was not paid by Streetwise Reports LLC for this article. Streetwise Reports was not paid by the author to publish or syndicate this article. 
2) This article does not constitute investment advice. Each reader is encouraged to consult with his or her individual financial professional and any action a reader takes as a result of information presented here is his or her own responsibility. By opening this page, each reader accepts and agrees to Streetwise Reports’ terms of use and full legal disclaimer. This article is not a solicitation for investment. Streetwise Reports does not render general or specific investment advice and the information on Streetwise Reports should not be considered a recommendation to buy or sell any security. Streetwise Reports does not endorse or recommend the business, products, services or securities of any company mentioned on Streetwise Reports.

Charts provided by Wealth Research Group


17 Reasons To Avoid Gold

(Warning: Satire and sarcasm alert!)

Central bankers are managing paper currencies for the benefit of the people, not the financial and political elite. Consequently consumer prices are stable and there is no reason to own gold as protection from currency devaluations.

Time Magazine confirmed that Greenspan, Rubin and Summers saved the world in 1998. Bernanke did it again after the last crisis. In 2012 he was called “The Hero” by The Atlantic.

Screen Shot 2017-05-11 at 8.26.43 AM

Our economic world is now stable and secure and central bankers will not need to “save” it again. Because we live in a safe world, there is no need for gold.

China, India and Russia have acquired a massive stockpile of gold bullion, (not the paper stuff) while the western world has sold gold to them. Frankly, who cares why the Chinese are buying gold or what they anticipate?

Gold will trade under $700 because it is a useless commodity.

The U.S. official debt is $20 trillion and unfunded but promised liabilities are $100 – $200 trillion, but not to worry… (Devaluation and default are viable options but officials don’t discuss either in polite company.)

Central banks have created, from “thin air,” about $10 trillion since the financial crisis, but that was “necessary.” Believe what central bankers announce and trust their good intentions…

Per James Rickards, “The Chinese credit bubble is a ticking time bomb. That bubble is primed to explode with or without anything Trump does.” As long as China exports telephones and TVs to us, who cares about their credit bubble? Why would their bubble impact the western world? Not to worry…

Politicians and central bankers have told us our paper currencies are strong and well managed so we should ignore gold. Would they lie to us?

Per Adam Taggart: “… we now live under a captive system. From our retirement accounts, to our homes, to the laws we live under – the banks control it all. And they run the system for their benefit, not ours.” But the “official story” is that banks are helpful, good for the economy, “doing God’s work” and are anxious to increase our indebtedness. Probably it’s true… Best to ignore Taggart and trust the banking cartel…

Politicians work for the benefit of the voters, not the corporations who own them. Those promised but unfunded benefits, global wars, ever-increasing medical costs, and depreciating currencies will sort themselves out, for the ultimate benefit of the voters. Probably…

From Future Money Trends (Dan Ameduri): “What a total Ponzi scheme it is with central banks buying each other’s bonds, buying their own government bonds, and buying stocks…It’s pure lunacy – what a total scam.” Create currency from “thin air” and buy stocks with it. Sounds fantastic! The Swiss National Bank owns over $60 billion in stocks, but that is a good thing, right? No downside, I’m pretty sure…

U.S. government spending increases every year, faster than revenues. The national debt increases more rapidly. Pretend the U.S. economy can survive $20 trillion in official government debt in 2017. Will it survive $40 trillion in debt in 2025? How about $80 trillion in debt in 2033-34? (9% increase each year for over a century) Not to worry! Greenspan, Rubin, Summers and Yellen will save us…

Given the successes of the War on Poverty, War on Drugs, War on Terror, Vietnam War, Afghanistan War, and other wars, we should expect great things from the Syrian War, expanded Middle East Wars, Korean War 2.0, and any other wars created as distractions and justifications for massive spending.

Hope and Change will Make War Great Again!

Fortunately we know the financial and political elite have implemented effective fiscal and monetary policies to maintain high employment, no inflation, and strong moral values. Our economies are intelligently managed for the benefit of everyone. With no hints of oncoming catastrophes, currency crashes, corrections in over-valued stocks, or other disturbances … we should feel financially safe and secure.

Student loan and sub-prime auto loans total less than $3 trillion, so not to worry… Real estate, currency, and bond bubbles are no big deal, and the U.S. pension crisis is well under $10 trillion, so nothing to see here…

A crisis/crash can occur at any time but might be delayed indefinitely:

1977: Inflation ramping up, American prestige and bonds flopping.

1987: Stock market crash

1998: Long Term Capital Management crash

2008: Mortgage, derivatives and stock markets crash

2017-2018: Something ugly this way comes!

Conclusions: (Sarcasm alert!)


  • Things are not just good, they’re GREAT!
  • There is no need for gold (or silver) as insurance against financial and currency destruction. Everything is great – review this article if not entirely convinced.
  • Paper currencies, over valued stock markets, multi-century lows in most interest rates, negative interest rates on sovereign bonds, and excessive debts have created disastrous consequences in the past, but this time will be different … I’m pretty sure.
  • Forget gold, sound economic principles, balanced budgets, sane economies, and skepticism about the motives of politicians and central banks. It will turn out peachy … really!

***


  • Alternative in case any of the above doesn’t fit your outlook: 


Read my short book explaining through 44 graphs why we need gold and silver as financial insurance. “Buy Gold Save Gold! The $10K Logic.”

Gary Christenson

The Deviant Investor