
Currency
Quotable
“He who establishes his argument by noise and command shows that his reason is weak.”
–Michel de Montaigne
Commentary & Analysis
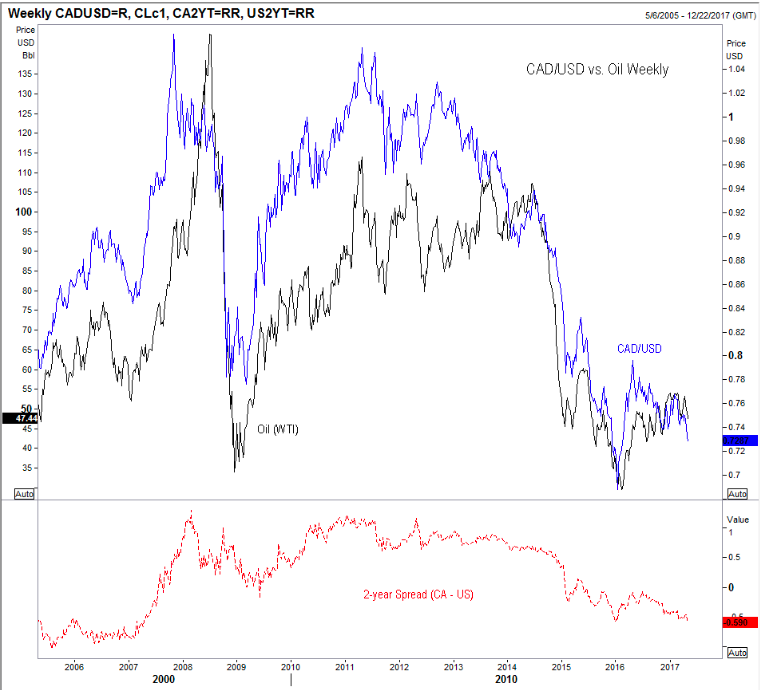
Will Aussie follow Cad’s path – down against the dollar? I don’t know, but willing to bet…
My editor’s note is this: I realize correlation isn’t causation. I realize correlations can change at any moment because every moment in the market is unique. I realize it isn’t always easy to determine which variable leads and which follows in a seeming correlation; it may be neither as both may be driven by some other narrative/variable/rationale, etc. But sometimesdivergences in prior correlations which have stood for a while can represent nice setups for a winning trade.
A divergence setup between CAD and Aussie may be in play.
On the next chart, we have overlaid CAD/USD (red line) on our Australian dollar weekly Wave chart; and have included the 2-yr yield spread AU-US in the bottom pane:
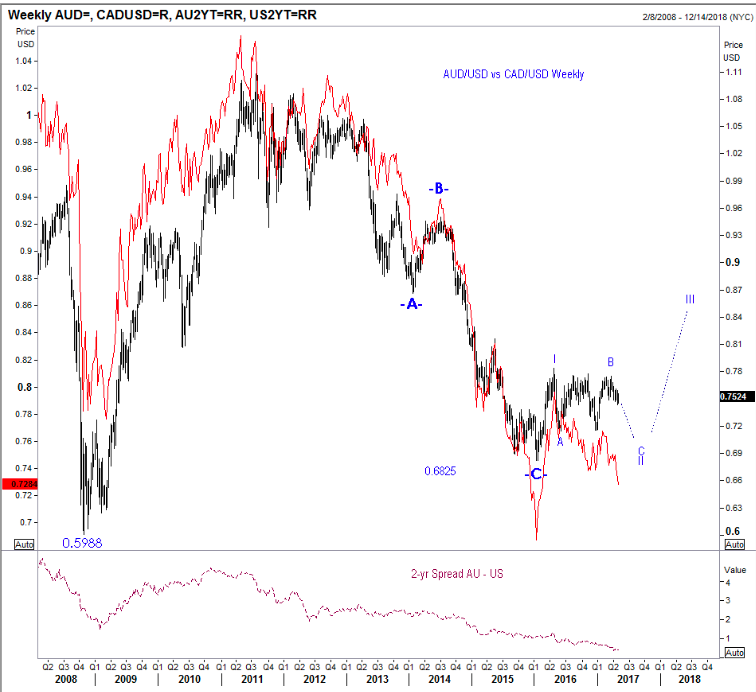
Note the relative weakness in CAD versus Aussie as compared to the US dollar. That is a divergence. It’s the same story on the yield spread; Aussie’s once dominate 2-year spread over the US has fallen from a high of around 4.6% when the Aussie peaked (1.1089) back on 8/12/2011 to 0.41 today. If the Fed meets current expectations, this spread will likely go negative in 2017.
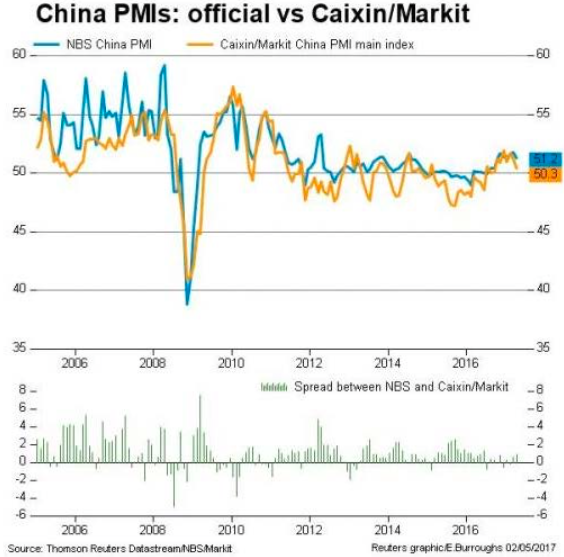
I say the same story because it seems the US Fed will be moving sooner than the Reserve Bank of Australia. And maybe today’s Chinese PMI news adds more validity to that expectation…
China’s April Purchasing Managers Index (PMI) was weaker than expected in April…if you compare the China PMI chart below to the AUD/USD weekly chart above, I think you will see a positive correlation there too.
We used this type of analysis to position for a decline in the Canadian dollar, establishing a put postion in our Currency Options Strategist service back on April 12th. So far so good. Our subscribers have pulled off half postiion gains on those puts for a133% profit and are still sitting on a 1⁄2 position now showing open gains of 167%. And yes. Our subscribers have added Australian dollar puts, just yesterday, hoping Aussie follows the path blazed by CAD lower.
Thank you.
Jack Crooks
President,
Black Swan Capital
772-349-6883/ Twitter: bswancap

 1. What Happened To Common Sense
A recent poll says a majority of Canadians don’t think Free Trade has benefited Canada. The numbers are compelling, access to 360 million US citizens, 131 million Mexicans in exchange for access to 35 million Canadians!
2. Know When To Hold Your Winners
Jesse Livermore, the tenacious trader immortalized in the 1923 investment classic Reminiscences of a Stock Operator, warned about pundits. He hated tips and claimed following them had lost him hundreds of thousands of dollars.
2. Gold Stock Cherry Picking Season
Gold and silver currently have a bit of a fundamentally and technically oriented “hangover”.

“How to make a million? Start with $2 million – and invest in gold stocks!” – The Maxims of Wall Street (revised for gold bugs).
What is by far the most dangerous and high-risk sector of the market? Gold stocks!
Recently, I spoke at a gold bug convention, and after my talk, I was surrounded by several doctors, lawyers and other professionals who confessed that they had lost 70% of their portfolios.
“How is that possible?” I asked. “The stock market is at an all-time high!”
“We listened to the doom-and-gloom talks from speakers at this conference five years ago,” they admitted. “We sold out of the stock market and bought mining companies promoted here at this conference.”
It was a double whammy. As the Dow hit new highs, the penny mining stocks collapsed. It reminded me of an old financial book I have on my shelf, Wiped Out. How I Lost a Fortune in the Stock Market While the Averages Were Making New Highs. How? By investing in the wrong stocks!
I asked them why they were still at the same conference.
They answered, “We are doubling down.”
After that conversation, I decided to look into the mining sector. It turns out that penny mining stocks are a disaster over the long term. As investment banker Jeff Phillips once said, “Most penny stocks are like burning matches. If you hold them long enough, you get burned.”
But that’s not all. I also learned that major mining companies are big-time losers too. Since the year 2000, the price of gold itself has risen fourfold, but the miners themselves are extremely volatile and have gone nowhere over the past 17 years. Look at the long-term chart for Barrick Gold (NYSE: ABX), Newmont Mining (NYSE: NEM) and Goldcorp (NYSE: GG). They look terrible.
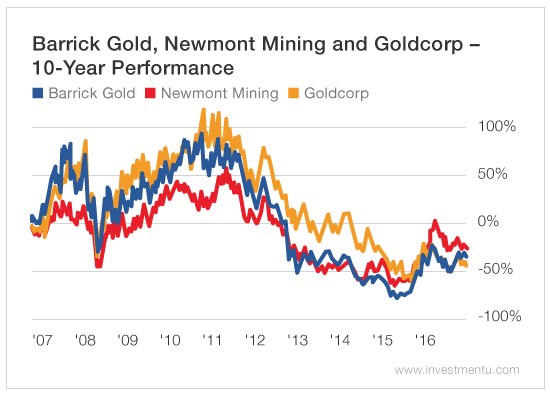
Sometimes they offer excellent short-term speculations, but if you keep them too long, you are bound to lose – just like playing craps or blackjack in Las Vegas.
I was the moderator of a financial panel at this conference and asked the experts, “Can you name a single large mining company that has made money for investors over the past 15 to 20 years?”
They couldn’t think of one. Moreover, none of them pay a sizable dividend like other more traditional, publicly traded companies like IBM, Microsoft, AT&T or Pfizer.
Adrian Day, an expert in mining companies, finally mentioned Franco-Nevada Corp.(NYSE: FNV). But, as he himself pointed out, Franco-Nevada Corp. is an investment firm that finances mining companies and is not a mining company per se. It has only 29 employees! Moreover, CEO David Harquail recently told an audience at the BMO Capital Markets mining conference that there’s no growth left in gold mining investment projects, and the company is gradually shifting to energy plays.
Gold vs. Stocks: No Contest!
Look at the Philadelphia Gold and Silver Index on the chart below. It’s been a disaster. Since January 1, 2001, the index has returned a total of 63.3%, while the SPDR S&P 500 ETF Trust has returned 104.5%. We should also count dividends – the S&P 500 pays more than 2% a year, while the Philadelphia Gold and Silver Index’s annual dividend is miniscule. In sum, over the past 16 years, the S&P 500 more than doubled the return of the Philadelphia Gold and Silver Index with considerably less volatility.
In the past 10 years, the Philadelphia Gold and Silver Index has lost 28.6%, while the S&P 500 has climbed 440%, not counting dividends

Why do gold stocks, both large and small, underperform? According to Dan Oliver, an expert with Myrmikan Capital in New York, almost all miners are excessively leveraged and overcapitalized with too much in debt and call options. They do very well during the boom phase, but during the inevitable crash, the debt financing becomes unpayable, and the gold equities collapse.
For these reasons, gold stocks, as a sector, are terrible investments and definitely not a good long-term way to build wealth. They are useful only as a short-term speculation.
The lesson is important: Investors beware! Most investors should avoid gold stocks like the plague. Gold and silver coins can be good investments over the long haul, but don’t be talked into buying gold stocks for the long term.
And think twice about attending a gold bug or “natural resource” investment conference loaded with doomsayers. Go ONLY if you are a high-risk speculator who can withstand a barrage of Armageddon scenarios. If you are an easily scared investor, it may be the most expensive conference you ever attend.
Good investing, AEIOU,
Mark Skousen
“Should You Invest in Gold Stocks?” The conference will run July 19-22 in Las Vegas. For more information, click here.

Just like the current market frenzy pushing Bitcoin to new all-time highs, the same sort of buying mania will also push the silver price to new highs. Even though the silver price and precious metals sentiment have fallen considerably, the market has no clue just how undervalued the shinny metal truly is.
Very few investors realize that the Dow Jones-Silver ratio back in 1981 was 50/1. Which means, 50 ounces of silver would buy the Dow Jones Index 46 years ago. Today, the Dow Jones-Silver ratio is trading above a staggering 1,200/1. Thus, it takes 1,200 ounces of silver to by the Dow Jones Index today as the ratio is nearly 25 times higher today than it was in 1981.
Of course, a large percentage of the silver price increase during the 1970’s was due to the Hunt Brothers acquiring a lot of the metal during the decade. However, a great deal of institutions came behind the Hunts and also bought silver during the latter part of the 1970’s. Lastly, we had the typical “Brain dead” public come in and buy at the top. It is so unfortunate that the public doesn’t understand long term investing or wealth preservation. Instead, they buy as much stuff on credit today and then worry about paying for it all tomorrow.
Bitcoin Hits New Highs While The Silver Price Continues To Languish
According to the article, Bitcoin Soars Above $1,600 On Relentless Japanese Buying Frenzy:
Four days ago we reported that bitcoin has surged above $1,400, hitting a new lifetime high, while rising above $1,500 on certain Chinese exchanges. Since then, bitcoin’s latest exponential rise has only accelerated, and moments ago the price of the cryptocurrency surged as high as $1,600 on the Coinbase exchange, rising as high as $1,655 on the troubled Bitfinex exchange.
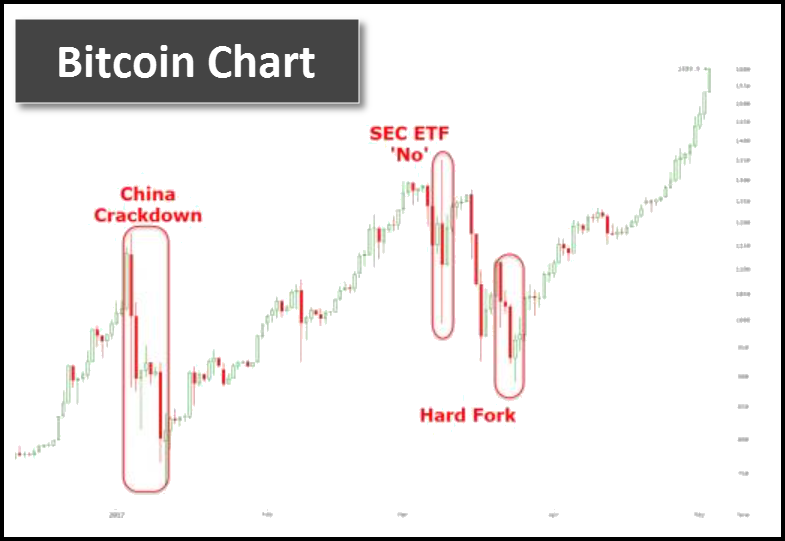
We summarized the ongoing bitcoin frenzy as follows on Monday: “just as the Chinese bubble frenzy in bitcoin is fading, it may be replaced with a new one, in which thousands of Mrs. Watanabe traders shift their attention away from the FX market and toward digital currencies” and added that “If the transition is seamless, there is no telling just how far this particular bubble can grow.”
The reason the price of Bitcoin is rising so much compared to the silver price… is quite simple. When more buying and money moves into Bitcoin, the price moves up much higher because the amount of Bitcoins outstanding are limited. However, when a great deal of buying comes into the Silver market, the Bullion banks, such as JP Morgan, can just add more contracts. So, the huge pressure heading into Bitcoin is released at much higher prices, while the pressure in the Silver Market is released by adding more and more contracts onto the exchanges. So, this caps the silver price and momentum.
That being said, silver is considerably undervalued compared to the Dow Jones Index presently. This is due to the massive amount of monetary printing and debt being funneled into broader markets. Unfortuantely, this highly leveraged debt-based markets won’t last for long.
Why? Because the falling oil price is gutting the entire system. Today, the oil price has fallen a whopping $2.30 to $45 a barrel. I can tell you, very few oil companies are making money at this price. Without cheap and rising oil production, the STOCK, BOND and REAL ESTATE MARKETS are DOOMED.
Dow Jones-Silver Ratio Will Move Back Towards 50/1
When the world was experiencing serious inflation in 1970’s, the Dow Jones-Silver Ratio was below 50/1:

We can see this if we look at the bottom left-hand corner of the chart. During the next 20 years, the Dow Jones-Silver ratio surged to a peak of 2,500/1 in 2001. When the silver price spiked back up towards $50 in 2011, the Dow Jones-Silver ratio fell to 300/1. Currently, it is trading at over 1,200/1.
Again, the reason the price of silver surged during the 1970’s was due to the tremendous amount of inflation in the oil price which impacted all commodities and precious metals. We must remember, when the oil price hit a high of $35 in 1980, silver reached a peak of nearly $50. However, when silver was trading at $49 in May 2011, the oil price was twice as high at $100.
Now, as I have stated several times, the price of oil will continue to trend lower in the future. This is due to the falling net energy and its value impact upon the economy. So, why do I forecast a much higher silver price rise if the oil price falls? It’s due to two reasons:
- The tremendous amount of debt in the world is propping up most STOCKS, BONDS & REAL ESTATE. Debt can only be kept elevated if there is abundant and cheap energy. As the U.S. and global oil industry starts to disintegrate, debt will implode… so will the value of most stocks, bonds and real estate. Investing looking to protect wealth, will move into gold and silver in a way never seen before in history.
- The Falling EROI -Energy Returned On Investment of oil means that the current way of extracting silver by the majority of the mining industry will no longer be commercially viable. Because most of the high ore-grade silver mines are gone, trying to extract silver the old fashion way, or with a lot less energy and technology means silver supply will plummet. With very little above ground investment silver in the world, this will cause more pressure to push the price even higher.
While I understanding the low paper silver price is frustrating by many investors, they need to understand that the current INSANE MARKET is not going to live for much longer. Using a massive amount of debt and monetary printing to keep things going was never a long-term solution. Now that the oil market is being gutted by a low oil price, this will help speed up the collapse of the financial system and economic markets.
Watch as more fireworks take place in China and the U.S. Markets. This will cause demand for goods and services to fall, thus impacting demand for oil and base metals. I see the price of copper, zinc and lead to continue falling as the markets really roll over. As the price of copper, zinc and lead decline, this will also gut the Base metal mining industry where 56% of global silver production comes from (13% comes from gold mining and 30% from primary silver mining).
When the buying mania from the Institutions, Hedge Funds, Retail and Physical investors comes in to the market, watch as the Dow-Jones-Silver ratio falls back towards 50/1… and the silver price hits a all-time new high.
Check back for new articles and updates at the SRSrocco Report.

 WTI and Brent continued to tumble on Thursday, dropping to their lowest levels since the announcement of the OPEC deal back in November. Brent actually dipped below $49 per barrel, raising fears of another downturn. Both WTI and Brent were off by nearly 4 percent during midday trading on Thursday.
Oil traders have been patient, hoping that despite the rapid rebound in U.S. shale production, the OPEC cuts would take a substantial volume of oil off the market and correct the supply/demand imbalance. But it has been a painful and protracted process.
U.S. crude oil inventories hit a record high of 535 million barrels as recently as the end of March. Several consecutive weeks of drawdowns in April again raised hopes that the market is heading towards balance, but the most recent data release from the EIA on May 3 disappointed yet again, and it was apparently the last straw for some. Market analysts predicted a drop in oil inventories by about 2.3 million barrels, but the EIA said stocks only fell by 930,000 barrels. WTI sank to $46 per barrel and Brent fell into the $40s for the first time in 2017.
…related:

-
I know Mike is a very solid investor and respect his opinions very much. So if he says pay attention to this or that - I will.
~ Dale G.
-
I've started managing my own investments so view Michael's site as a one-stop shop from which to get information and perspectives.
~ Dave E.
-
Michael offers easy reading, honest, common sense information that anyone can use in a practical manner.
~ der_al.
-
A sane voice in a scrambled investment world.
~ Ed R.
Inside Edge Pro Contributors

Greg Weldon

Josef Schachter

Tyler Bollhorn

Ryan Irvine

Paul Beattie

Martin Straith

Patrick Ceresna

Mark Leibovit

James Thorne

Victor Adair