
Stocks & Equities
Note: The NYSE has released new data for margin debt, now available through March.
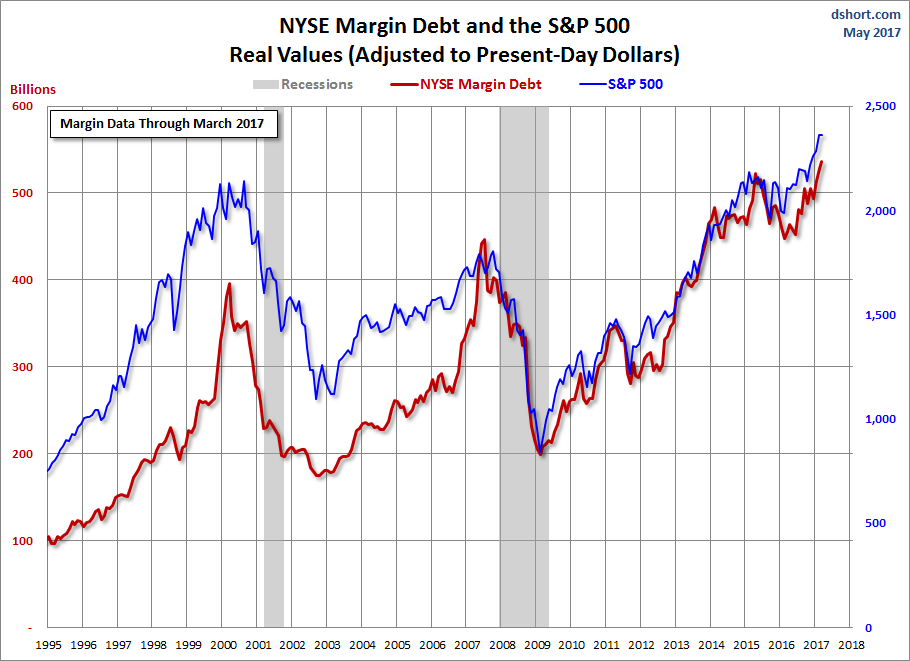
The New York Stock Exchange publishes end-of-month data for margin debt on the NYX data website, where we can also find historical data back to 1959. Let’s examine the numbers and study the relationship between margin debt and the market, using the S&P 500 as the surrogate for the latter.
The first chart shows the two series in real terms — adjusted for inflation to today’s dollar using the Consumer Price Index as the deflator. At the 1995 start date, we were well into the Boomer Bull Market that began in 1982 and approaching the start of the Tech Bubble that shaped investor sentiment during the second half of the decade. The astonishing surge in leverage in late 1999 peaked in March 2000, the same month that the S&P 500 hit its all-time daily high, although the highest monthly close for that year was five months later in August. A similar surge began in 2006, peaking in July 2007, three months before the market peak.
Debt hit a trough in February 2009, a month before the March market bottom. It then began another major cycle of increase.
The Latest Margin Data
The NYSE has released new data for margin debt, now available through March. The latest debt level is up 1.7% month-over-month. The current level is at another record high. Note the inflation-adjusted version is also at its record high. The March data gives us an additional sense of investor behavior since the start of the new administration.

After the U.S. economy disintegrated in 2008, due to the Banking and Housing crisis, Americans pawned off a record amount of gold. How much gold? Nearly, 32 million oz (1,000 metric tons). That’s one heck of a lot of gold. Matter-a-fact, U.S. gold scrap supply at its peak of 160 metric tons (mt) in 2011, was more than any other country in the world, even India and China.
It is quite unfortunate that Americans have pawned off their best asset only to go further into debt. Thus, enabling them to buy more garbage and trinkets they really don’t need. This is quite the opposite of Americans who become being extremely frugal and financially responsible after the 1930’s Great Depression. Today, banks have made it easy for Americans to BUY NOW and PAY LATER.
The consequences of this “Buy now, pay later” economic model is explained in this recent zerohedge article, 45% Of Americans Spend Up To Half Their Income Repaying Credit Card Debts:
First, roughly 50% of Americans have debt balances, excluding mortgages mind you, of over $25,000, with the average person owing over $37,000, versus a median personal income of just over $30,000.
Therefore, it’s not difficult to believe, as Northwestern Mutual points out, that 45% of Americans spend up to half of their monthly take home pay on debt service alone….which, again, excludes mortgage debt.
Because 45% of Americans are paying up to half of their monthly income to pay down credit cards and debt, they can’t use this income to purchase new goods and services. Thus, a staggering amount of the U.S. Gross Domestic Product (GDP) has been brought forward… thanks to easy credit and credit cards.
And, This is what Americans spent the most money on in the first quarter:

But that doesn’t mean that Americans stopped spending completely, quite the contrary. According to the BEA’s “goalseeked” models, even as retail sales tumbled, as Obamacare continued to drain disposable income away from other discretionary purchases, Americans – who spent far less on cars, clothing and housing in the first quarter than in Q4 – were scrambling to buy… recreational vehicles!?
When I travel up and down on the interstate where I live, I see a lot of these Recreational Vehicles (RVs), especially on the weekends. What is even more hilarious, is to see a huge 4X4 truck pulling a large RV, which is also pulling a smaller trailer behind it with two ATV’s on it. All of these vehicles consume one hell of a lot of fuel.
This sudden motivation for Americans to get into a RV and leave the RAT RACE (for a weekend), makes perfect sense to me. This is an extremely important indicator showing how Americans would rather go further into debt up to their eyeballs…. just to GET AWAY from it all. Americans spending a record percentage of their funds on RV’s to escape the insanity, suggests that the economy is getting ready to roll over and fall off a cliff.
Of course, Americans always want to do everything BIG. So, if you have the money (or credit) and a very large truck, you can pull one of these babies down the highway:

Most of the RV’s I see, have two axles. However, this one has four axles and more square feet than some small homes in older areas surrounding big cities. Unfortunately, RV’s will be one of the first items that will go extinct in the United States when the domestic oil industry disintegrates.
Regardless, let’s get back to the drying up of the U.S. secondary gold supply market.
According to the data put out in the GFMS 2017 World Gold Survey, U.S. gold scrap supply fell to a low of 58.7 metric tons (1.9 million oz) in 2016 versus a record 160 metric tons (5.1 million oz) in 2011:

What is interesting to see in this chart is that U.S. gold scrap supply in 2016 (58.7 metric tons) is nearly two and a half times less than it was in 2010 (143 metric tons) while the gold price was even higher. Thus, Americans pawned off a great deal more gold in 2010 when the price was lower at $1,225 compared to $1,267 in 2016. Which means, the U.S. gold scrap supply market is drying up.
This can be more clearly seen in the following chart below:

Not only has the U.S. gold scrap supply fallen 2.5 times from its peak in 2011, it is also less than it was in 2003 when the gold price was 3.5 times less. Americans pawned 67.6 metric tons (mt) of gold in 2003 when the price was $363 on ounce. However, with the gold price at a much higher level of $1,267 last year, U.S. gold scrap supply fell to a low of 58.7 mt.
Again, the data implies that the U.S. secondary gold scrap supply market is likely drying up.
As was stated in the beginning of the article, total U.S. gold scrap supply equaled nearly 1,000 mt from 2008 to 2016 (actual figure was 982 mt). What is even more interesting, is if we compare U.S. jewelry demand versus gold scrap versus China & India.
When the gold price reached a peak of $1,900 in 2011, U.S. jewelry demand was 60.3 mt. Again, this is the year U.S. gold scrap supply reached a record 160 mt. We must remember, most of gold scrap comes from recycled gold jewelry. Which means, Americans pawned 266% more gold than their gold jewelry demand in 2011.
Here are the 2011 Gold figures for the U.S., China & India:
2011 U.S. Gold Scrap 160 mt / 60.3 mt Gold Jewelry Demand = 266%
2011 Chinese Gold Scrap 144 mt / 547 mt Gold Jewelry Demand = 26%
2011 Indian Gold Scrap 58 mt / 667 mt Gold Jewelry Demand = 9%
As we can see, Americans pawned off 266% more gold than their annual gold jewelry demand in 2011, versus 26% for the Chinese and only 9% for Indians. While some Chinese and Indians were selling their gold jewelry as scrap in 2011, the majority were holding on to it, especially in India. Of course, this is no secret as India tradition is to build their wealth by acquiring gold jewelry.
Americans are in serous trouble as they have sold off the family’s gold jewels to go further into debt, while the Asians and Indians continue to acquire the yellow precious metal. When the markets finally crack, very few Americans will be holding gold. Unfortunately, the majority of Americans will see their highly inflated investments of STOCKS, BONDS and REAL ESTATE collapse while the value-price of gold skyrockets.
Check back for new articles and updates at the SRSrocco Report.

 Donald Trump has made good on one of his most audacious campaign promises by submitting what he describes as the biggest tax cut in U.S. History. For once, at least, this does not appear to be Trumpian braggadocio. It really may be the mother of all tax cuts. But if passed, what may this bunker buster do to the economy? While I have rarely met a tax cut I didn’t like, this one just may be more likely to send the economy into a downward spiral than it is to send up to orbit.
 While there’s been plenty of focus on apps and cloud computing in the technology space, advances are also being made in hardware-focused sectors such as nanotechnology. Uses include everything from more efficient drug delivery systems to tiny transistors that allow for smaller and more powerful computer chips.
To be sure, the markets for nanotechnology products and nanotechnology uses are set to grow in the coming years. A report released this past December from Research and Markets states that nanotechnology “is a rapidly growing technology” and the global industry has been forecast to grow annually by 17 percent up to 2024.
Similarly, BCC Research has said that the global nanotechnology market was valued at $39.2 billion in 2016 and should grow at a CAGR of 18.2 percent, in order that the market will reach a believed $90.5 billion by 2021.
Still, for investors just starting to look at nanotechnology stocks, it can be difficult to know where to to begin, as nanotechnology uses are so varied. As a starting point, here’s an overview of six of the top areas in which nanotechnology uses are making a big difference today.
Materials and coatings
Last week, as the Nasdaq Composite Index crossed 6,000 for the first time, Robert Shiller, a Nobel laureate economist, made the rounds in the financial press.
He’s worried. Valuations are historically high. A crash is coming, eventually, he argues.
With his carefully measured tone and impeccable academic pedigree — he’s a professor at the Yale School of Management — Shiller is the perfect pundit.
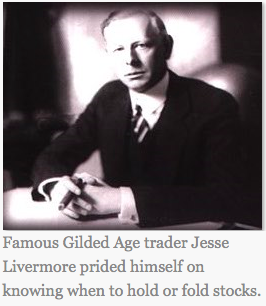
Jesse Livermore, the tenacious trader immortalized in the 1923 investment classic Reminiscences of a Stock Operator, warned about pundits. He hated tips and claimed following them had lost him hundreds of thousands of dollars.
He learned to trust his own analysis. He learned to trust the power of trends and to ignore punditry.
Shiller’s concern is based on something called the Cyclically Adjusted Price-to-Earnings ratio, better known as the CAPE. It’s a valuation model that takes a conservative ten-year average of corporate earnings and divides by the comparable metric for price. And CAPE has reached levels not seen since 1929 and 2000, two dates that send shivers down most investors’ spines.
The rest of the economic story does not help the bulls’ case, either. Those periods were characterized by extremely high levels of Gross Domestic Product growth. In 2000, GDP growth was north of 4%. Last week, GDP was reported at a measly 0.7%.
 It’s not the first time in recent years that the CAPE has been high. The ratio pushed near current levels in 1998. At the time, the dotcom era was in full stride. In the ensuing two years, the most speculative stocks became even more dear as prices sprinted higher. For example, adjusted for splits, Amazon (AMZN) zoomed from less than $5 in 1998 to $113 in 2000.
Something like that could happen again. “We’re in an oddball enough mood,” Shiller admits.
The economist explains that President Trump is a game-changing figure, for better or worse, who wants to disrupt the underlying fundamentals of the capital markets. Changing the corporate tax code would be bullish for stocks in the near term.
However, periods of extreme optimism have an ugly common denominator, Shiller notes with a wry smile. They always lead to crashes.
Shiller is right, empirically. However, that information is not particularly useful.
Livermore understood that the most important attribute of a successful investor is the ability to hold winners. He called this “sitting tight,” and it is not as easy as it appears.
Too many investors want to sell winners quickly. They believe stock strength merits selling. Pundits preach everywhere they can find listeners. They construct models. They get on their soapbox on TV. Stocks are up, sell.
Livermore found just the opposite is true. Strength is validation an investor got it right. Investors are wise to learn to embrace this, learn from it.
They are also wise to challenge pundit assertions. Can their claims pass the test of tested scrutiny?
“Not even a world war can keep the stock market from being a bull market when conditions are bullish, or a bear market when conditions are bearish,” Livermore said. “And all a [trader] needs to know to make money is to appraise conditions.”
Understanding market conditions is one of the cornerstones of the information I provide to members. Valuation models alone are rarely useful. You need to know what to buy and when events change that warrant selling.
Our newsletters show members how to identify big trends, find the right stocks, and most important, how to sit tight for the big money. A lot more money is lost waiting for crashes than during crashes themselves.
Best wishes,
Jon Markman’s Pivotal Point
…also from Martin D. Weiss, Ph.D.:
New, Bigger Shockwaves in Europe!


-
I know Mike is a very solid investor and respect his opinions very much. So if he says pay attention to this or that - I will.
~ Dale G.
-
I've started managing my own investments so view Michael's site as a one-stop shop from which to get information and perspectives.
~ Dave E.
-
Michael offers easy reading, honest, common sense information that anyone can use in a practical manner.
~ der_al.
-
A sane voice in a scrambled investment world.
~ Ed R.
Inside Edge Pro Contributors

Greg Weldon

Josef Schachter

Tyler Bollhorn

Ryan Irvine

Paul Beattie

Martin Straith

Patrick Ceresna

Mark Leibovit

James Thorne

Victor Adair