
Energy & Commodities

As we get ready to kickoff what promises to be a wild week of trading, today the man who has become legendary for his predictions on QE, historic moves in currencies, spoke with King World News about what is going to come as a massive shock to people.
“This Is The New Normal!”
Egon von Greyerz: “This is the new normal”! That is what a professional advisor stated at a recent family office in London after I had outlined the risks due to the credit and asset bubbles. This is what is so frightening about any top in such an extreme economic cycle. Peak optimism and peak asset prices go hand in hand. I did not experience the 1929 crash or the depression, but a few quotes from that remarkable period of time expresses the typical euphoria at a market peak.

Future global economic growth is in serious trouble as oil discoveries fell to historic lows last year. The International Energy Agency (IEA) reported that the sharp downturn in capital spending by the conventional oil sector was due to extremely low oil prices.
As the oil price fell to $30 in 2016, oil companies cut their exploration and capital expenditures by 25-40%. For example, ExxonMobil, the largest oil company in the United States, cut their capital expenditures by 26% in 2016, from $26 billion in 2015 to $16 billion last year. This had a profound impact on new oil discoveries.
According to the IEA report:
Oil discoveries declined to 2.4 billion barrels in 2016, compared with an average of 9 billion barrels per year over the past 15 years. Meanwhile, the volume of conventional resources sanctioned for development last year fell to 4.7 billion barrels, 30% lower than the previous year as the number of projects that received a final investment decision dropped to the lowest level since the 1940s.
By taking the IEA’s oil discovery data and comparing it to the total amount of conventional oil consumed by the world in 2016, here is the following chart:
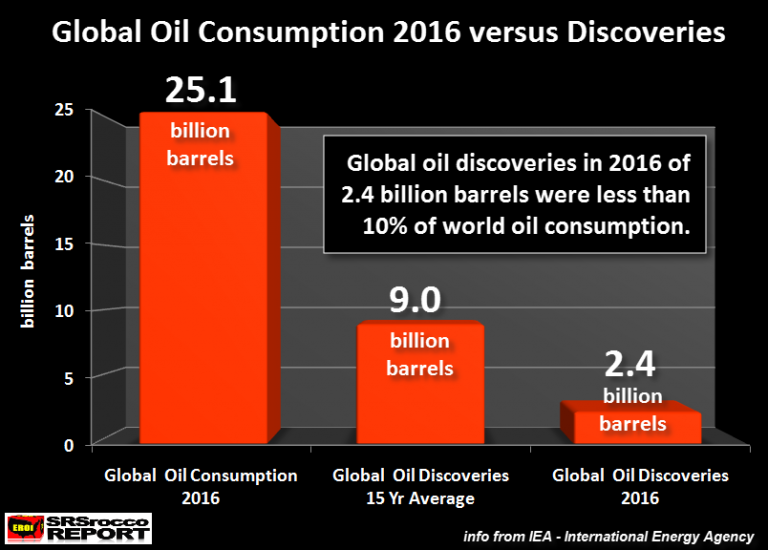
The world consumed 69 million barrels per day of conventional oil last year, which equaled a total of 25 billion barrels (source: IEA report above). Which means, conventional global oil discoveries of 2.4 billion barrels were less than 10% of total world conventional oil consumption. This is extremely bad news.
To understand the breakdown in the different oil types, the IEA provided the following data:
Conventional oil production of 69 mb/d represents by far the largest share of global oil output of 85 mb/d. In addition, 6.5 mb/d come from liquids production from the US shale plays, and the rest is made up of other natural gas liquids and unconventional oil sources such as oil sands and heavy oil.
Global Conventional oil production was 69 million barrels per day (mbd) of the total 85 mbd, which included natural gas plant liquids and other unconventional sources such as shale oil (U.S.), heavy oil and tar sands. Typically, conventional oil is the higher quality, cheaper to produce oil.
Now, what is even more alarming, is that global oil discoveries have been much lower than production for quite some time. The IEA also stated that the amount of world conventional oil discoveries averaged about 9 billion barrels for the past 15 years. If we assume that the world was producing 65 mbd of “conventional oil” for the past 15 years (it was likely higher), the world was only replacing about 38% of its annual oil consumption.
Here are the oil figures:
65 mbd X 365 = 24 billion barrels
9 billion average annual barrels oil discovery / 24 billion barrels consumed = 38%
So, not only did the world only discover 10% of the conventional oil it consumed last year, it has only been replacing a little more than a third of what it has been consuming for in the past 15 years. This is extremely bad news and it is starting to catch up to us.
I will be writing more energy articles showing how the situation is becoming more dire for the U.S. and global oil industries. I am waiting for the top U.S. oil companies to release their detailed SEC quarterly results in a week to provide more information, but they have already released some results.
For example, ExxonMobil cut its capital expenditures another 19% during Q1 2017 versus the same period last year. Falling exploration and capital expenditures will grind to a halt future oil discoveries. Investors need to understand that this will impact global economic growth quite negatively in the future.
Check back for new articles and updates at the SRSrocco Report.

On Wednesday, the White House unveiled Trump’s tax reform plan. What does it mean for the gold market?
Finally, the new administration has presented the long-awaited tax plan. The key elements are as follows:
- The corporate tax rate cut from 35 percent to 15 percent.
- The number of personal income tax brackets reduced from seven to three, with a top rate of 35 percent and lower rates of 25 percent and 10 percent.
- The standard deduction doubled.
- Most of tax breaks eliminated.
- The introduction of a “one-time tax” on the trillions of dollars held by corporations overseas.
The whole plan is only about 100 words long and it is very similar to the Trump’s tax proposal from the campaign. The plan is said to provide a “massive tax cut”, or even the “biggest tax cut” in the U.S. history. So it should be good for the stock market and bad for gold, right? Well, it should, but there is one problem with that plan: it lacks any details. In particular, nobody knows how the tax cuts would be financed. As a reminder, an almost identical plan from the campaign would reduce federal revenues by $6.2 trillion, according to the Tax Policy Center. Hence, the proposal would boost the U.S. federal debt by $7.2 trillion (the sum includes interest costs) over the decade. It goes without saying that such a reform would be unacceptable for fiscally conservative Republicans. And because the plan is tilted toward the rich, Democrats would not accept it either.
This is why the plan disappointed the markets and raised justified skepticism, which sent the stock market lower and made gold rebound from two-week lows, as one can see in the charts below.
Chart 1: The S&P 500 Index over the last three days.
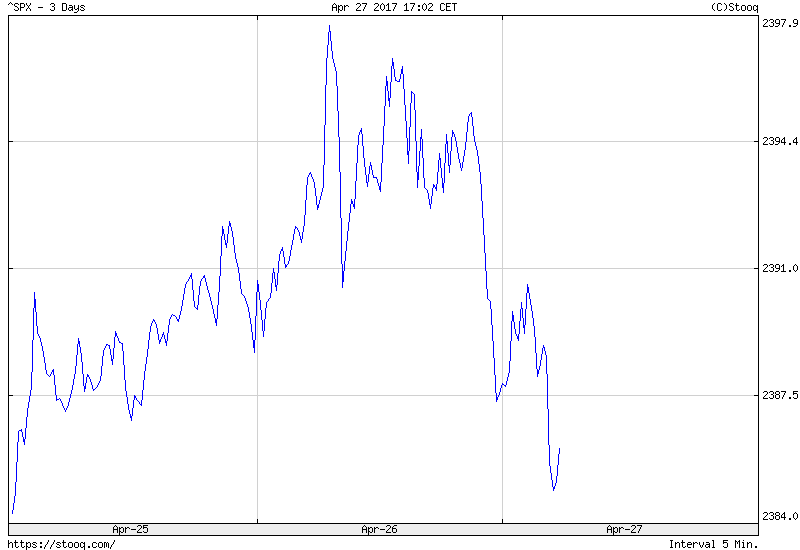
Chart 2: The price of gold over the last three days.
Summing up, Trump has finally presented his long-awaited tax plan. The proposal lacks any details and there are serious doubts how it might actually get passed in Congress. It signifies the final blow to the Trump rally, which is good news for the gold market.
If you enjoyed the above analysis, we invite you to check out our other services. We focus on fundamental analysis in our monthly Market Overview reports and we provide daily Gold & Silver Trading Alerts with clear buy and sell signals. If you’re not ready to subscribe yet and are not on our mailing list yet, we urge you to join our gold newsletter today. It’s free and if you don’t like it, you can easily unsubscribe.
Disclaimer: Please note that the aim of the above analysis is to discuss the likely long-term impact of the featured phenomenon on the price of gold and this analysis does not indicate (nor does it aim to do so) whether gold is likely to move higher or lower in the short- or medium term. In order to determine the latter, many additional factors need to be considered (i.e. sentiment, chart patterns, cycles, indicators, ratios, self-similar patterns and more) and we are taking them into account (and discussing the short- and medium-term outlook) in our trading alerts.
Thank you.
Arkadiusz Sieron
Sunshine Profits‘ Gold News Monitor and Market Overview Editor
Market Summary
The stock market is on track to rise by more than 5% during the first 100 days of the Trump presidency, outperforming Ronald Reagan’s 1% loss and Barack Obama’s 2.8% gain, as reported by CNBC. The benchmark Standard & Poor’s 500 Index (S&P 500) has climbed roughly 5.2% from January 20 through April 25, according to Google Finance. “Trump is the second-best Republican and third-best President since World War Two,” said Sam Stovall, describing the S&P 500’s performance under our latest president during an interview with Investopedia. “He can boast that his 100-day performance exceeded that of Ronald Reagan, his role model,” added Stovall.
Last week, the benchmark S&P 500 index advanced 1.5% and ended April .9% higher. The blue-chip DOW Jones Industrial Average gained 1.9% last week and 1.3% over the month. The tech-heavy Nasdaq Composite Index logged a 2.3% weekly and monthly gain. The smaller cap Russell 2000 and MidCap 400 indexes are up for the week 1.49% and .88% respectively. Note that the Nasdaq has taken over as the leading asset class which seem to confirm the overall markets current bullish move.

A standard chart that we use to help confirm the overall market trend is the Momentum Factor ETF (MTUM) chart. Momentum Factor ETF is an investment that seeks to track the investment results of an index composed of U.S. large- and mid-capitalization stocks exhibiting relatively higher price momentum. This type of momentum fund is considered a reliable proxy for the overall stock market trend. We prefer to use the Heikin-Ashi format to display the Momentum Factor ETF. Heikin-Ashi candlestick charts are designed to filter out volatility in an effort to better capture the true trend. Last week’s comment “…The updated MTUM chart below is at an inflection point. You can see the current bullish trend is starting to pierce through the top of the current six-week trading range. Next week we should find out if the trend continues with a confirmed breakout or if it retrenches and stays range bound…” The updated MTUM chart shows the major stock indices confirming a breaking out above the top of their trading ranges. The next question is whether the MTUM ETF will continue trending higher or will the price stabilize. The ETF has gotten extremely overbought but this situation can continue indefinitely and as you can see there has not been a significant pullback all year. If the current uptrend starts to dissipate the most probable expectation is range-bound trading.

A tool to help confirm the overall market trend is the Bullish Percent Index (BPI). The Bullish Index is a popular market “breadth” indicator used to gauge the internal strength/weakness of the market. Like many of the technical market internal indicators, it is used both to confirm a move in the market and as a non-confirmation and therefore divergence indication. Nasdaq stocks have been leading the market direction for the past year. Last week we noted “…the $BPCOMPQ is beginning a recovery bounce. We are looking to see the index moves above its 200-day moving average at approx. 62 to signal a break higher out its current trading range. There is a lot of overhead resistance, but as mentioned above the Nasdaq has been the market leader and if it breaks out the other major indexes can be expected follow…” This analysis played out as advertised. The Nasdaq index attained all-time highs again this week and finally dragged the other major equity indices higher. 40% of the tech-heavy index is driven by five companies (AAPL, AMZN, FB, GOOG & NFLX). If the Nasdaq keeps surging is should be able to push the other indices through their all-time highs.

The dollar advanced on Friday, finishing with a weekly gain, after official data showed labor costs and U.S. economic growth improved modestly during the first quarter. Treasury yields erased an early gain to end lower on Friday, ending a five-day run of increases. Gold prices climbed on Friday, raising their monthly gain to roughly 1.3%, as weaker-than-expected first-quarter U.S. economic growth weighed on the dollar. Prices, however, ended the week about 1.6% lower as a rise in global equities from last Friday helped to dull safe-haven investment demand for the metal. Treasury bonds ended the week lower after data showed a rise in the Federal Reserve’s inflation measure and weak first-quarter U.S. growth.

Market Outlook
According to Jeff Hirsch in a recent issue of the Almanac Trader, May has been a tricky month over the years, a well-deserved reputation following the May 6, 2010 “flash crash”. It used to be part of what we called the “May/June disaster area.” From 1965 to 1984 the S&P 500 was down during May fifteen out of twenty times. Then from 1985 through 1997 May was the best month, gaining ground every single year (13 straight gains) on the S&P, up 3.3% on average with the DJIA falling once and two NASDAQ losses. In the years since 1997, May’s performance has been erratic; DJIA up nine times in the past nineteen years (three of the years had gains in excess of 4%). NASDAQ suffered five May losses in a row from 1998-2001, down – 11.9% in 2000, followed by ten sizable gains in excess of 2.5% and four losses, the worst of which was 8.3% in 2010. Post-election-year Mays rank at or near the top. May is the top performing NASDAQ and Russell 2000 month in post-election years. The Russell 2000 has been up 9 straight with gains averaging a whopping 4.6%. DJIA and S&P 500 (since 1953) have been nearly as strong, with May ranking 4th and 3rdrespectively. In the 2nd quarter-to-date graph below investors are picking up the pace of trading “risk-on”. Investors are still holding on to gold to hedge against uncertainty, but you can see the Nasdaq index is the leader and the other indices are coming strong.

The CBOE Volatility Index (VIX) is known as the market’s “fear gauge” because it tracks the expected volatility priced into short-term S&P 500 Index options. When stocks stumble, the uptick in volatility and the demand for index put options tends to drive up the price of options premiums and sends the VIX higher. Last week’s analysis said “…The chart below indicates the market is at an inflection point…the Volatility Index pulled back from six-month highs as the S&P 500 recovered higher. If the S&P continues crossing above the VIX line it might indicate the market is headed back to challenge its all-time highs…” The updated chart confirms this analysis played out as advertised. You can see the move followed through with the Volatility index crashing and the S&P 500 on the move back toward all-time highs.

The American Association of Individual Investors (AAII) Sentiment Survey measures the percentage of individual investors who are bullish, bearish, and neutral on the stock market for the next six months; individuals are polled from the ranks of the AAII membership on a weekly basis. The current survey result is for the week ending 04/26/2017. Optimism among individual investors about the short-term direction of stock prices rebounded to its highest level in two months. At the same time, the percentage of investors describing their outlooks as either neutral or pessimistic fell. All three sentiment indicators are now near their historical averages. Bullish sentiment, expectations that stock prices will rise over the next six months, jumped 12.3 percentage points to 38.0%. This is a two-month high. Even with this week’s rise, optimism remains below its historical average of 38.5% for the 14th out of the last 15 weeks. The big jump in optimism follows what had been an unusually low reading last week (25.7%). Furthermore, not only did large-cap and small-cap stocks rise over the past five trading days, the NASDAQ closed above 6,000 for the first time. The recent upward momentum in stocks may have lessened concerns among some individual investors about stock prices dropping in the very short term. Neutral sentiment, expectations that stock prices will stay essentially unchanged over the next six months, fell 5.3 percentage points to 30.2%. The drop puts neutral sentiment below its historical average of 31% for the first time in six weeks. Bearish sentiment, expectations that stock prices will fall over the next six months, fell 7.0 percentage points to 31.7%. Though at a five-week low, pessimism continues to be at or above its historical average of 30.5% for the 11th consecutive week and the 14th out of the last 15 weeks.

The National Association of Active Investment Managers (NAAIM) Exposure Indexrepresents the average exposure to US Equity markets reported by NAAIM members. The blue bars depict a two-week moving average of the NAAIM managers’ responses. As the name indicates, the NAAIM Exposure Index provides insight into the actual adjustments active risk managers have made to client accounts over the past two weeks. The current survey result is for the week ending 04/26/2017. First-quarter NAAIM exposure index averaged 92.85%. Last week the NAAIM exposure index was 70.82 %, and the current week’s exposure is 89.71%. Money Managers have converted back to trading “risk-on” as they increase equity exposure ahead of some of the heavy hitters that are due to start reporting next week. Out of the S&P 500 companies that have reported earnings, 77% have beaten EPS estimates and top-line revenue is out-performing in over 66% of the results. If companies continue beating estimates it is reasonable to the NAAM Exposure Index to return to highs for the year.

Trading Strategy
The ‘Risk-On’ trade is still in favor this week on the back of earnings and the Tax reform anticipation. This is confirmed in the graph below with Cyclicals, Technology and Industrials sectors outperforming over the last month. Recently we mentioned “…the best six months for owning stocks can begin in October or early November and usually lasts until April or early May for DJIA and S&P 500. However, seasonal strength for technology stocks, measured by NASDAQ, tends to last until June…the S&P 500 also demonstrates a tendency to rally from late April until early June. This trade has been profitable 62.9% of the time over the longer-term however; its recent track record has been rough, declining seven times in the last eleven years. Going long the September futures contract on or about April 27 and holding until on or about June 7 has worked 23 times in 35 years. The key to this trade is overall market trend and proper trade management as numerous sizable losses and gains have occurred over trade’s history…”


FREE Workshops for MoneyTalks Listeners
You worked hard for your money, don’t let it sit dormant with some mainstream financial planner or worse, gamble it away
Diversification does not remove systemic risk, but it DOES dilute ANY chance of you making real money!
The markets are setting up for major big picture market moves into 2018. Let us show you how to position yourself for big profits.
Calgary AB – Saturday, May 6 – 11:30am – 2:30pm
Coast Hotel | 1316 33rd Street N.E. | Calgary, Alberta | T2A 6B6
Burnaby BC – Sunday, May 7 – 10:30am – 1:30pm
Delta Hotels Burnaby Conference Centre | 4331 Dominion St, | Burnaby, BC | V5G 1C7
CLICK HERE to REGISTER and for more information
Apply these powerful techniques to position yourself to make big returns:
- Leverage your returns while protecting yourself from big losses
- Profit from the next big moves in stocks, bonds, currencies, gold and oil by combining technical signals with macro fundamentals
- Discover some the key macro drivers that will decide the next major market trends


-
I know Mike is a very solid investor and respect his opinions very much. So if he says pay attention to this or that - I will.
~ Dale G.
-
I've started managing my own investments so view Michael's site as a one-stop shop from which to get information and perspectives.
~ Dave E.
-
Michael offers easy reading, honest, common sense information that anyone can use in a practical manner.
~ der_al.
-
A sane voice in a scrambled investment world.
~ Ed R.
Inside Edge Pro Contributors

Greg Weldon

Josef Schachter

Tyler Bollhorn

Ryan Irvine

Paul Beattie

Martin Straith

Patrick Ceresna

Mark Leibovit

James Thorne

Victor Adair