Timing & trends

This is the first footage of Larry Page’s ‘flying car’

Kitty Hawk is the “flying car” company that’s financially backed by Google founder Larry Page, and today it has published the first video of its prototype aircraft. The company describes the Kitty Hawk Flyer as an “all-electric aircraft” that is designed to operate over water and doesn’t require a pilot’s license to fly. Kitty Hawk promises people will be able to learn to fly the Flyer “in minutes.” A consumer version will be available by the end of this year, the company says.

….read more HERE

Screen Shot 2017-04-29 at 7.32.56 AM

The 3 Most Fascinating Articles Of The Week

Artificial-intelligence-changed-seo-11. Artificial Intelligence Confounds Its Creators

Advanced artificial intelligence is far from that. Algorithms are constantly learning, often in unusual ways, and at an exponential rate. It’s one of the cornerstones of the New Gilded Age.

Unfortunately, nobody really knows how they learn. And that should scare you, a lot.

….view & read it all HERE

2. Canada’s 6-City Housing Prices & the Plunge-O-Meter

In March 2017 Canada’s big city metro SFD prices coiled about or slid off their near term highs except in Toronto where detached houses, town houses and condos fetched new peak prices; Vancouver strata prices also hit new highs as well. Strata is the new Canadian “can-do” “must-do” “will-do” affordability metric.

….read it all HERE

2. “The Donald” at Bat

Once again, the big man steps up to the plate.

Once again, he points his bat at the far bleachers.

This is going to be “bigger, I believe, than any tax cut in history.”

And once again, the fans go wild. 

Wow… if he can pull this off

….read it all HERE

Looking for Epic Signs? Enter Silver

In yesterday’s alert we wrote that the reversal in the precious metals market should once again not be taken at its face value and that one should not overreact based on it as the size of the potential rally was limited. Well, it turned out that “limited rally” was an euphemism for a decline. Gold, silver and mining stocks declined once again despite the previous day’s reversal and gold stocks confirmed the breakdown below the key support line. The implications are strongly bearish. However, there’s something ever more bearish and much more profound.

Let’s recall the situation in silver. A few weeks ago we wrote about silver’s move to the key resistance line and the huge importance of the invalidation of the breakdown below the line based on the weekly closing prices. Silver is now significantly below the resistance line, but the key question is if the decline is already over. Well, it seems that it’s far from being over and the analogy that we are going to discuss shows just how far it could be from being over.

History repeats itself – maybe not to the letter, but more or less – that’s the key principle of technical analysis. This principle is usually utilized by using chart patterns, but it goes beyond this – to self-similarity and fractal analysis. Long story short, if one manages to find a pattern that is a good reflection of a pattern from the past (either direct or on a proportional basis) then they could profit on the pattern’s continuation.

Based on the above paragraph and the title of this article, you may already suspect that there is a very important self-similar pattern in silver. Let’s take a closer look (charts courtesy of http://stockcharts.com).

1 e6j7Bmc

Larger Chart

Please focus on the parts of the chart that we marked with orange (in 2016-2017 and in 2007-2008). At first sight there’s nothing similar between what had happened in late 2007 and the first half of 2008 and what’s been taking place since December 2015. However, the more one starts to compare them, the more amazing it becomes.

First, let’s discuss the price moves.

Silver’s early 2008 rally started a bit below the $14 level and took place until the white metal moved above $21 (below $22, though). Then silver declined about $5.50 and then it rallied (which turned out to be its final rally before the big plunge) about $3.

Silver’s early 2016 rally started a bit below the $14 level and took place until the white metal moved above $21 (below $22, though). Then silver declined about $5.50 and then it rallied (which turned out to be its final rally before the big plunge) about $3.

That’s right, the price swings are almost identical not only in relative terms, but also in terms of the (almost) exact prices. What does the above suggest? That silver is likely to decline below $9. Yes, that’s quite extreme, so let’s “conservatively” say that it’s likely to decline to or below $10.

“C’mon that’s only the price analogy – what about time?” one could ask, and they would be correct. At least initially, because it is the price analogy that makes the above even more remarkable. The analogy in terms of time is proportional instead of being exact, but it’s still present and so are the implications.

The time between silver’s bottom in late 2007 and the 2008 top is more or less the same as the time between the 2008 top and the July 2008 top, which is also more or less the same as the time between the July 2008 top and the 2008 bottom.

The time between silver’s bottom in late 2015 and the 2016 top is more or less the same as the time between the 2016 top and the 2017 top, which… Is likely to be more or less the same as the time between the 2017 top and the (upcoming) 2017 bottom.

The existence of the above analogy not only confirms that the price analogy that we discussed earlier is valid, but it also points to early November as the (more or less) time target for the final bottom in silver. Interestingly, the above is in perfect tune with the red target ellipse that we drew based on other factors (long-term support levels and the similarity to the 2012 – 2013 decline). The above makes this price / time target combination even more reliable.

Still, is the above imminent? Does silver have to slide to or below $10? Of course not – the world changes and we should take every silver and gold price prediction with a healthy dose of skepticism and review the estimations when new developments emerge. The above does, however, make a very strong case for much lower silver prices in the coming months, as it confirms multiple signals coming from other parts of the precious metals sector and other markets.

For now, it appears that we are still in the “pennies to the upside, dollars to the downside” territory and short positions seem to be well justified from the risk to reward point of view. Naturally, the above could change in the coming days and we’ll keep our subscribers informed, but that’s what appears likely based on the data that we have right now. If you enjoyed reading our analysis, we encourage you to subscribe to our daily Gold & Silver Trading Alerts.

Thank you.

Sincerely,
Przemyslaw Radomski, CFA

Todd Market Forecast: No Reason For A Short Term Sell


Todd Market Forecast for Thursday April 27, 2017 Available Mon- Friday after 6:00 P.M. Eastern, 3:00 Pacific.

DOW + 6 on flat breadth

NASDAQ COMP + 24 on 250 net declines

SHORT TERM TREND Bullish

INTERMEDIATE TERM Bullish

STOCKS: The stock market keeps inching higher mainly on better than expected profits, but we didn’t like the internals. The NASDAQ was up nicely, but breadth was lacking.

Also, the S&P 500 is in a resistance zone. Let’s see how this pans out.

GOLD: Gold was flat. Not much to report here.

CHART The S&P 500 is hesitating near all time highs. I see no reason to issue a short term sell, but I really don’t want to recommend a trading position.

Screen Shot 2017-04-27 at 4.17.05 PM

BOTTOM LINE:  (Trading)

Our intermediate term system is on a buy.

System 7 We are in cash stay on the sidelines for now.

System 8 We are in cash. Stay there.

System 9 We are in cash. Stay there.

NEWS AND FUNDAMENTALS: Not available

INTERESTING STUFF I can’t change the direction of the wind, but I can adjust my sails to always reach my destination. —–Jimmy Dean

TORONTO EXCHANGE: Toronto was down 143.

BONDS: Bonds were flat.

THE REST: The dollar almost unchanged. Silver was lower. Crude oil had a small bounce.

Bonds –Bullish as of April 3.

U.S. dollar -Change to bearish as of today April 25.

Euro — Change to bullish as of today April 25.

Gold —-Bearish as of April 19.

Silver—- Bearish as of April 19.

Crude oil —- Bearish as of April 18.

Toronto Stock Exchange—- Bullish from January 22, 2016

We are on a long term buy signal for the markets of the U.S., Canada, Britain, Germany and France.   

 Screen Shot 2017-04-12 at 4.24.17 PM             

Monetary conditions (+2 means the Fed is actively dropping rates; +1 means a bias toward easing. 0 means neutral, -1 means a bias toward tightening, -2 means actively raising rates). RSI (30 or below is oversold, 80 or above is overbought). McClellan Oscillator ( minus 100 is oversold. Plus 100 is overbought). Composite Gauge (5 or below is negative, 13 or above is positive). Composite Gauge five day m.a. (8.0 or below is overbought. 13.0 or above is oversold). CBOE Put Call Ratio ( .80 or below is a negative. 1.00 or above is a positive). Volatility Index, VIX (low teens bearish, high twenties bullish), VIX % single day change. + 5 or greater bullish. -5 or less, bearish. VIX % change 5 day m.a. +3.0 or above bullish, -3.0 or below, bearish. Advances minus declines three day m.a.( +500 is bearish. – 500 is bullish). Supply Demand 5 day m.a. (.45 or below is a positive. .80 or above is a negative). Trading Index (TRIN) 1.40 or above bullish. No level for bearish.

  No guarantees are made. Traders can and do lose money. The publisher may take positions in recommended securities.  


www.toddmarketforecast.com

Sentiment: Bulls Get Their Groove

After dropping to its lowest level since the election, bullish sentiment on the part of individual investors surged by the most this week since the week after the election.  According to the weekly survey from the American Association of Individual Investors (AAII), after just one-quarter of individual investors considered themselves bullish last week, more than 38% now put themselves in the bullish camp.  So was it the French election that individual investors were so worried about (kidding)?  Even with this week’s increase, a little perspective for this poll is in order, as it has now been 121 straight weeks since bulls were in the majority.

AAII-Bullish-Sentiment-042717

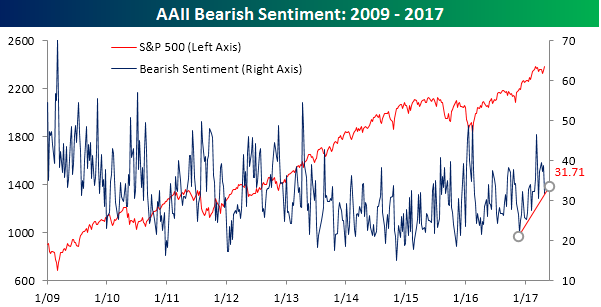
What we will be watching in this poll next week is what happens with bearish sentiment.  In this week’s survey, bears decline from 38.7% down to 31.71%.  Even after this week’s decline, the uptrend in bearish sentiment that has been in place since late last year remains in place (chart below).  If that uptrend breaks, it could be a precursor for a move to a majority in the bullish camp.

AAII Bearish Sentiment 042717

…for a 14 Day Trial go HERE