
Currency
Sent to subscribers on April 27, 2017, 7:22 AM.
Earlier today, the greenback moved lower against the Canadian dollar, which pushed USD/CAD below the December high and the previously-broken resistance zone. Is it enough to trigger further deterioration?
In our opinion the following forex trading positions are justified – summary:
- EUR/USD: short (a stop-loss order at 1.1052; the initial downside target at 1.0521)
- GBP/USD: none
- USD/JPY: long (a stop-loss order at 107.62; the initial upside target at 111.16)
- USD/CAD: none
- USD/CHF: none
- AUD/USD: none
EUR/USD
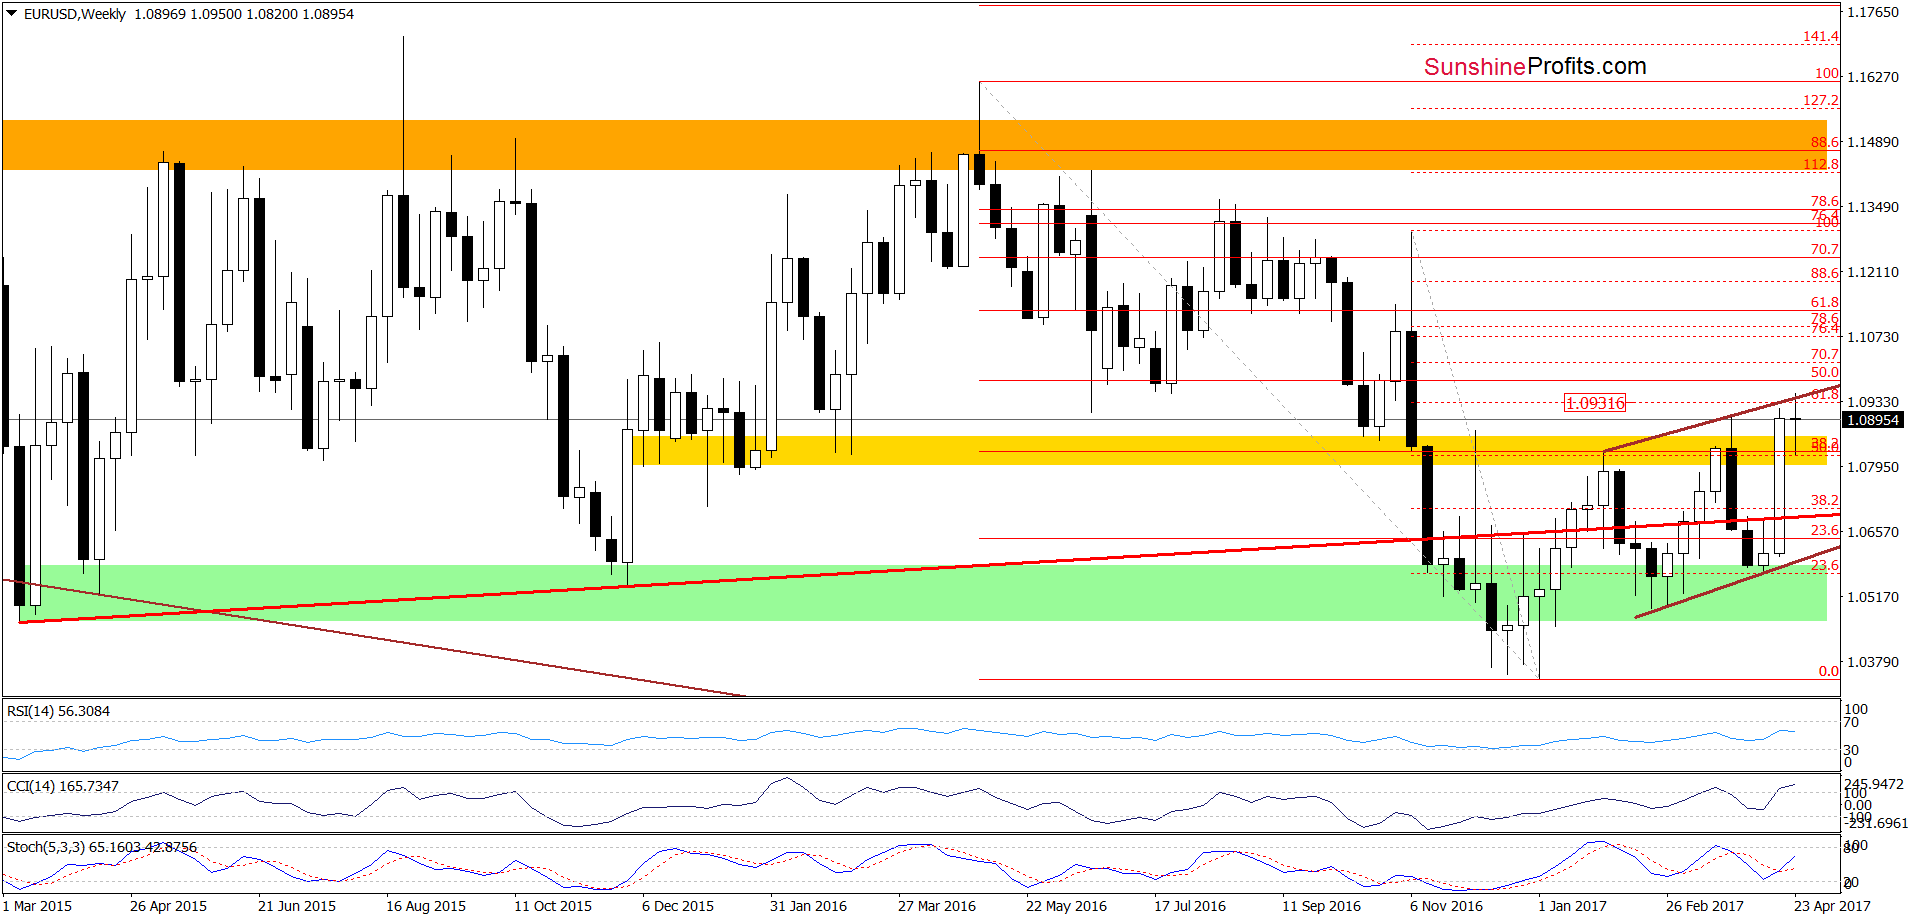
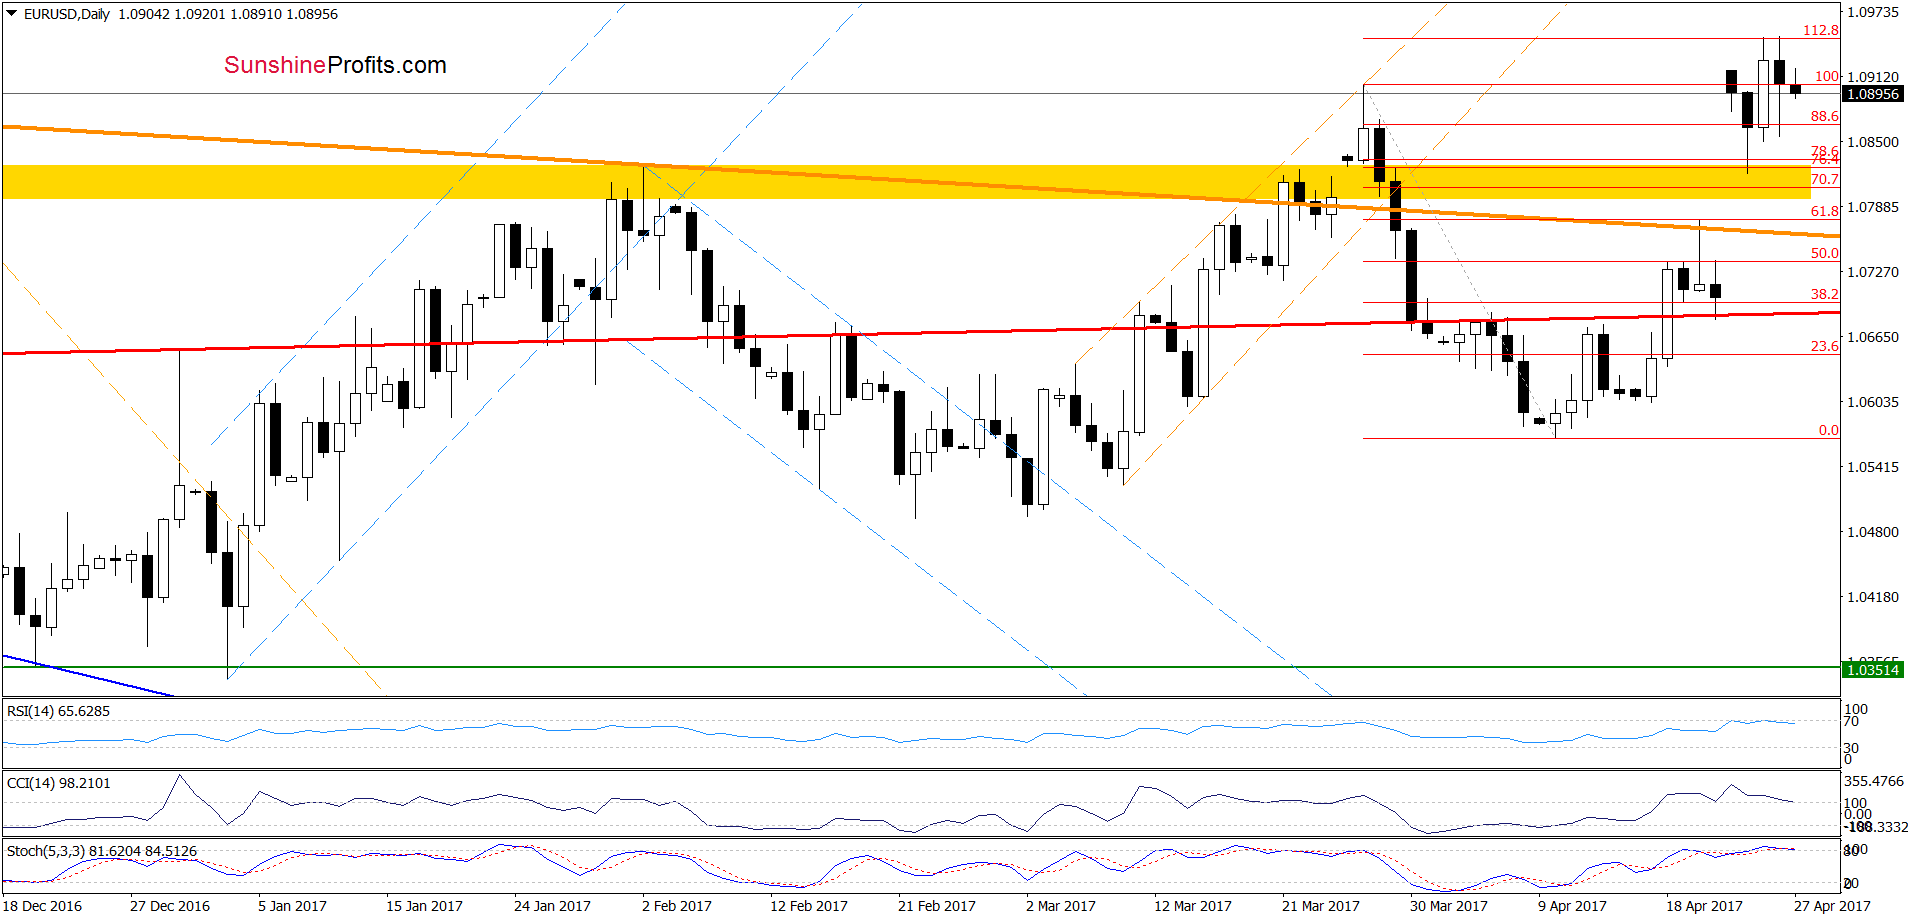
Looking at the charts, we see that although EUR/USD rebounded slightly yesterday, this “improvement” was very temporary and currency bears pushed the exchange rate lower earlier today. Thanks to this drop the pair came back under the March high, which means that our previous commentary on this currency pair is up-to-date:
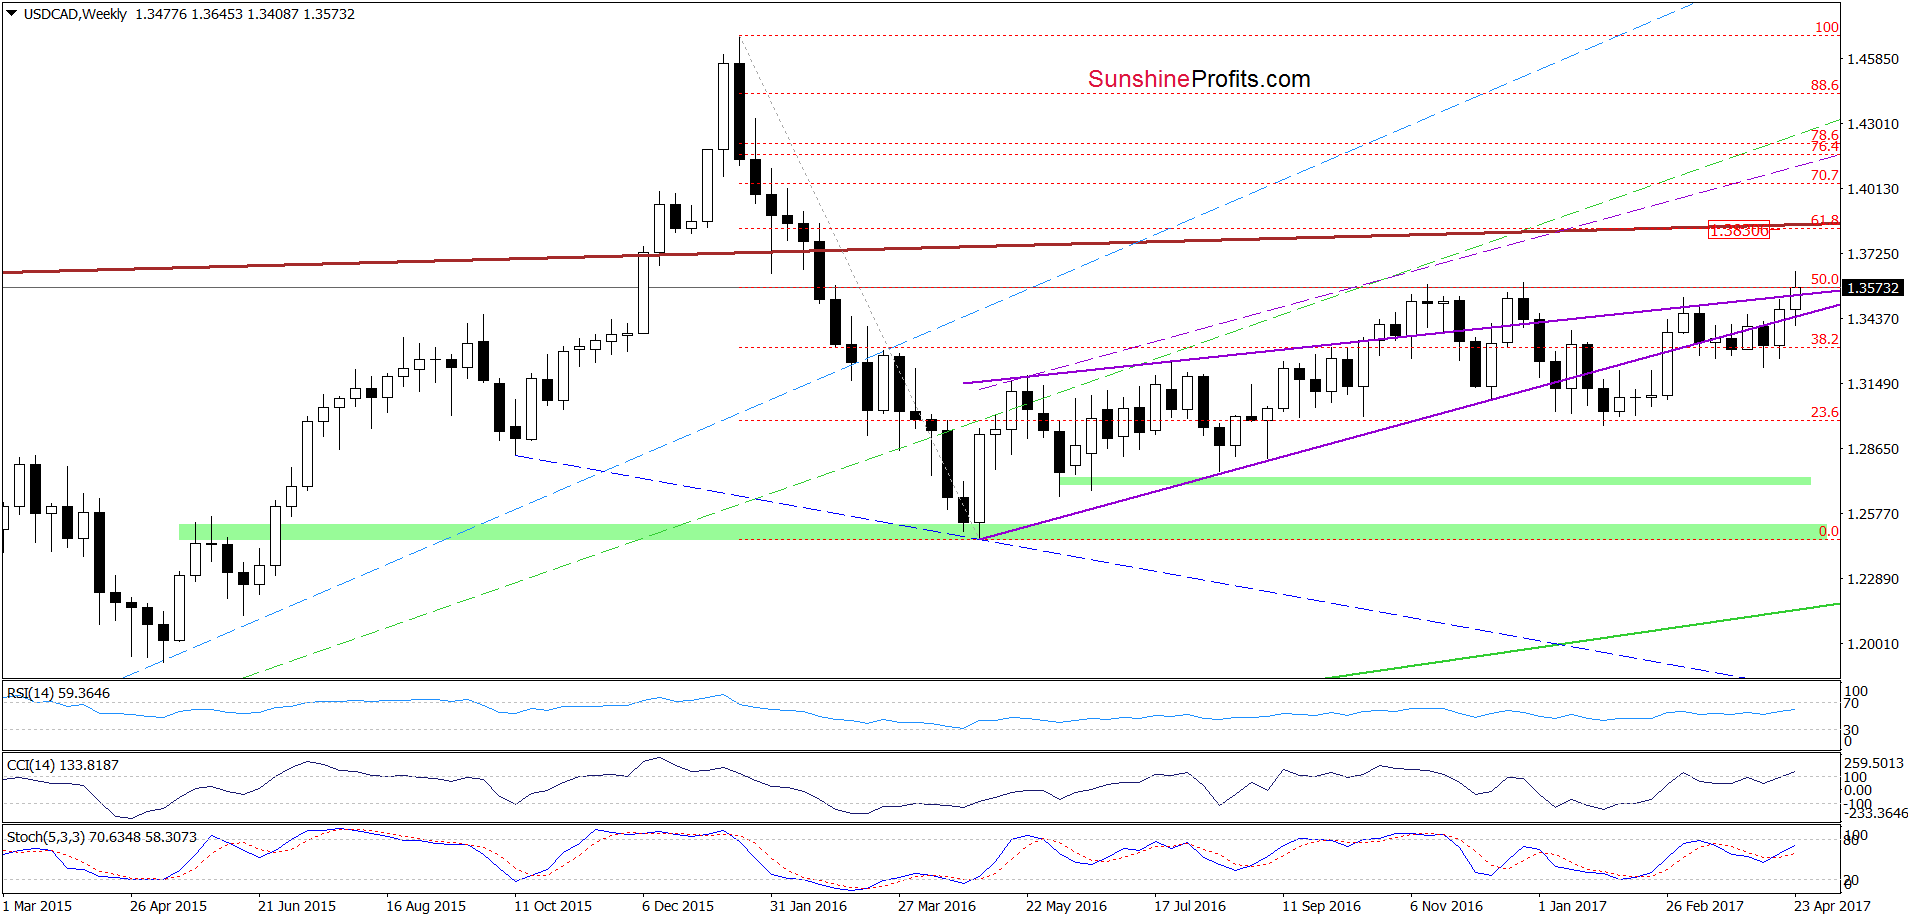
(…) EUR/USD tested the strength of the upper border of the brown rising trend channel, the 61.8% Fibonacci retracement (both marked on the weekly chart) and the 112.8% Fibonacci extension (seen on the daily chart), which resulted in a comeback below the March high. Additionally, the sell signal generated by the RSI remains in place, supporting currency bears. On top of that, the CCI and the Stochastic Oscillator are very close to generating sell signals, which suggests that reversal and lower values of the exchange rate are just around the corner.
Very short-term outlook: bearish
Short-term outlook: mixed with bearish bias
MT outlook: mixed
LT outlook: mixed
Trading position (short-term; our opinion): Short positions (with a stop-loss order at 1.1052 and the initial downside target at 1.0521) are justified from the risk/reward perspective. We will keep you informed should anything change, or should we see a confirmation/invalidation of the above.
USD/JPY
Quoting our last commentary on this currency pair:
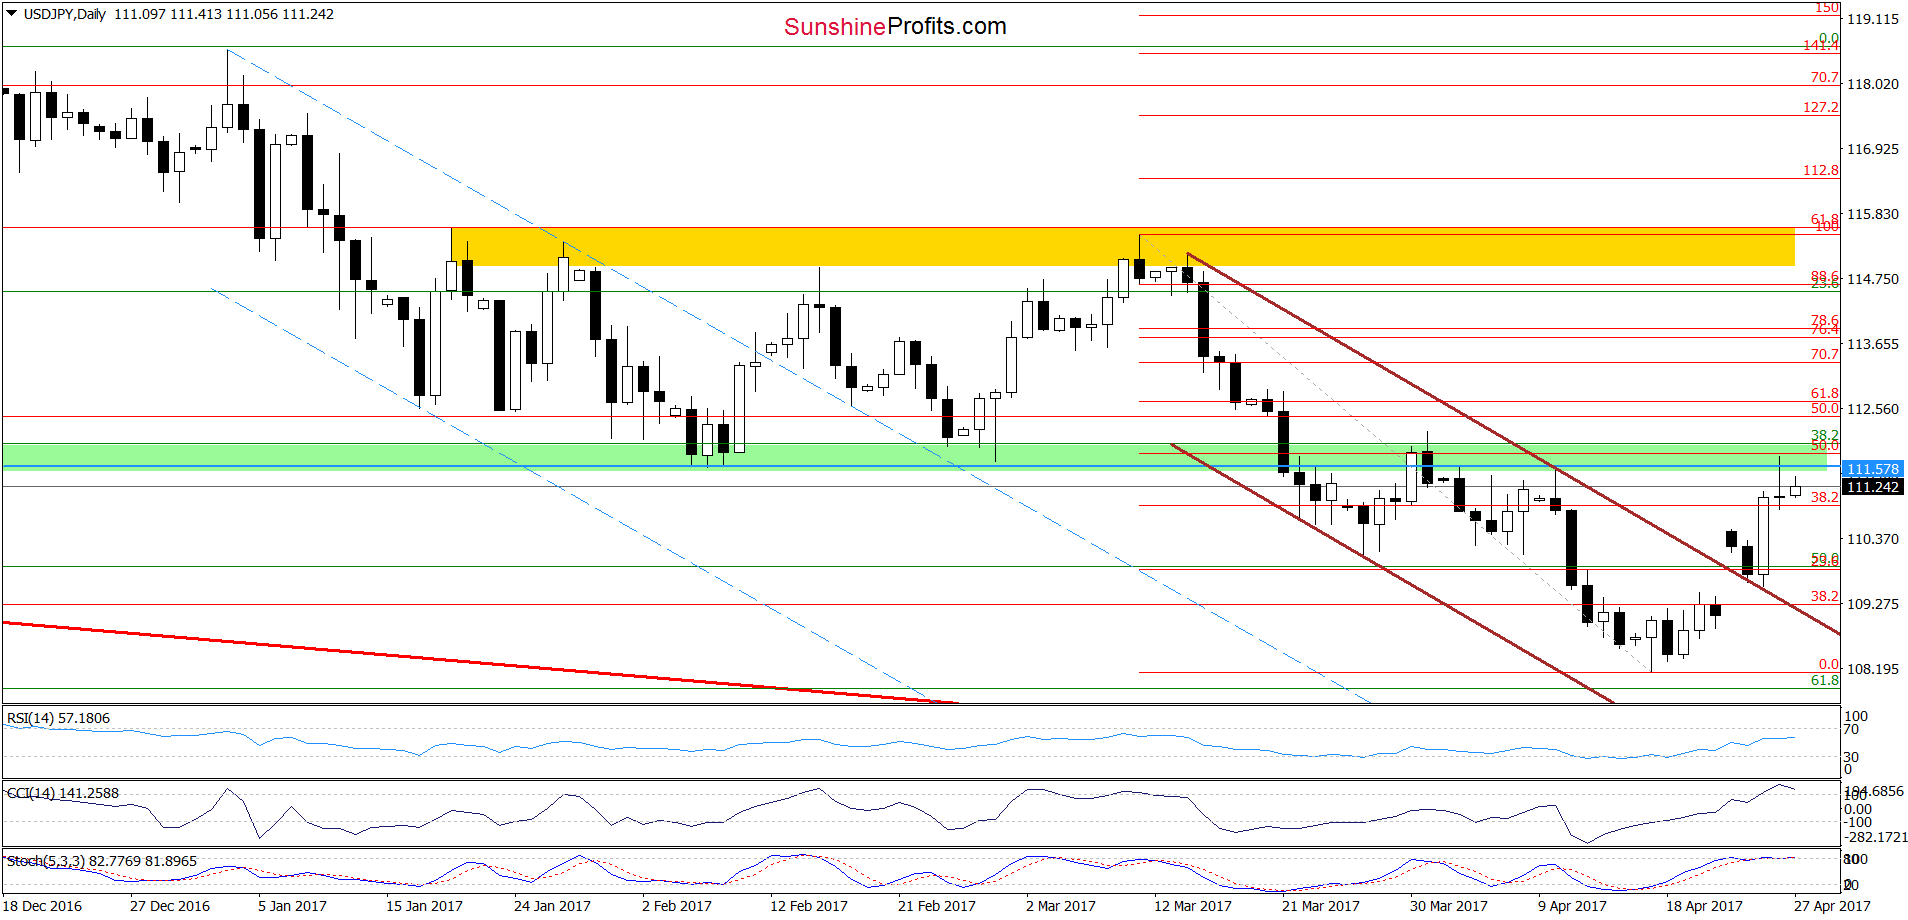
(…) the combination of the lower border of the brown declining trend channel and the lower line of the blue trend channel (both marked on the weekly chart) triggered a rebound, which took the exchange rate above the upper line of the brown declining trend channel seen on the daily chart. Earlier today, the pair moved a bit lower, which looks like a verification of the earlier breakout. If this is the case, we’ll see further improvement and a test of the green zone (marked on the daily chart in the coming days.
From today’s point of view, we see that the situation developed in line with the above scenario and USD/JPY extended gains, making our long positions more profitable and reaching our first upside target yesterday. What’s next? Taking into account the green resistance zone and the current position of the daily indicators it seems that we may see a pullback in the coming days.
Nevertheless, when we zoom out our picture and take a closer look at the medium-term chart below, we see that the buy signals generated by the weekly indicators remain in cards, supporting currency bulls and further improvement.
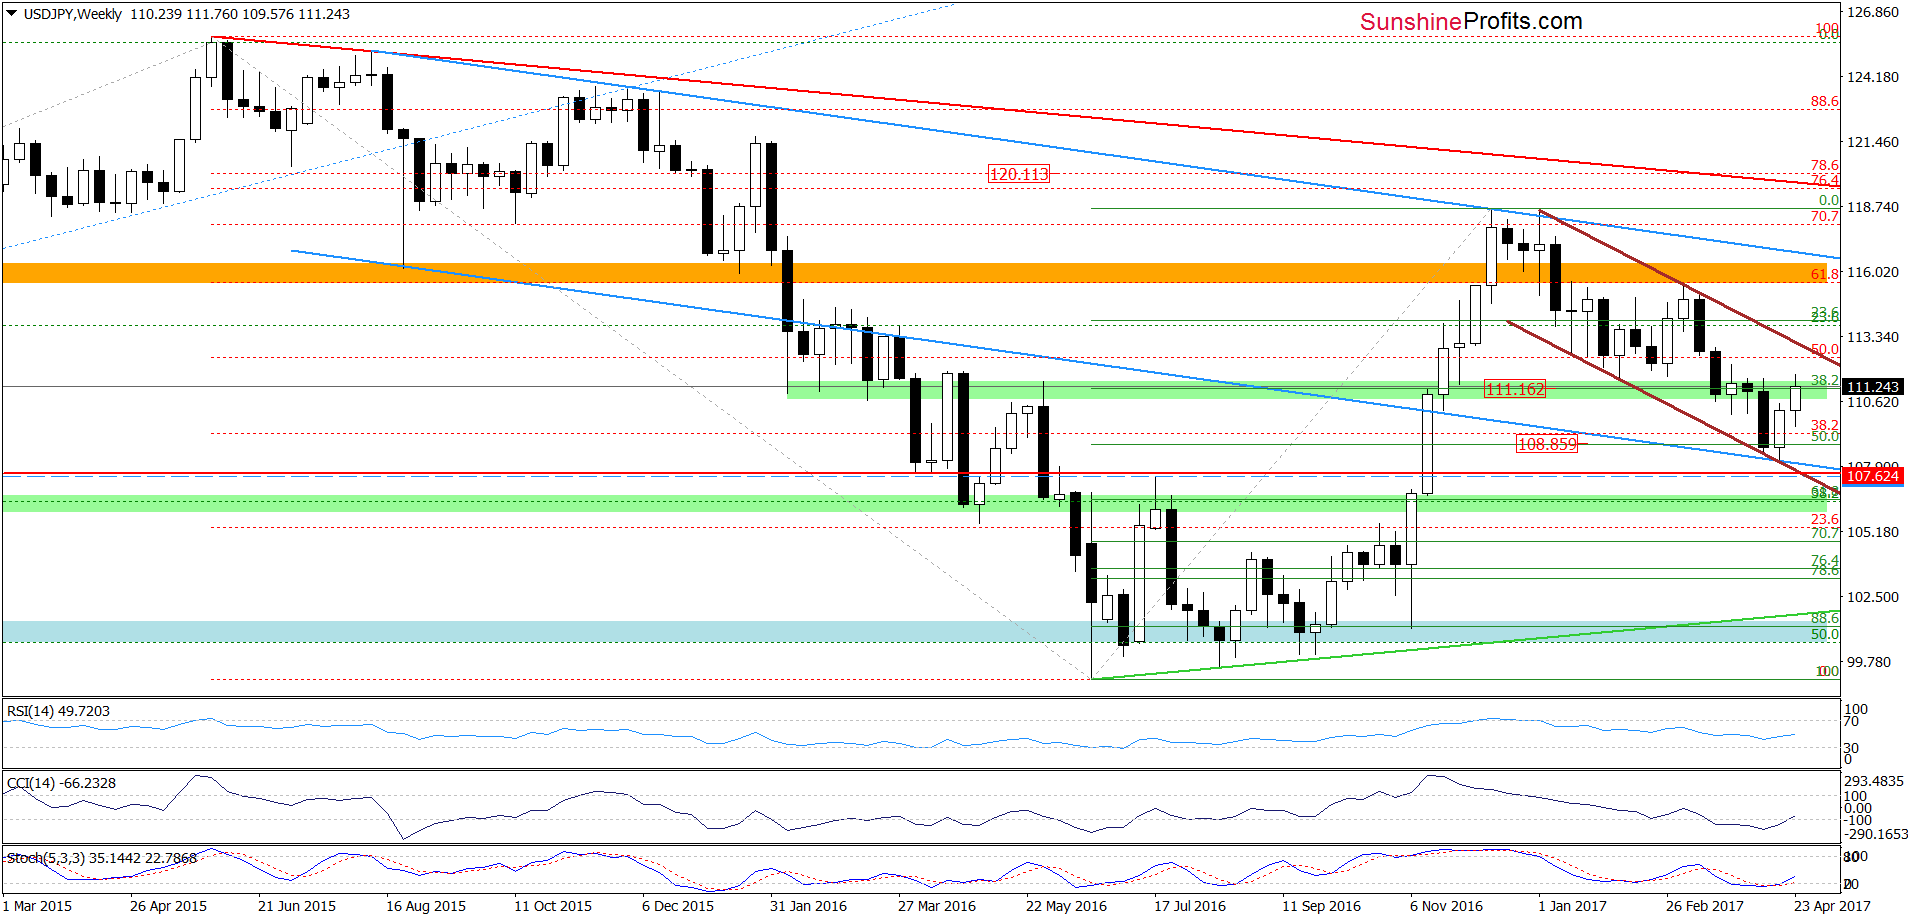
Therefore, even if USD/JPY moves a bit lower in the very short-term perspective, we believe that higher values of the exchange rate are just a matter of time. This means that if the exchange rate breaks above the green zone, we’ll see (at least) a test of the upper border of the medium-term brown declining trend channel in the following days.
Very short-term outlook: bullish
Short-term outlook: bullish
MT outlook: mixed
LT outlook: mixed
Trading position (short-term; our opinion): Long (already profitable) positions (with a stop-loss order at 107.62 and the initial upside target at 111.16) are justified from the risk/reward perspective. We will keep you informed should anything change, or should we see a confirmation/invalidation of the above.
USD/CAD
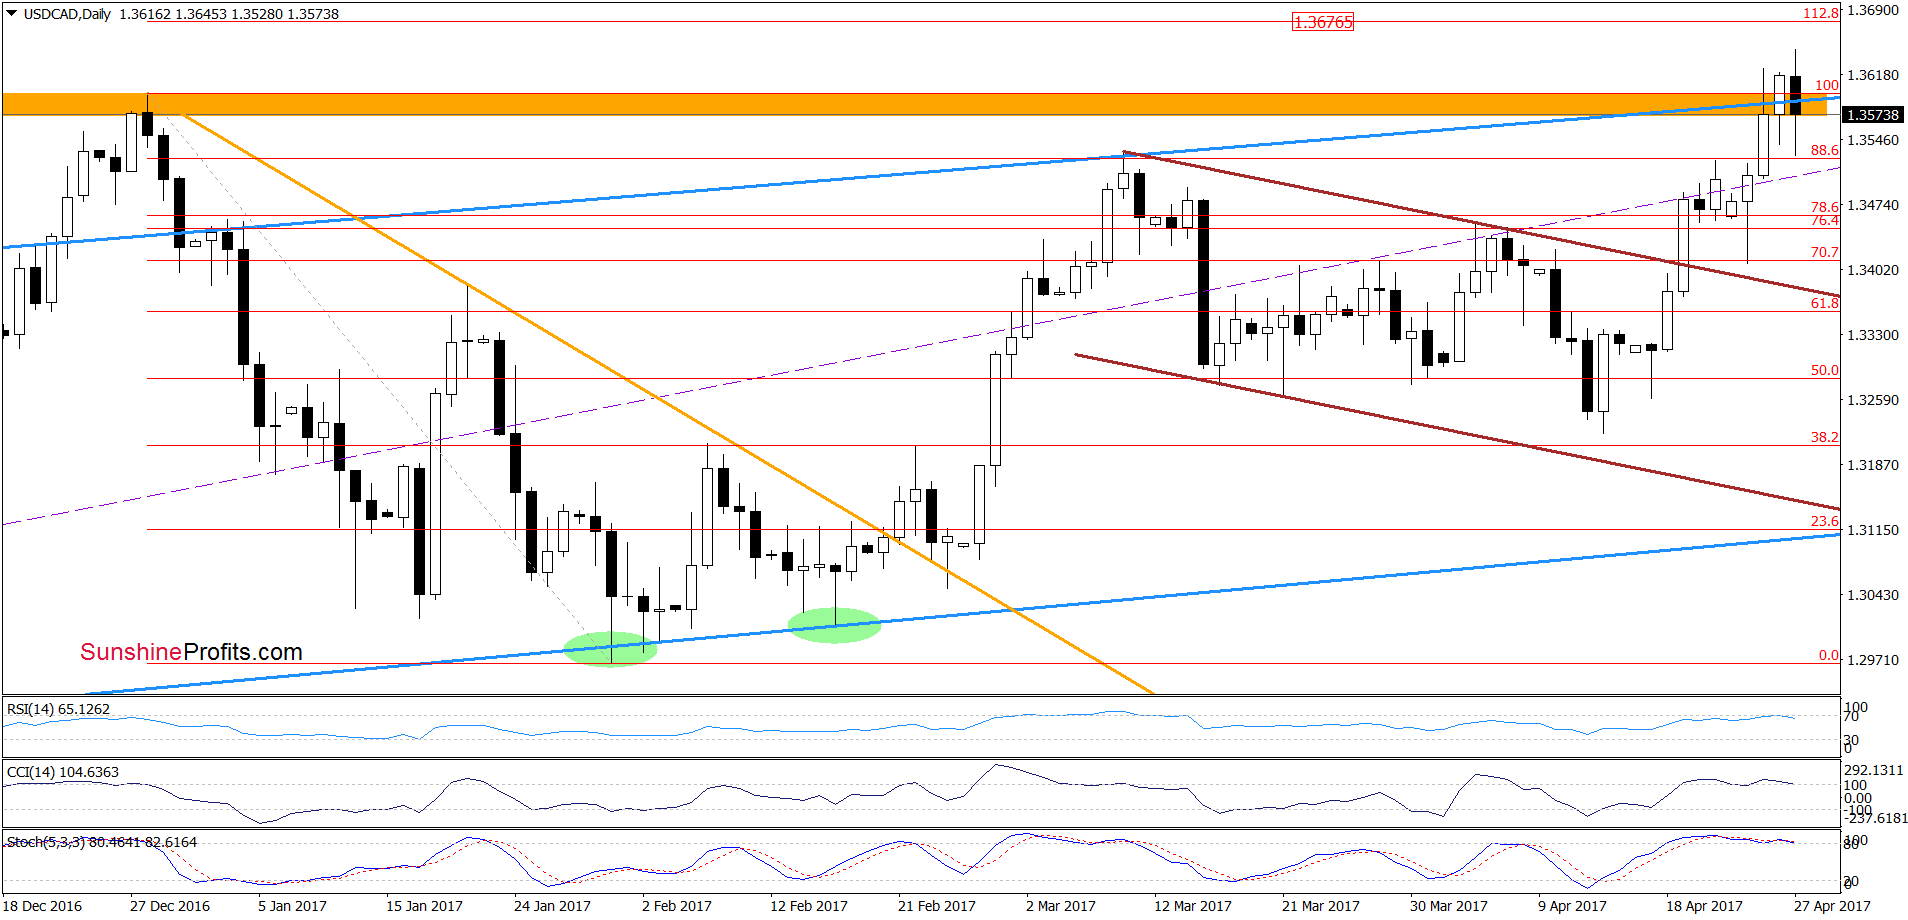
On the daily chart, we see that although USD/CAD broke above the December high and the orange resistance zone, currency bulls didn’t hold gained levels, which resulted in a pullback earlier today. Thanks to this move, the pair invalidated the earlier breakout, which is a negative development – especially when we factor in the current position of the daily indicators. Nevertheless, this event will be more bearish and reliable only if USD/CAD closes today’s session under the previous peak and the orange zone.
Very short-term outlook: mixed
Short-term outlook: mixed
MT outlook: mixed
LT outlook: mixed
Trading position (short-term; our opinion): No positions are justified from the risk/reward perspective. We will keep you informed should anything change, or should we see a confirmation/invalidation of the above.
Thank you.
Nadia Simmons
Forex & Oil Trading Strategist
Przemyslaw Radomski, CFA
Founder, Editor-in-chief, Gold & Silver Fund Manager

I live for this.
Check out this poll I ran on Twitter:
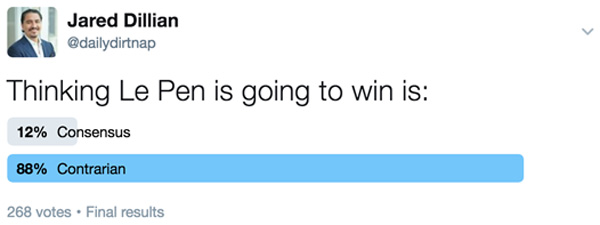
Le Pen is about a 10-to-1 dog. But that doesn’t necessarily mean that thinking she is going to win is contrarian.
Chaser:
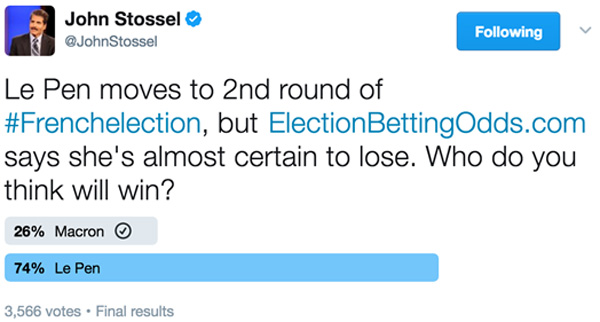
So the markets are pricing in a 10% (or less) chance of a Le Pen win, and yet everyone thinks she is going to win.
How the hell do you explain that?
Recency Bias
Late in the third quarter of the Super Bowl, the New England Patriots had an infinitesimal chance of winning. 99-to-1 against, at least. Would you have taken that bet? Probably not.
I think if you ran that simulation again the next day, people would have taken 4-to-1 odds on the Patriots winning.
This is what we call recency bias. Short-term memories are more powerful than long-term memories, so we tend to extrapolate what just happened out into the future. In financial terms, if a crash just happened, people will then think that crashes happen all the time, and bid up the price of crash protection.
In terms of the French Election—right-wing populists rode to surprise victories with Brexit and Trump, so everyone thinks right-wing populists are going to ride to victory again, ignoring what seems to be overwhelming odds against that happening.
Even though the polls show Macron really far ahead (much further ahead than Hillary was against Trump with two weeks to go), deep down, everyone thinks Le Pen is going to win.
That is how you can have an outcome that is statistically improbable (a Le Pen victory) actually be consensus.
Isn’t that cool?
On Being Consensus
This is the ideal setup—we can bet on an outcome that is probable, and actually be contrarian. As you know, it is better to be contrarian for the sake of being contrarian than consensus for the sake of being consensus.
This is the whole point of The 10th Man. When everyone thinks alike, nobody is thinking.
Right-wing populism has had such a spectacular run (and attracted a lot of media attention) that people think it will continue forever. But it’s worth pointing out that Hofer lost in Austria (although barely), Wilders lost in The Netherlands (quite handily, actually), and the Alternative for Germany (AfD) is nowhere in Germany. Also, Trump is not governing quite like the populist that you might have expected, based on how he campaigned.
I see this all the time—lots of people think they are being contrarian, and they are really not. If you really want to be a contrarian investor, state a position that is so unpopular that it will piss people off. Why is that so hard? It’s easy to be wrong if the whole herd is wrong. There is nothing worse than being wrong and alone.
I was saying that there was a Canadian housing bubble in 2013. People were furious with me. I had about 30-40 people cancel their subscriptions. Now, it is much closer to consensus, which means the easy money in the trade has already been made (in the exchange rate).
Today, if I went on CNBC and said that AMZN was due for a 50% correction, I would get laughed off the set. Do I necessarily think that will happen? No, but the example shows you where consensus is.
If I went on CNBC and said that people should invest in actively managed funds and not index funds, I would get yelled at. On the air.
I’ll let you in on a little newsletter writer secret—if I float an idea in a letter and I get lots of hate mail and negative feedback, I know I have to do some more due diligence. I knowJare I’m onto something. I have made a lot of money that way.
As For France
If you’re asking me who I think is going to win, yeah, I think Macron is going to win. But I’m a trader, so I assign probabilities to everything. There is a 90-95% probability that he is going to win. The markets agree. Implied volatility got annihilated and stocks are making new highs.
I’ve spent some time studying French politics. I heard someone say the other day that Clinton/Trump is a direct parallel to Macron/Le Pen. Not really. Le Pen’s economic views are actually very far left, and while Trump is sometimes associated with racism and xenophobia, Le Pen is pretty forthcoming about her xenophobic views. Most of France finds her distasteful, and it’s very unlikely (short of a massive terrorist attack) that Le Pen will amass enough votes to form a simple majority.
Meanwhile, a better comparison for Macron would be former New York City mayor Michael Bloomberg. Both of them have straight-down-the-middle politics— conservative on economic issues, liberal on social issues. Robby Soave at Reason went on TV the other day saying that Macron is a libertarian. There are no libertarians in France, but it’s an okay juxtaposition.
In the meantime, if you put on a trade and you feel pretty smug and contrarian, maybe take a poll and see where everyone else is on the same issue. You might find that you have company, which is never a good thing.
Jared Dillian
Editor, The 10th Man![]()

What happens when new currency is created with few limits by central banks and commercial banks?
Answer: Far too much debt and currency are created.
Central Bank Balance Sheets have increased by $10 trillion in the last decade and $1 trillion YTD in 2017.
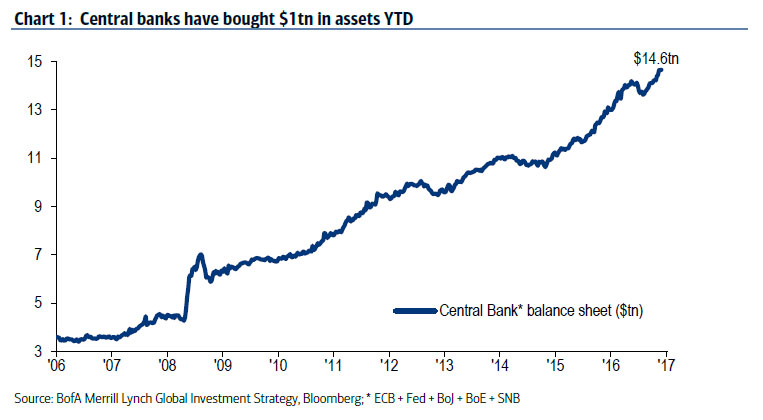
What happens when an extra $10 trillion in central bank debt plus another $80 trillion or so in other global debt is created in a decade?

The debt creation “money hose” levitated the NASDAQ and other stock markets, the bond market, and most commodities. Crude Oil, like gold and silver, rallied much higher and then crashed.
In the U.S. the Dow, S&P, and NASDAQ appear healthy while the economy, employment, and middle class limp along. Many pension funds, after nearly a decade of levitated stock market returns and repressed interest rates, look like a train wreck in the next decade.
Are we close to a blast that will explode our financial world? It hardly matters what the fuse will be, but a few come to mind:
- Escalating war in Syria, Middle-East, and/or North Korea.
- Government shut-down and loss of confidence in the administration and congress.
- Derivative crisis, similar to 2008 meltdown.
- Collapse of the Euro and EU.
- German or Italian banks implode.
- Global dollar crash and rise of the SDR as the new “trading currency.”
- Federal Reserve revival of Quantitative Easing and more aggressive dollar devaluations.
Regardless of which “snowflake” (The James Rickards example) causes the avalanche, there is an avalanche in our future, whether it is an overdue stock market crash, on-going bond market crash, another massive QE program to levitate markets that leads to a crash in the dollar, wars in Syria, North Korea, or wherever the powers-that-be choose for 2017-2018. Read “Neocons Have Trump on His Knees.”
John P. Hussman, Ph.D. Stalling Engines: The Outlook for U.S. Economic Growth
“… we expect S&P 500 annual nominal total returns to average just 0.6% over the coming 12-year period, even if underlying economic growth accelerates to historically normal rates.”
Margin Debt:

Margin debt looks dangerously high, similar to conditions before the 2000 crash and 2008 crash.
Wolf Richter: Stock Markets Sit Blithely on a Powerful Time Bomb
What about the flamboyant NASDAQ? (Log Scale)

The monthly chart shows 25 years of speculation and crash behavior. The NASDAQ looks toppy. Watch out below …

The weekly NASDAQ Composite has accelerated higher – from about 4,600 to 6,000 in ten months. Look out below.

The daily and weekly charts show upward acceleration and increasingly steep support lines. Markets can accelerate higher for only so long before they either correct or crash.
But we are told the Fed and President Trump will make everything great again, the Fed will buy stocks and printdollars as needed to inflate the bubble etc. etc. etc.
Example: “We’re Seeing a Healthy Pause Now, Higher Markets Later This Year.”
Contrary to the Happy Talk from the media:
Sovereign Man: Charles Schwab “announced that the number of new brokerage accounts soared 44% during the first quarter of 2017… the fastest pace in 17 years.” (since the dot-com bust)
Graham Summers: “Stocks Just Triggered a Rare Weekly Sell Signal”
“Paul Tudor Jones Has a Message for Janet Yellen: ‘Be Terrified’”
“…years of low interest rates have bloated stock valuations to a level not seen since 2000, right before the Nasdaq tumbled 75% over two-plus years.”
James Rickards: “Markets Are Set Up for a Fall”
“Once the stock market surveys this landscape of higher rates, slower growth, possible recession and government shutdown, it has nowhere to go but down.”
My opinion: The NASDAQ is primed for a major correction. Other indexes will follow. In response global central banks will print currencies, levitate markets, buy stocks, extend and pretend, and buy time … making the inevitable crash more devastating.
All-time highs in stocks, escalating war news, Italian banks, French politics, Syria, North Korea, Deutsche Bank, blaming Russia, and a dozen other danger zones suggest caution, encourage gold and silver purchases, and create skepticism regarding media “happy-talk.”
Timing a top is difficult given manipulated markets, contrived politics and managed news, but April and May of 2017 look like a time for caution, reduction in stock portfolios, and insurance in the form of gold and silver bullionsafely stored outside the banking system.
regards
Gary

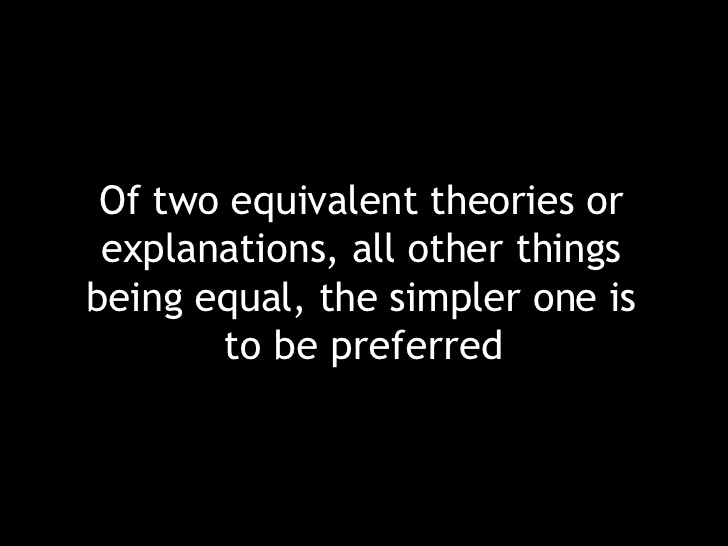 The use of this principle is valuable, but not completely determinative in science. It often has an important application in investing.
Let us consider two hypotheses.
- A method of valuing markets that relies upon backward-looking data, looks at replacement value, or depends upon some other fixed ratio. Put another way, all the most popular valuation metrics.
- A method that considers prospective earnings, expected inflation, and interest rates.
Method one has been wrong for many years. In fact, it has been mostly incorrect for decades. Method two has been on the right side of market moves, but still shows significant deviations. What can we learn from Occam’s Razor?
Method One
Since this method has been mostly wrong, many explanations have been offered. I think I left a few out, but you get the drift.
- Speculation
- Not recognizing “fundamental” risks – Euro collapse, China collapse, recession, Brexit, etc.
- Depending upon dubious earnings estimates
- Market is about to crash
- Method not good for market timing, but returns will be poor for the next 5, 7, 10, 12, ? years
- Fed intervention – money printing and pumping up the market via QE
- Plunge protection team
- European Central Banks
- Suckers’ Rally
- Myopia of the investment world – no efficient markets
- High Frequency Traders and Algorithms
Method Two
Since this method has been mostly right, little explanation is needed. The expected increase in market prices and multiples is consistent with the theory. It should continue for another 8-10% and further if forward earnings increase.
Question
Should investors accept the complex and ever-changing explanations for method one? Or perhaps should they consider that the method itself is flawed?
….also from Dash of Insight:
Bob Moriarty the founder of 321gold and 321energy sits down with Maurice Jackson of Proven and Probable to discuss some very, very important topics affecting everyone. Bob addresses his concerns with the bifurcation between Candidate Trump and President Trump as he discusses the recent bombings on Syria and Afghanistan and the potential threat of war with North Korea and or Russia. Mr. Moriarty, discusses the big elephant in the room which is the U.S. Debt/Bond Market and the resolve, or lack thereof, for the government to create a solution. Bob shares with listeners the merits on stewardship of precious metals and which metals he is procuring at the moment and why. Listeners will also discover some truly spectacular junior mining companies that have offer a unique value proposition for investors.
Scroll Down for TRANSCRIPT:
Maurice: Welcome to Proven & Probable where we focus on Metals, Mining and More. I’m your host, Maurice Jackson. Joining us today is the founder of 321gold and 321energy.com and the author of two of my personal favorite books, The Art of Peace and Nobody Knows Anything. Bob Moriarty, thank you for joining us, sir.
Bob: Sure. It’s a pleasure to be here.
Maurice: You know, when it comes to putting a succinct picture together on the relationship with politics, geopolitics, and the value proposition it presents in the natural resource space, speculators turn to Bob Moriarty.
Bob, President Trump famously stated in 2017 that the United States is not the world’s police force, and within 45 days, bombs Syria and Afghanistan. What are the short-term and most important long-term implications regarding these actions?

-
I know Mike is a very solid investor and respect his opinions very much. So if he says pay attention to this or that - I will.
~ Dale G.
-
I've started managing my own investments so view Michael's site as a one-stop shop from which to get information and perspectives.
~ Dave E.
-
Michael offers easy reading, honest, common sense information that anyone can use in a practical manner.
~ der_al.
-
A sane voice in a scrambled investment world.
~ Ed R.
Inside Edge Pro Contributors

Greg Weldon

Josef Schachter

Tyler Bollhorn

Ryan Irvine

Paul Beattie

Martin Straith

Patrick Ceresna

Mark Leibovit

James Thorne

Victor Adair