
Stocks & Equities
Sent to subscribers on April 24, 2017, 6:57 AM.
Briefly: In our opinion, speculative short positions are favored (with stop-loss at 2,410, and profit target at 2,200, S&P 500 index).
Our intraday outlook is bearish, and our short-term outlook is bearish. Our medium-term outlook remains neutral, following S&P 500 index breakout above last year’s all-time high:
Intraday outlook (next 24 hours): bearish
Short-term outlook (next 1-2 weeks): bearish
Medium-term outlook (next 1-3 months): neutral
Long-term outlook (next year): neutral
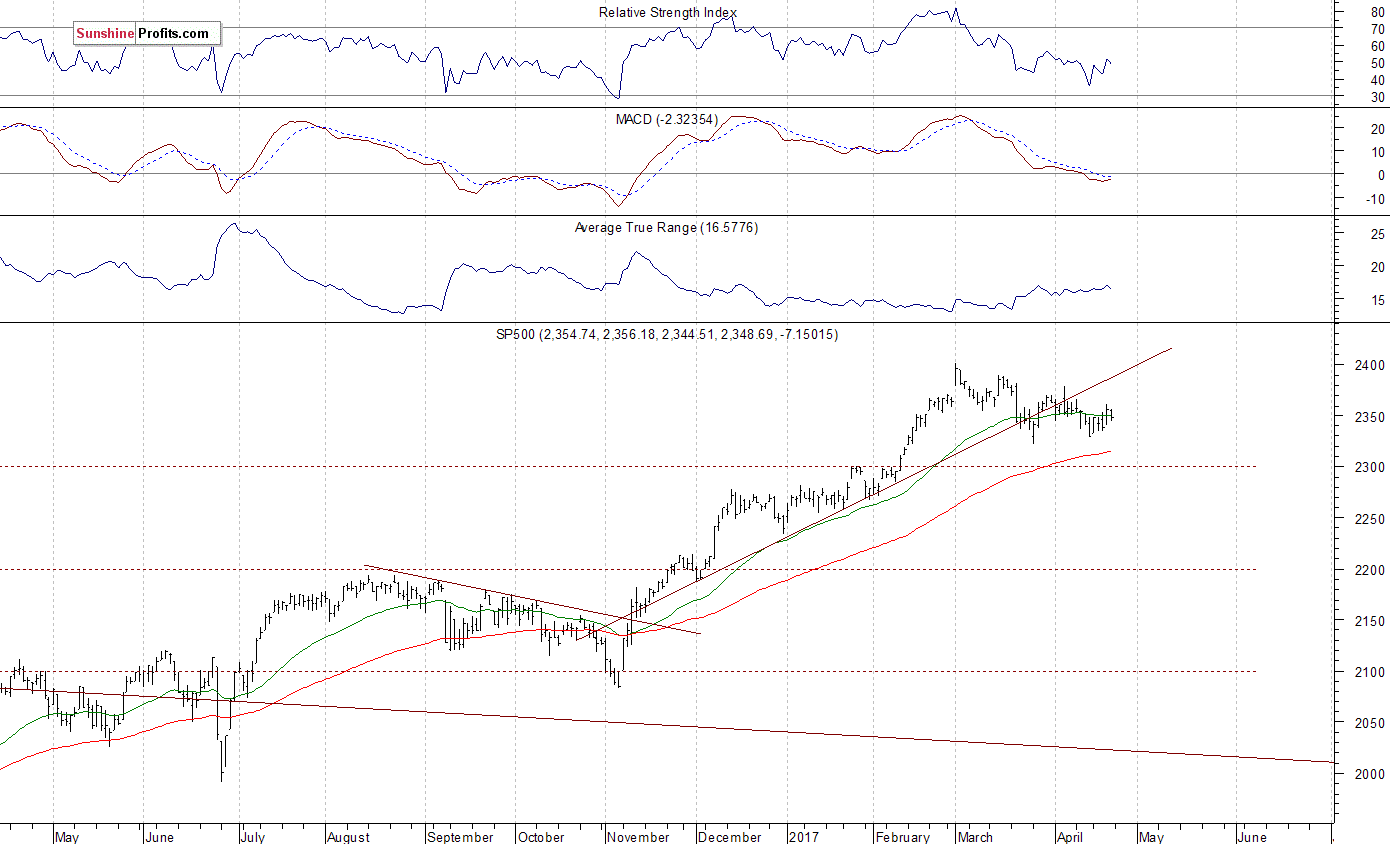
The main U.S. stock market indexes were mixed between -0.3% and 0.0% on Friday, extending their short-term consolidation, as investors awaited quarterly corporate earnings, economic data releases, French presidential election outcome, among others. The S&P 500 index remained within its week-long consolidation along the level of 2,350, around 2% below the March 1 all-time high of 2,400.98. The Dow Jones Industrial Average closed below the level of 20,600 again, and relatively stronger technology Nasdaq Composite index remained above 5,900 mark, as it continued to trade close to its early April record high. The nearest important level of support of the S&P 500 index is now at around 2,350, marked by previous resistance level. The next support level is at 2,320-2,330, marked by previous short-term consolidation. The support level is also at around 2,270-2,280. On the other hand, the nearest important level of resistance is at 2,365-2,370, marked by some previous local highs. The next resistance level is at 2,380-2,400, marked by record high, among others. We can see some short-term volatility following five-month-long rally off last year’s November low at around 2,100. Is this a topping pattern before medium-term downward reversal? The uptrend accelerated on March 1 and it looked like a blow-off top pattern accompanied by some buying frenzy. The S&P 500 index is trading below its medium-term upward trend line, as we can see on the daily chart:
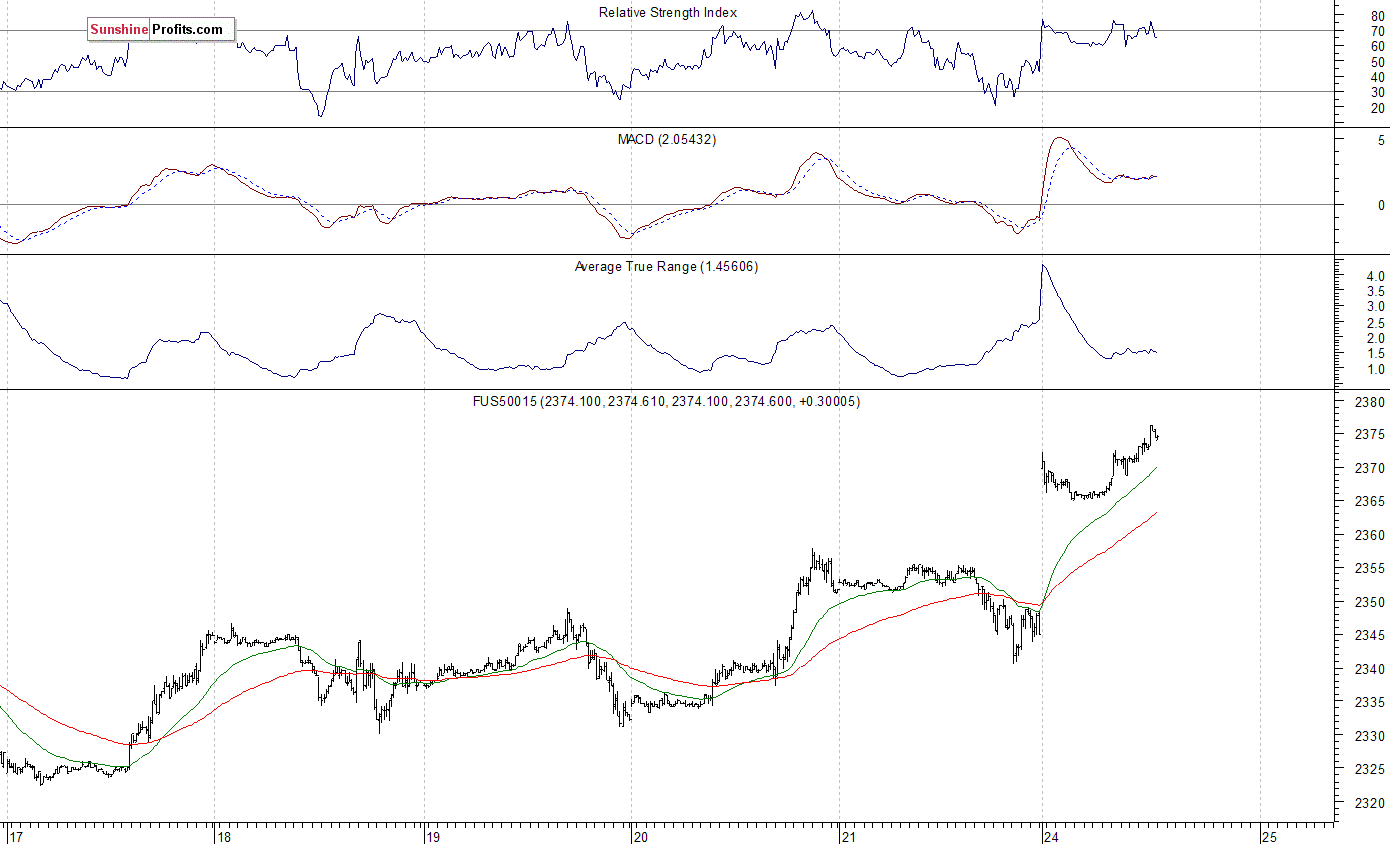
Expectations before the opening of today’s trading session are very positive, with index futures currently up 1.0-1.2%. The European stock markets have gained 1.8-4.5% so far. Investors will now wait for more quarterly corporate earnings releases. The S&P 500 futures contract trades within an intraday uptrend following an overnight gap-up opening. The nearest important level of support is at around 2,365, marked by local low. The next support level is at 2,350-2,355, marked by recent consolidation. On the other hand, the nearest important level of resistance is at around 2,375, marked by recent local high. The next resistance level remains at 2,380-2,400, marked by March topping consolidation, and an all-time high slightly above 2,400 mark. Will the market break above almost two-month long consolidation? Or is this just another upward correction? We can see some medium-term negative technical divergences, but will they lead to a downward correction?
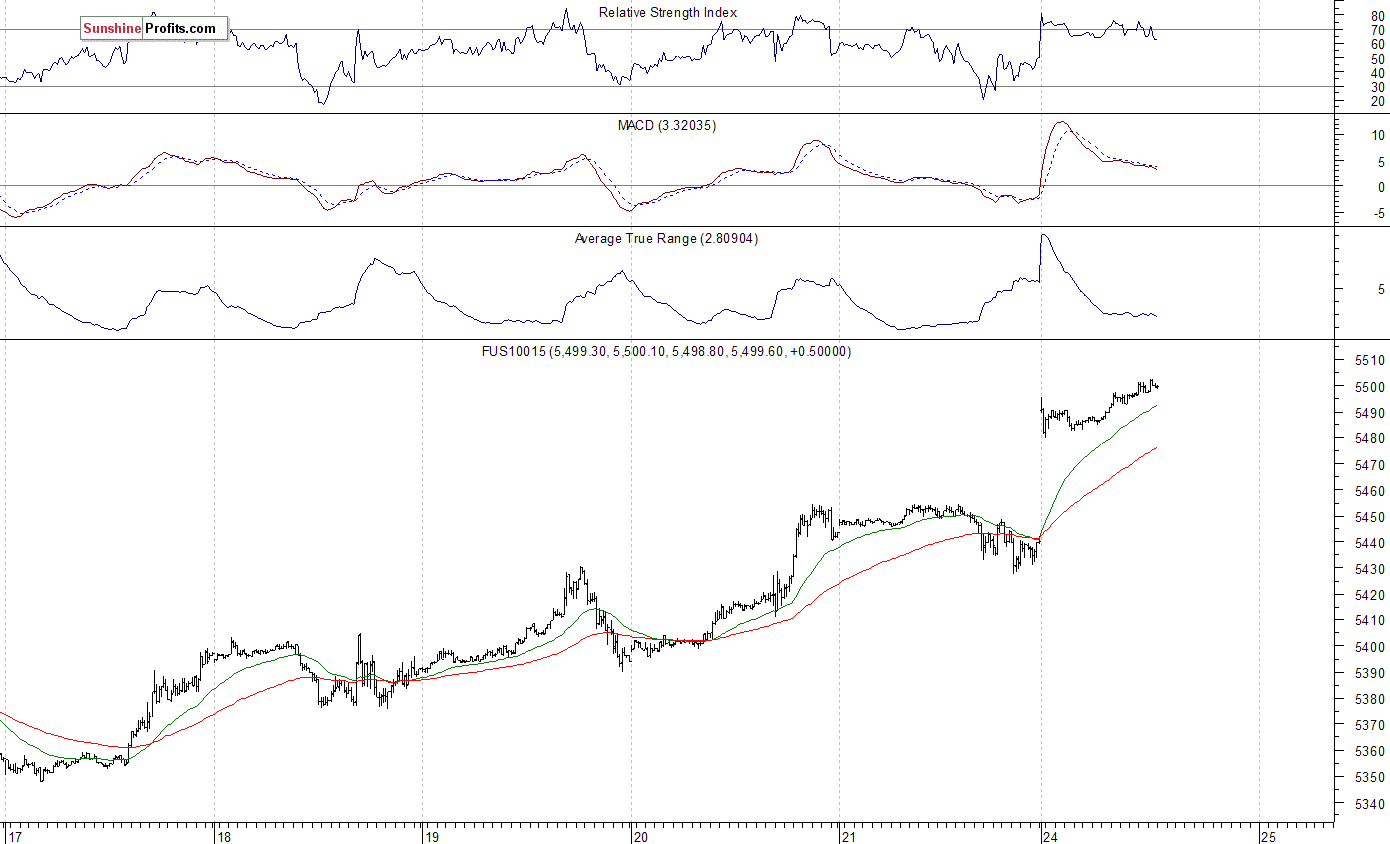
The technology Nasdaq 100 futures contract remains relatively stronger than the broad stock market, as it currently trades at new record high, along the level of 5,500. The nearest important support level is at around 5,480, marked previous level of resistance and intraday local lows. The next level of support remains at 5,450, marked by short-term consolidation. There have been no confirmed negative signals so far. However, we can see some short-term overbought conditions:
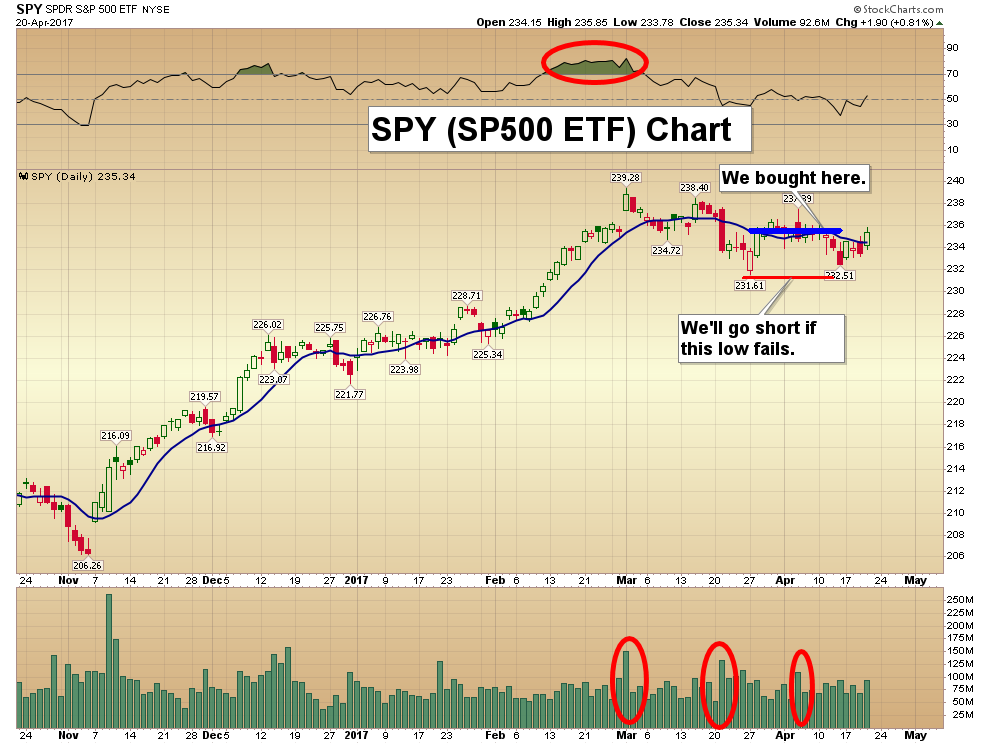
Concluding, the S&P 500 index extended its short-term consolidation on Friday, as investors awaited French presidential election outcome, among others. Expectations before the opening of today’s trading session are very bullish. The broad stock market index may get close to its early March record high. Will it break higher? Or is this just an upward move within almost two-month-long consolidation? The index is currently trading below five-month-long medium-term upward trend line. There have been no confirmed negative signals so far. However, we still can see medium-term negative technical divergences. Therefore, we continue to maintain our speculative short position (opened on February 15 at 2,335.58 – opening price of the S&P 500 index). Stop-loss level is at 2,410 and potential profit target is at 2,200 (S&P 500 index). You can trade S&P 500 index using futures contracts (S&P 500 futures contract – SP, E-mini S&P 500 futures contract – ES) or an ETF like the SPDR S&P 500 ETF – SPY. It is always important to set some exit price level in case some events cause the price to move in the unlikely direction. Having safety measures in place helps limit potential losses while letting the gains grow.
To summarize: short position in S&P 500 index is justified from the risk/reward perspective with the following entry prices, stop-loss orders and profit target price levels:
S&P 500 index – short position: profit target level: 2,200; stop-loss level: 2,410
S&P 500 futures contract (June) – short position: profit target level: 2,197; stop-loss level: 2,407
SPY ETF (SPDR S&P 500, not leveraged) – short position: profit target level: $220; stop-loss level: $241
SDS ETF (ProShares UltraShort S&P500, leveraged: -2x) – long position: profit target level: $15.47; stop-loss level: $12.98
Thank you.
Paul Rejczak
Stock Trading Strategist
Stock Trading Alerts

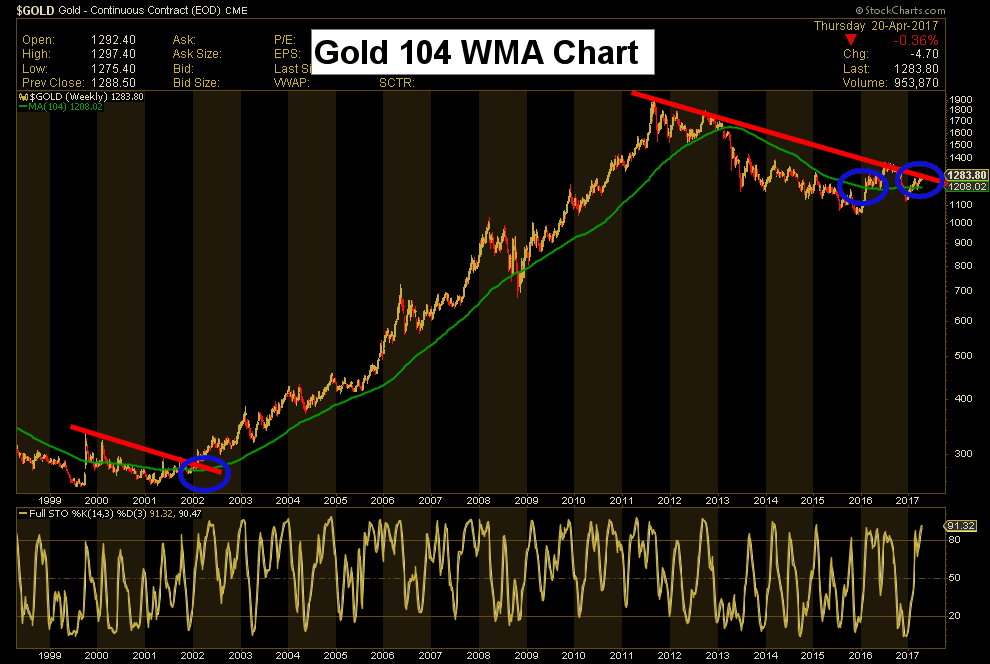
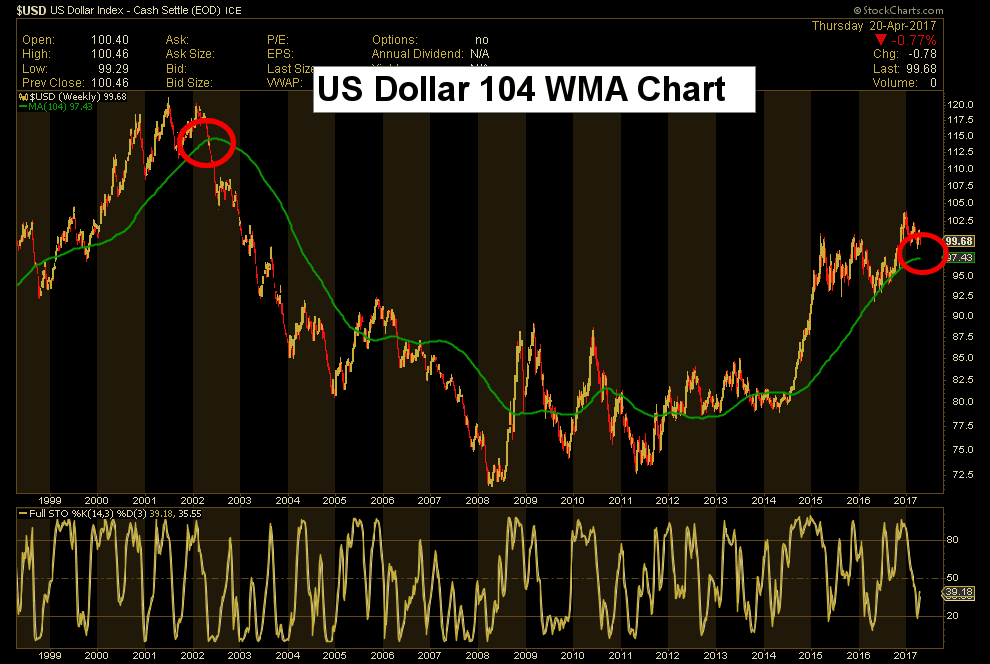
 1. Gold, Dow, & Dollar: The Big Picture
by Morris Hubbart
Big Picture (104 WMA) Charts & Video Analysis, Juniors Key Charts & Video Analysis, Key Charts & Tactics Video Analysis, Trader Time Key Charts Video Analysis
2. Extreme Pessimism indicates market is near inflection point!
by Chris Vermuelan
Big Picture (104 WMA) Charts & Video Analysis, Juniors Key Charts & Video Analysis, Key Charts & Tactics Video Analysis, Trader Time Key Charts Video Analysis
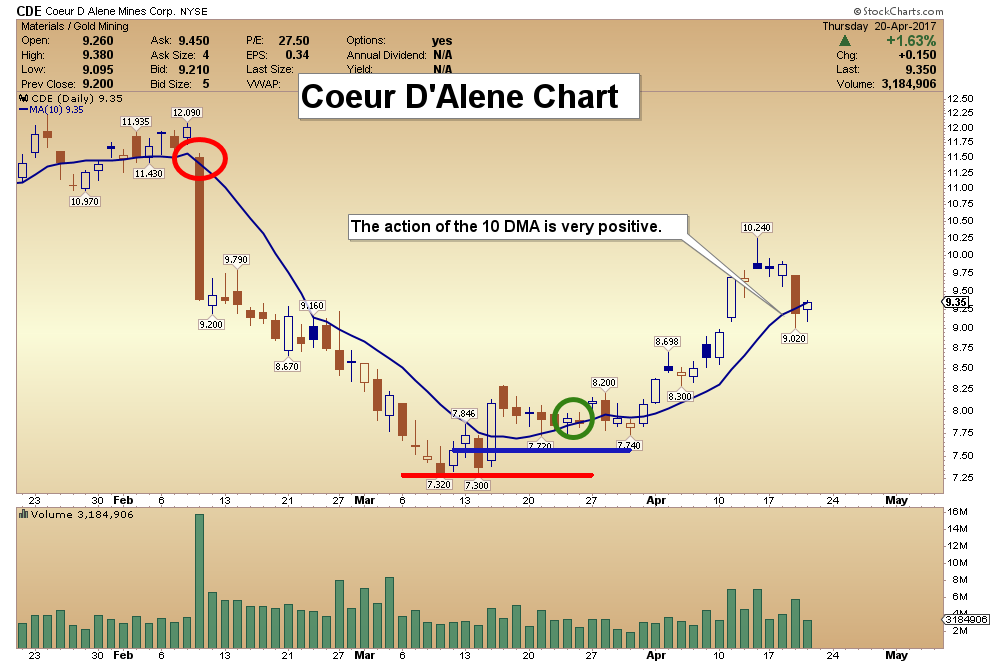
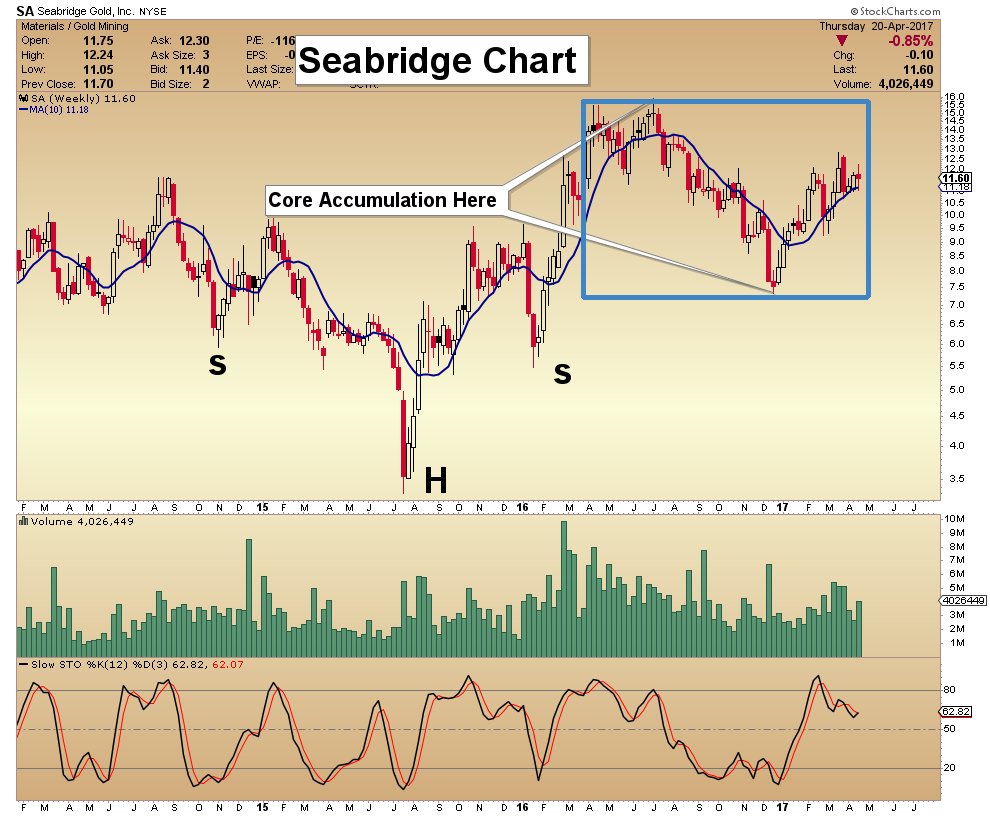
2. An In Depth Look at the Precious Metals Complex
by Rambus Chartology
There is a potential new pattern forming on some of the precious metals stock indexes which is only coming to light today. Before today’s price action there was only a guess of what may be forming with no confirmation. After today’s big gap breakout another piece of the puzzle is falling into place.

Today’s videos and charts (double click to enlarge):
Big Picture (104 WMA) Charts & Video Analysis


SF Juniors Key Charts & Video Analysis


SF60 Key Charts & Tactics Video Analysis


SF Trader Time Key Charts Video Analysis
Morris
The SuperForce Proprietary SURGE index SIGNALS:
25 Surge Index Buy or 25 Surge Index Sell: Solid Power.
50 Surge Index Buy or 50 Surge Index Sell: Stronger Power.
75 Surge Index Buy or 75 Surge Index Sell: Maximum Power.
100 Surge Index Buy or 100 Surge Index Sell: “Over The Top” Power.
Stay alert for our surge signals, sent by email to subscribers, for both the daily charts on Super Force Signals at www.superforcesignals.com and for the 60 minute charts at www.superforce60.com
About Super Force Signals:
Our Surge Index Signals are created thru our proprietary blend of the highest quality technical analysis and many years of successful business building. We are two business owners with excellent synergy. We understand risk and reward. Our subscribers are generally successfully business owners, people like yourself with speculative funds, looking for serious management of your risk and reward in the market.
Frank Johnson: Executive Editor, Macro Risk Manager.
Morris Hubbartt: Chief Market Analyst, Trading Risk Specialist.
website: www.superforcesignals.com
email: trading@superforcesignals.com
email: trading@superforce60.com
SFS Web Services
1170 Bay Street, Suite #143
Toronto, Ontario, M5S 2B4
Canada

APRIL 21, 2017, 10:40 AM
The first round of presidential elections in France is held on Sunday. What can we expect from that event and how can it affect the gold market?
In the recent edition of the Market Overview, we wrote that centrist Emmanuel Macron and nationalistic Marine Le Pen were expected to move on the next round. However, the situation has complicated a bit since then. As you can see on the chart below, actually four candidates have pretty good chances to advance to the next round. It’s because both hard-left Jean-Luc Melenchon and conservative Francois Fillon have gained momentum recently.
Chart 1: Opinion polls for the first round of voting (smoothed 14-day weighted moving average) updated daily from Wikipedia.
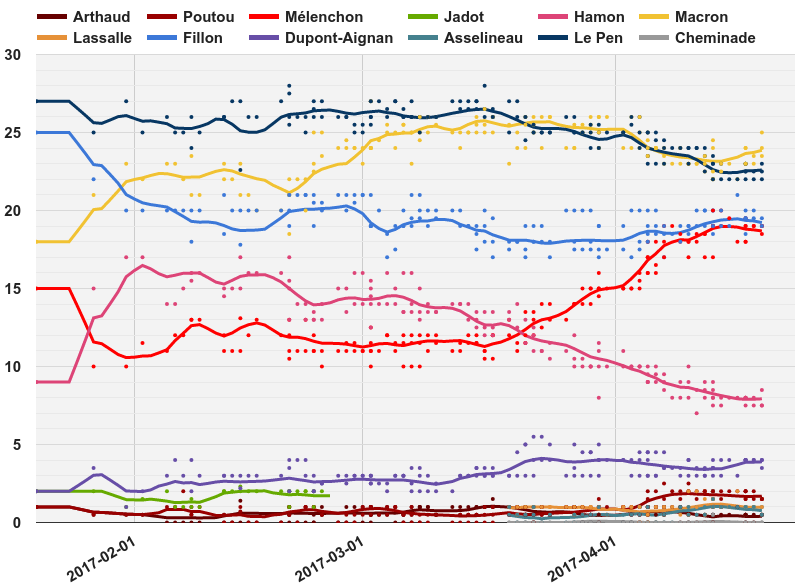
It’s good news for the gold market, as it means higher uncertainty. Now, Marine Le Pen is not the only terrifying candidate in town. Jean-Luc Melenchon’s economic program is similarly frightening for the financial markets. For example, he proposed to impose a 100 percent tax on those who earn above €400,000. Yup, you guessed, he is a commie and a fan of Hugo Chavez.
The consensus is that Macron and Le Pen will move on to the next round. Therefore, if this scenario realizes, the markets should not be affected significantly. And since Macron is expected to beat Le Pen in the run-off, there may be a relief rally in the French bonds and the euro. The safe-haven demand for gold should decline then, but a weakening dollar would support the yellow metal.
Macron and Fillon would be the best for the financial markets, as both candidates are from the mainstream, so radical changes would probably not happen. It would be the worst scenario for safe havens, but the best for the euro.
Other scenarios are much more interesting. Fillon and Le Pen would go much more neck and neck than Macron and Le Pen. Higher uncertainty should support the safe-haven demand for the gold market. Melenchon and Fillon would be even more fascinating, as the former is expected to beat the latter in the second round. The vision of a communistic president in France could encourage investors to buy some gold. But probably the best scenario for gold would be a run-off between Melenchon and Le Pen. It would be like a duel between Sanders and Trump, only squared. Such a scenario could trigger some financial panic and boost safe-haven demand for gold.
The bottom line is that there is the first round of the French elections this weekend. The outcome of the election is uncertain, since four candidates have chances to move on to the run-off. If Macron advances on Sunday, he is the most likely to win in the run-off, no matter who he faces. We could see then a relief in risky markets and a decline in gold prices. But if he fails, then any outcome is possible. In this scenario, investors should expect rising uncertainty which should provide additional support for the price of gold. The most market-unfriendly outcome would clearly be a face-off between far-right Le Pen and far-left Melenchon. The risk appetite could soften then, which may boost the safe-haven demand for gold (although the likely appreciation of the U.S. dollar may limit the gains). Will this happen? Given a tarnished reputation of polls and a wild surge in Melenchon’s odds, only time will say. Stay tuned!
French Elections and Gold @ 7:18 am Friday April 21st
In the previous edition of the Market Overview, we analyzed the potential impact of the European elections on the gold market. As the Dutch elections are behind us, let’s see how the Wilders’ defeat affected the markets and the political outlook for France, where people will vote for the president on April 23.
Investors reacted positively to the outcome of the Dutch election, relieved that populists did not win. European stocks and the euro rose, while the France-Germany 10-year bond yield spread declined after the elections. This is because Wilders’ failure is considered to indicate that “the wrong kind of populism” is losing momentum.
Although Wilders lost, it does not mean that all risks vanished and the threat of protectionism has gone. Actually, the triumphant party won fewer seats in the last parliament, while Wilders got more than the last time (the same applies to Marine Le Pen, who is much more popular than her father, the founder of the National Front). And Dutch voters are still flirting with populism – they are just more dispersed, as people also voted for other right-wing parties. Moreover, other parties, including the ruling People’s Party for Freedom and Democracy, adopted a more right-wing tone during the campaign, as the prime minister’s decisive approach toward Turkish diplomats showed. Let’s face it: Wilders is the second force in the country now, so he would definitely influence the domestic politics. In a sense, a populist party did not win, but populist ideas were pushed to the mainstream political agenda instead.
Therefore, it is too early to state that Le Pen is set to fail. Importantly, her odds of winning in the run-off increased after the Dutch elections. As a reminder, according to the polls conducted before the presidential television debate, she will win in the first round of voting, but lose in the run-off. Her odds of winning in the second round are 40 percent with Macron and 45 percent with Fillon, but as Emmanuel Macron is believed to have won the debate, the chances of Le Pen fell slightly. The French election is a different kettle of fish, as there are only few candidates (the run-off is between the two contenders who get the most votes in the first round of the elections), while the parliamentary election in the Netherlands was between 28 parties. If the political scene in the Netherlands was not so fragmented, Wilders could win. Another issue is that French economy is performing worse than the Dutch (the unemployment rate is twice as high, while the GDP growth is half of the Netherlands). Hence, although the probability of Le Pen’s victory is not high (in the second round, voters are likely to build a coalition against her), we believe that her chances did not change significantly after the outcome of the Dutch elections. In other words, investors should not extrapolate trends between the Netherlands and France. The presidential election in the latter remains one of the major risks for the euro area.
Thus, investors are nervous ahead of the French elections, and we could see a short-term volatility in European assets and the euro; we could also observe some inflows into gold, the ultimate safe-haven asset. For example, the euro was up 0.6 percent to a six-week high after the French presidential debate, while the French interest rate premium over Germany declined. According to the polls, centrist Emmanuel Macron won the debate, which eased the political risks to the EU from Le Pen. The price of gold rose together with the euro. It shows that investors started to take into account the political uncertainty in Europe after trading solely on expectations of the Fed’s and Trump’s actions. It also indicates that the exchange rate channel is more important for the yellow metal than the uncertainty channel.
However, long-term investors should not overstate the impact of that election on the gold market. As the chart below shows, the price of gold actually declined before the Dutch elections, while the euro gained against the U.S. dollar.
Chart 1: The price of gold and the EUR/USD exchange rate in 2017.

It implies that macroeconomic factors and central banks’ actions may be more important drivers for the currency exchange rates and the price of gold in the long-term. Surely, the French election is much more important than the Dutch, given the size of the French economy and the key role of the country in the EU, but even the surprising and really disrupting Brexit vote caused only a short-term rally in gold prices. Hence, the EUR/USD exchange rate and the price of gold may be strongly affected by the prospects of the election in the short-run, but their impact may not be long lasting.
If you enjoyed the above analysis and would you like to know more about the impact of the current macroeconomic trends and political uncertainty on the gold market, we invite you to read the April Market Overview report. If you’re interested in the detailed price analysis and price projections with targets, we invite you to sign up for our Gold & Silver Trading Alerts. If you’re not ready to subscribe at this time, we invite you to sign up for our gold newsletter and stay up-to-date with our latest free articles. It’s free and you can unsubscribe anytime.
Thank you.
Arkadiusz Sieron
Sunshine Profits‘ Gold News Monitor and Market Overview Editor

When a resistance zone gets tested multiple times it usually breaks. It shouldn’t be long before the Nasdaq breaks through this resistance. After it does it will pull the rest of the market up with it.

https://blog.smartmoneytrackerpremium.com/
…related:
What Just Took Place In Stocks Has Rarely Happened In The Past 117 Years

-
I know Mike is a very solid investor and respect his opinions very much. So if he says pay attention to this or that - I will.
~ Dale G.
-
I've started managing my own investments so view Michael's site as a one-stop shop from which to get information and perspectives.
~ Dave E.
-
Michael offers easy reading, honest, common sense information that anyone can use in a practical manner.
~ der_al.
-
A sane voice in a scrambled investment world.
~ Ed R.
Inside Edge Pro Contributors

Greg Weldon

Josef Schachter

Tyler Bollhorn

Ryan Irvine

Paul Beattie

Martin Straith

Patrick Ceresna

Mark Leibovit

James Thorne

Victor Adair