
Economic Outlook
The rise of French far-right presidential candidate Marine Le Pen has made a lot of people nervous since, among many other things, she’s in favor of leaving the eurozone, which would pretty much end the common currency. But since polling has shown her making the two-person run-off round but then losing to a mainstream candidate, the euro-elites haven’t seen any reason to panic.
Here, for instance, is a chart based on February polling that shows Le Pen getting the most votes in the first round, but then – when mainstream voters coalesce around her opponent – losing by around 60% – 40%. The establishment gets a bit of a scare but remains firmly in power, no harm no foul.

Then came the past month’s debates in which a previously-overlooked communist candidate named Jean-Luc Mélenchon shook up the major candidates by pointing out how corrupt they all are. Voters liked what they heard and a significant number of them shifted his way.
Mélenchon: Far-leftist surges in French polls, shocking the frontrunners
(France 24) – In a presidential campaign with more twists than a French braid, Jean-Luc Mélenchon’s sudden play to become France’s third man — or better — is shaking up the race.
With ten days to go before April 23’s first round vote, the colourful, cultured and cantankerous far-leftist has the frontrunners on the defensive.
Suddenly, the grumpy far-leftist — a showman in a Chairman Mao jacket who openly admired late Venezuelan populist leader Hugo Chavez — holds the mantle of France’s most popular politician. In the course of a whirlwind month, the 65-year-old Mélenchon surged nine spots to number one in weekly glossy Paris Match’s opinion poll. A full 68 percent of those surveyed hold “favourable opinions” of the far-left candidate, the poll by the Ifop-Fiducial firm showed.
On some polls, Mélenchon has now bypassed embattled conservative François Fillon for third place in a presidential race that will see the top two advance to the May 7 run-off.
An Ipsos poll on Tuesday put Mélenchon a half-point ahead of Fillon for third place in the race, behind National Front leader Marine Le Pen and the independent centrist Emmanuel Macron. With 18.5 percent, the far-leftist has gleaned 4.5 percent in just two weeks, with Macron and Le Pen tied on 24 percent.
Mélenchon wants to quit NATO, the World Trade Organization, the International Monetary Fund, the World Bank, and block European trade treaties with the United States and Canada. He promises a French referendum on whether to stick with the reworked EU he is pledging to negotiate or leave the bloc altogether.
Here’s a chart from the Washington Post showing just how tight the race for the run-off spots has become:

It’s still unlikely that both Le Pen and Mélenchon will make the run-off, but based on the above chart it’s suddenly possible. This would be the cultural equivalent of a Trump – Bernie Sanders race in the US, but with – believe it or not — even higher stakes because both Le Pen and Mélenchon would threaten the existence of both the euro and the European Union, the world’s biggest economic entity.
So it almost doesn’t matter who wins that run-off. Just the prospect of having one or the other in charge would tank the euro and set off a stampede out of Italian, Spanish and Portuguese bonds, possibly doing irreparable damage to the eurozone before the eventual winner even takes power.
To repeat the theme of this series, when you screw up a country’s finances you take its politics along for the ride. In France, the right feels betrayed by open borders and excessive regulation, the left by an unaccountable elite that always seems to profit at everyone else’s expense. And both sides suffer from soaring debt at every level of society.
So if a fringe candidate doesn’t win this time around, the mainstream will just make an even bigger mess, raising the odds of a fringe victory next a few years hence.

….also from Safehaven: Fantasyland Reality Check: Fed’s Beige Book Makes Absurd Claims in at Least 3 Places

 The global capacity for debt has reached it’s zenith. So-called developed markets and emerging markets have all reached maximum debt load. Of the all the major countries that impact the global GDP name one that’s not fully levered with debt. I’ll wait here while you look for that needle in a haystack.
We came into the bail outs. The G7 had levered up. Then we had the emerging markets lever up and they’re finished levering up and now everybody’s levered up.
There is no place to go. We can go to an equity model and we can optimize bottom-up but that requires a legitimate pricing function. And when you’re trying to run the whole thing with fake intel, fake science, fake news…The harvesting machine needs a new way to dig and digital currency and digital cash is that way. But you need all those countries in the tent and you need the ability to force everybody into a digital system. Source
The world (tent) must get inline with the idea of global governance and global currency, otherwise, it will not work.
Cryptocurrencies and all the people who believe this digital illusion is going to somehow save us from the evil banksters are overlooking what I have been saying since bitcoin first came onto the scene – it plays into the hands of the banksters and their desire to move us all to a digital currency. If someone believes for a second that Amazon or any other large multinational corporation that conducts retail business is going to accept bitcoin when they have been instructed not to, they are simply living in a fantasy.
That’s why the guys from bitcoin drive me nuts. Because they think “Oh this is how we’re going to be free“. No, you’re prototyping Mr. Globals digital currency.Source
If a person thinks the central banks and their digital currency will COMPETE with bitcoin you are not seeing the entire picture. That is not going to happen – EVER. The reason gold was outlawed in the U.S. in the 1930’s was to keep gold from competing with the Federal Reserve Note. Why would anyone believe the Federal Reserve is going to allow a digital form of currency to compete with their wealth transferring mechanism on a large scale?
In the video – America: Freedom to Fascism – Aaron Russo discusses what one of the Rothschilds explained to him. This scheming, blood sucking bankster tells Mr. Russo the people will all be chipped and the currency will be digital. Do you honestly think bitcoin will be included in this “mark of the beast” technology? If the cash is eliminated and we can only use digital currency the banks would have the ability to turn off an individuals access to funds. If bitcoin, or any other cryptocurrency, is allowed to operate this would not work. The banks would not be able to enslave the people. The slave trade would collapse.

Click image to Enlarge
The only remaining question is wether China and Russia are in on the scheme. China already has a digital currency and most of the transactions in China are conducted without the use of cash. So, China is on board. That leaves Russia. What will Russia’s role be in moving to a digital currency operated by the central banks?
For me, it always comes back to gold and gold as currency. How would gold work in this new paradigm? What role would gold play? Will gold be, once again, outlawed, confiscated or simply remain outside the system?
Gold and silver have been money for thousands of years. The golden rule still applies – he who has the gold makes the rules. China and, their military partner, Russia, have lots of gold. India has a lot of gold in the hands of the citizens, but the central bank of India is not a major player like China and Russia. India has not been purposely adding to their gold horde the way Russia and China have been doing for the past decade. It’s funny to see India doing all they can to get their citizens to move away from acquiring physical gold while across the border in China the government is encouraging – and make it very easy – for the citizens to acquire gold. The Chinese citizens have been responding ever since this initiative was first announced. On the other hand, the citizens of India do all they can to keep the banking cabal and corrupt government out of their gold stash.
The western “developed” world is in desperate need of a major large scale war. Large scale war is the one thing that can cover the crimes of the western banking cabal and allow the system to be reset while the criminals blame someone else. Russia and China are the obvious targets of the U.S./U.K. with North Korea playing a minor role and possibly being used as a pawn to jump-start the whole thing. Syria is all about the oil and gas pipelines, so, Syria could be a jumping off point as well.
Whoever starts the next world war rest assured the U.S. will not be spared. Bombs will land on this soil and eliminate entire cities.
The world can not escape the debt saturation we find ourselves entangled. There are only a handful ways to get out of the web and war has always been, throughout all of history, the primary way this has happened. The difference today is nuclear weapons. Nuclear weapons create problems for thousands of years so is it really a viable option? A debt jubilee/reset is another way debt has been handled throughout history, however, the world was a lot smaller place. Revert to a gold standard and reset the debt to gold? I don’t know what the answer is, but I do know our time is running out.
This is a must listen interview with Catherine Austin-Fitts. She explains the above in greater detail and paints the picture all the way to the edge.

Before we look at tonight’s charts I would like to thank Sir Plunger for putting on the short oil trade this week while I was recovering from surgery. You won’t find a more through and in depth look at oil than what Sir Plunger offered. And wouldn’t you know it his timing as usual was impeccable. Oil dropped almost 4% today.
Now lets turn our attention to the sector which many members have a love hate relationship with.
There is a potential new pattern forming on some of the precious metals stock indexes which is only coming to light today. Before today’s price action there was only a guess of what may be forming with no confirmation. After today’s big gap breakout another piece of the puzzle is falling into place. Nothing is ever guaranteed when it comes to the markets, so all we can do is get the odds in our favor and try to recognize a potential pattern as soon as possible. Once you think you may have something figured out you then put together a game plan and work it until it either plays out or fails.
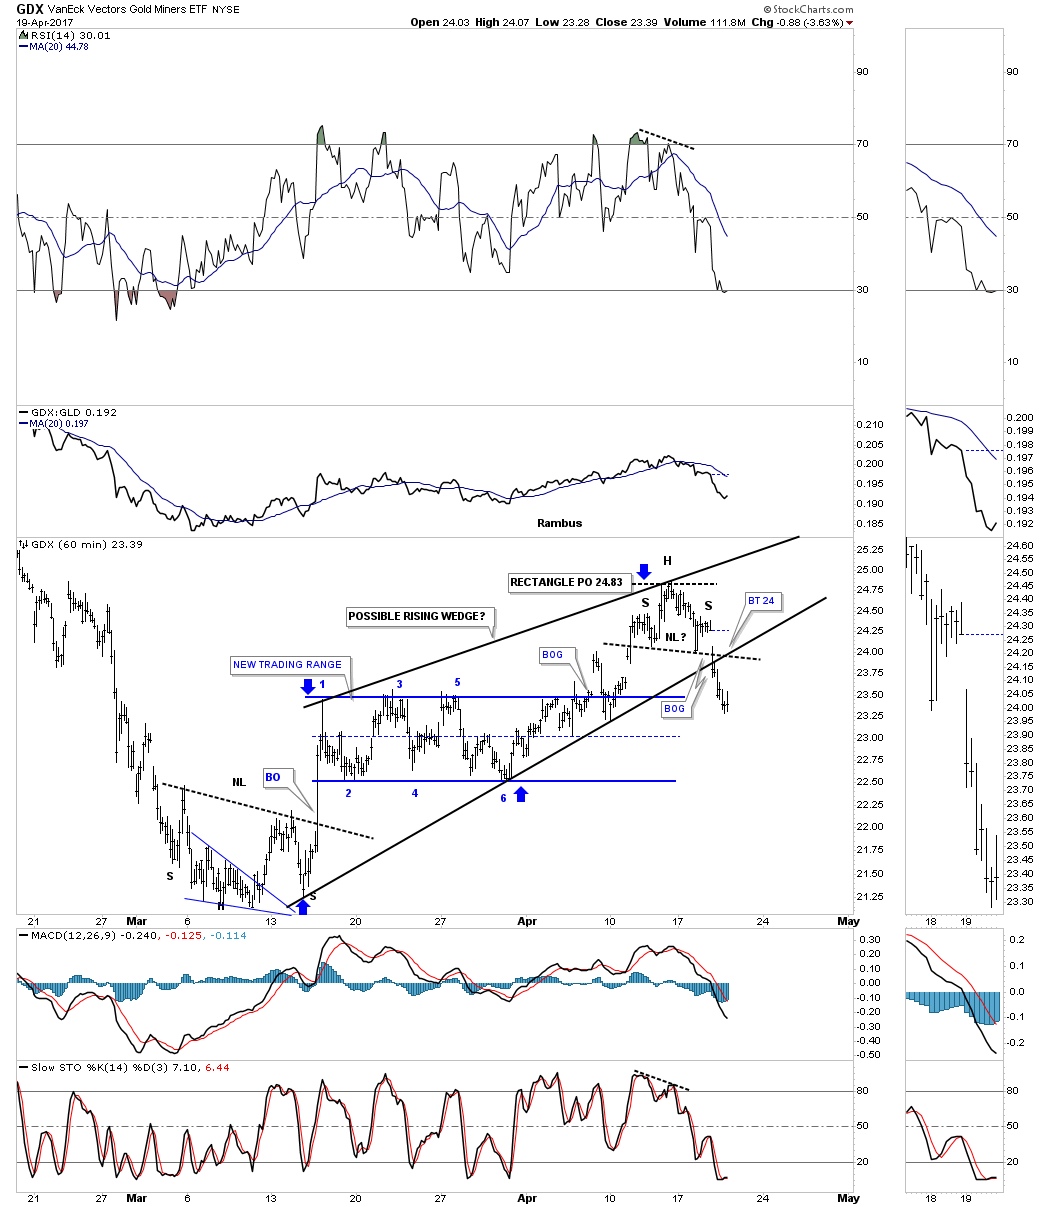
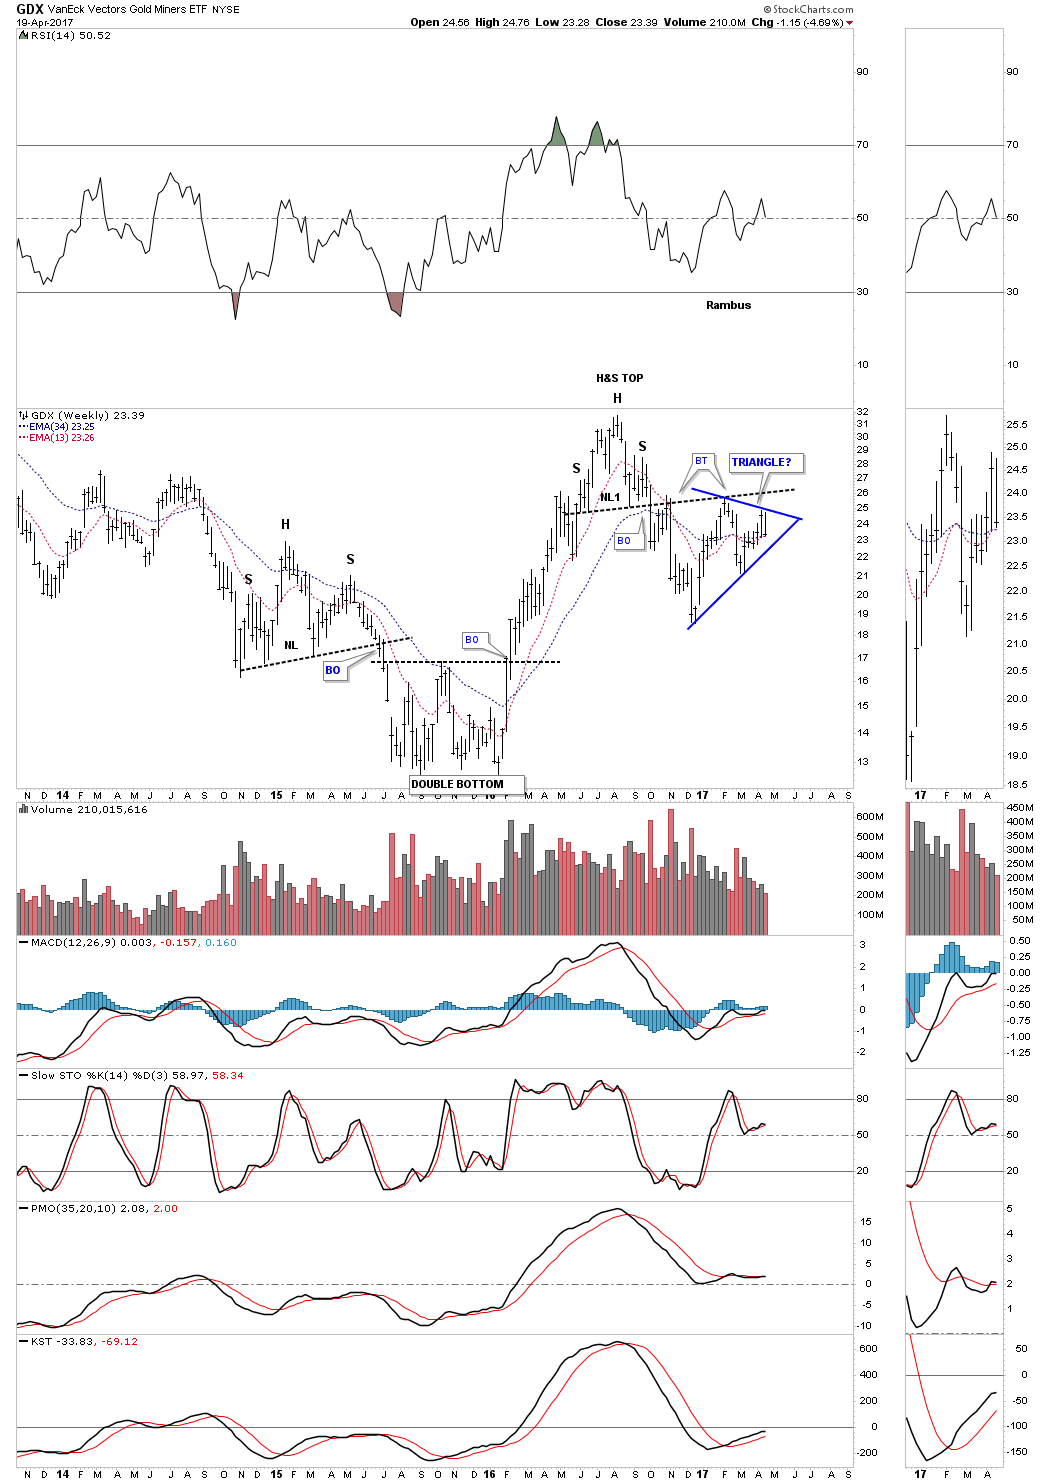
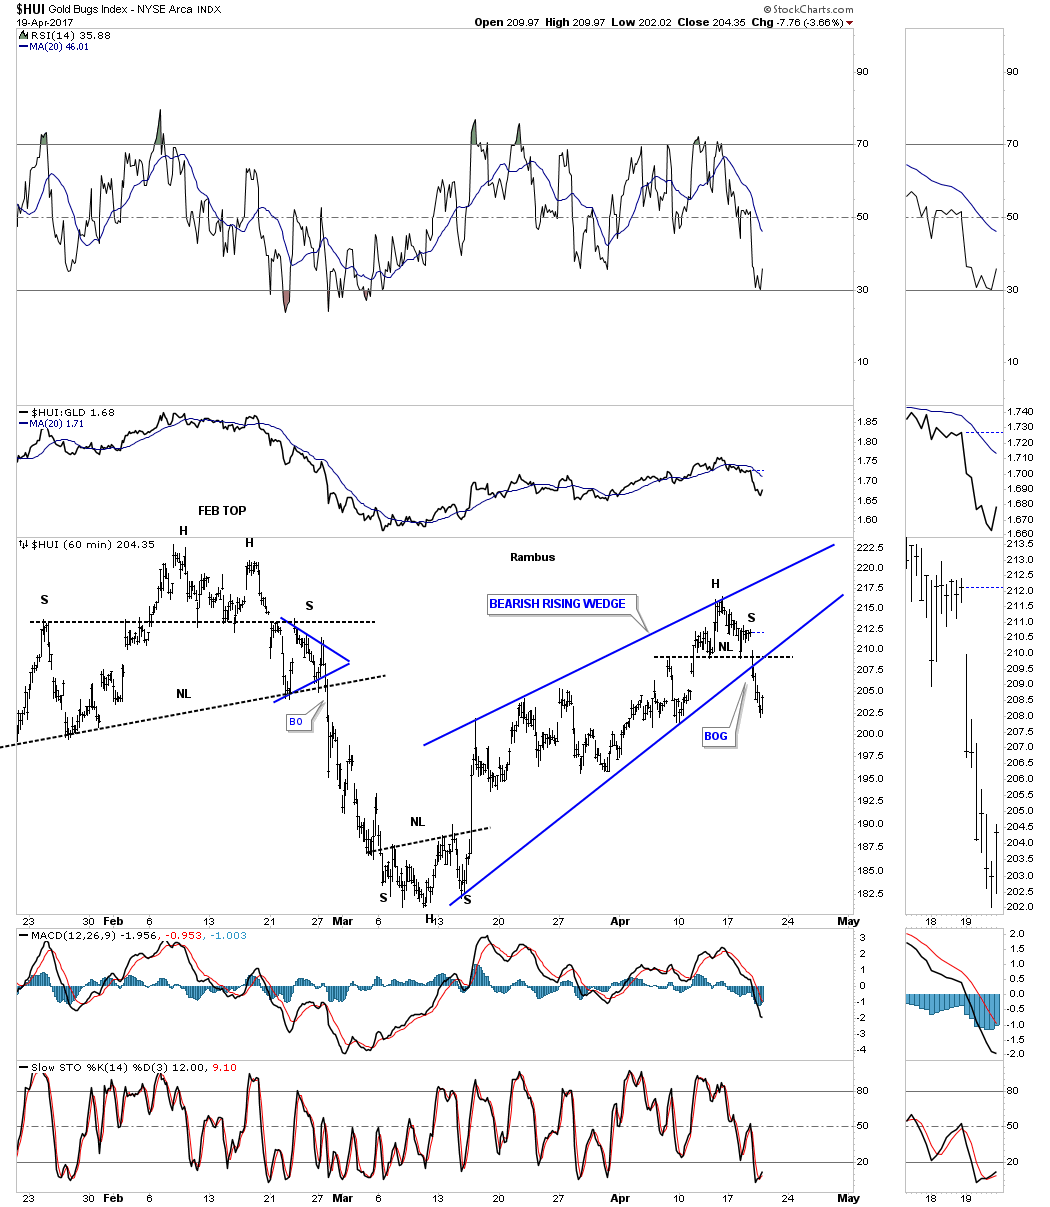
Lets start with the 60 minute chart for the GDX which shows the now completed bearish rising wedge. We got the H&S top which formed at the top of the rising wedge as the 4th reversal point making the rising wedge a consolidation pattern to the downside. It’s still possible we could see a backtest to the 24 area before the impulse leg down begins in earnest, but there are no guarantees. Note the inverse H&S bottom that formed in March which reversed the decline from the August 2016 high, a H&S at the bottom and a H&S at the top, both of which are reversal patterns.
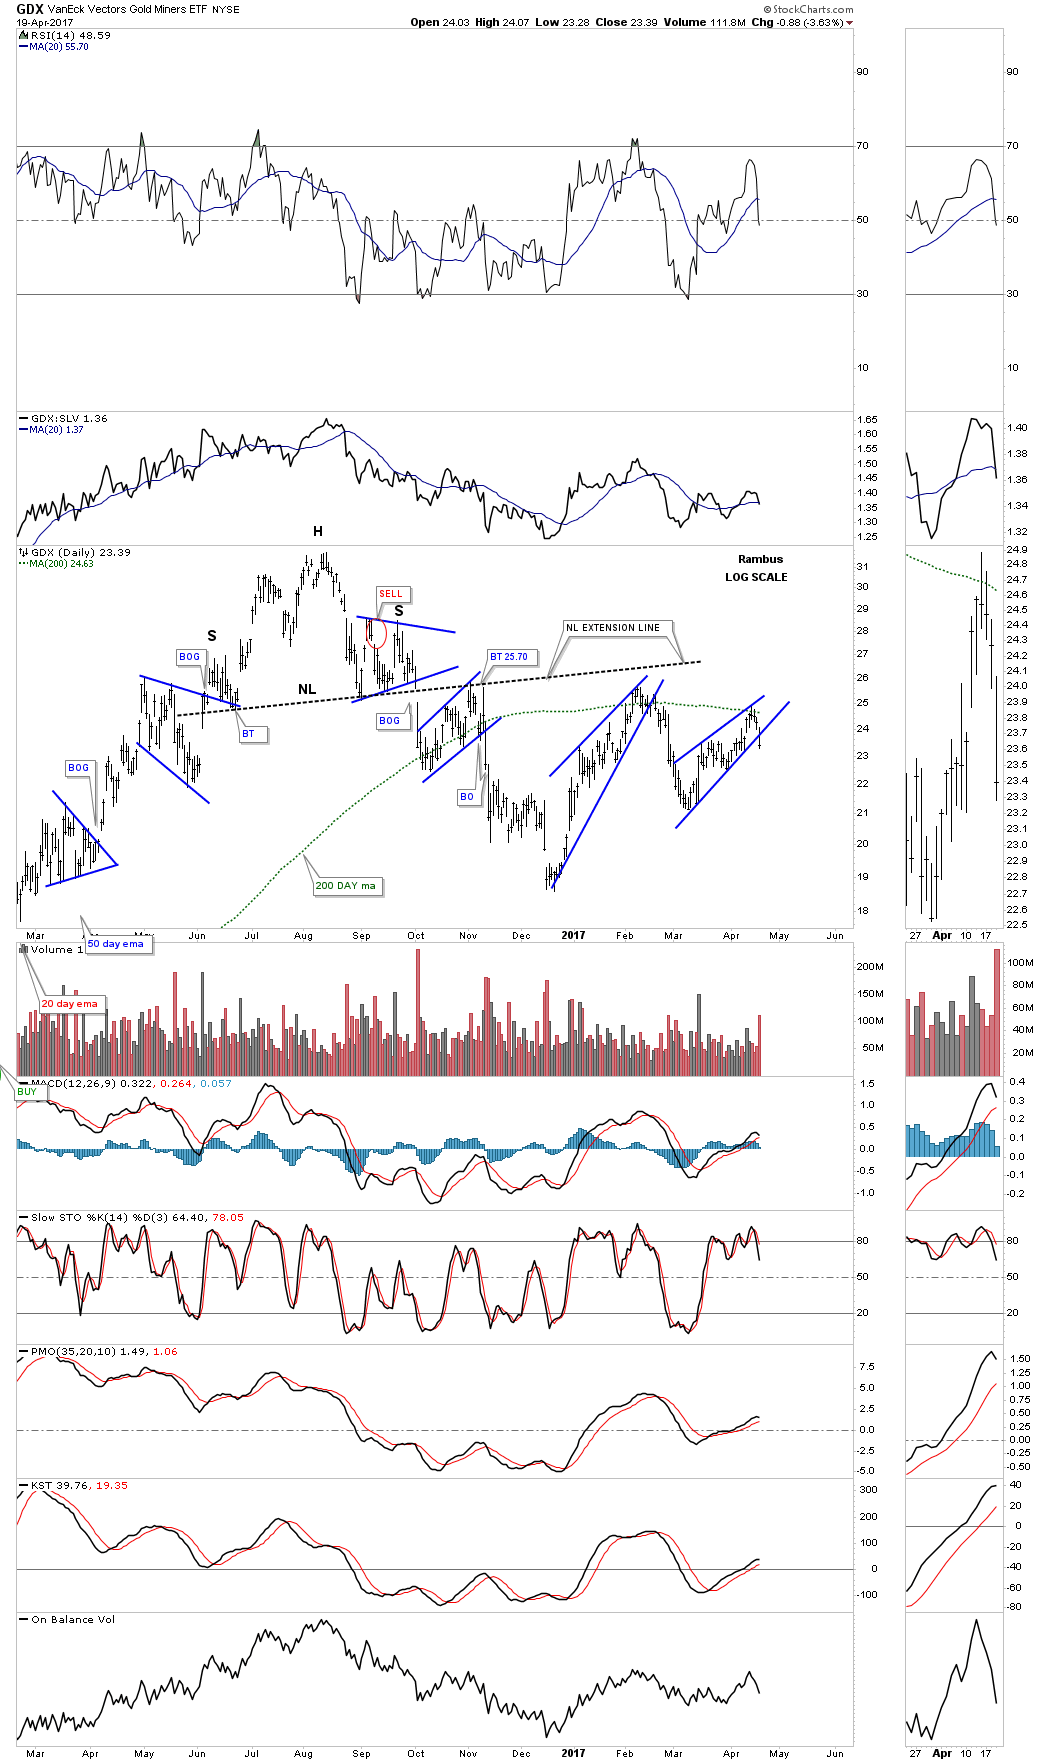
This next chart is a one year look we were watching during the big impulse leg up out of the January 2016 low to the August 2016 high. Here you can see another H&S top which reversed the 2016 rally. After forming several smaller consolidation patterns the GDX bottomed out in December of 2016. That 2 month rally produced the first blue bearish rising wedge with the 200 day ma offering resistance. If you recall we went short on the backtest to the underside of the rising wedge until the Fed announcement, which spiked GDX higher at the beginning of our current and smaller blue rising wedge. Today we shorted the PM stock indexes again, as the price action is in a similar spot to the bigger blue bearish rising wedge.
During the formation or any consolidation pattern there needs to be at least 4 reversal points to make it valid. Sometimes there are 6, 8 or more reversal points before a consolidation pattern is finished building out. Many times a consolidation pattern can be created with several smaller patterns which shows the reversal points. With today’s breakout below the bottom rail of the smaller blue bearish rising wedge it puts a possible triangle consolidation pattern in play. Now you can see how a potential game plan may start to develop.
The first thing we’ll look for is a possible backtest to the underside of the blue rising wedge and then a fall away. Next we’ll need to see how the price action interacts with the bottom rail of the nearly 4 month black triangle consolidation pattern, which still needs to complete the 4th reversal point. One piece of the puzzle at a time, but as long as the game plan keeps playing out there is no need to change things.

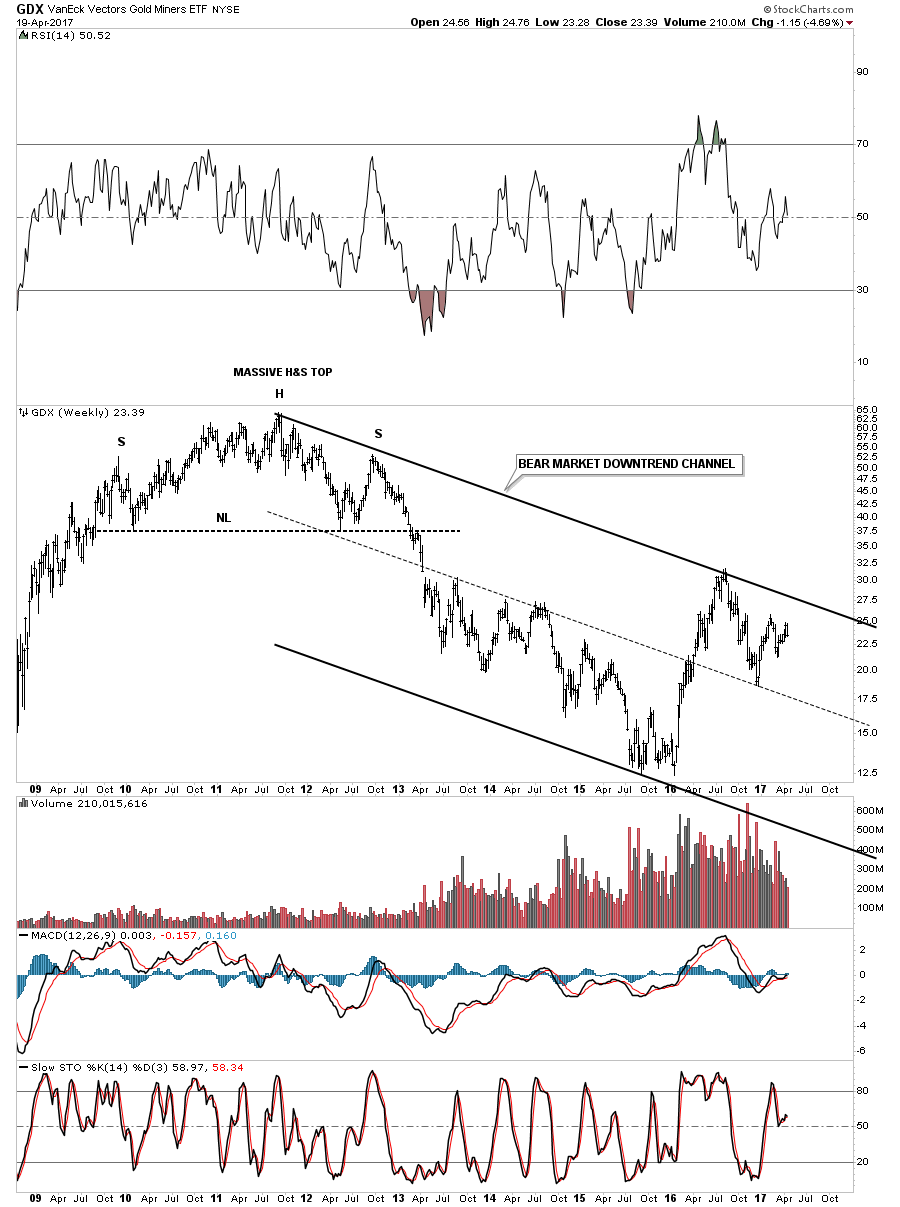
The weekly chart for the GDX shows how the potential triangle consolidation pattern fits into the big picture.
Lets look at one more PM stock index to see how its price action is building out. The 60 minute chart for the HUI shows it broke out today below the bottom rail of its bearish rising wedge.
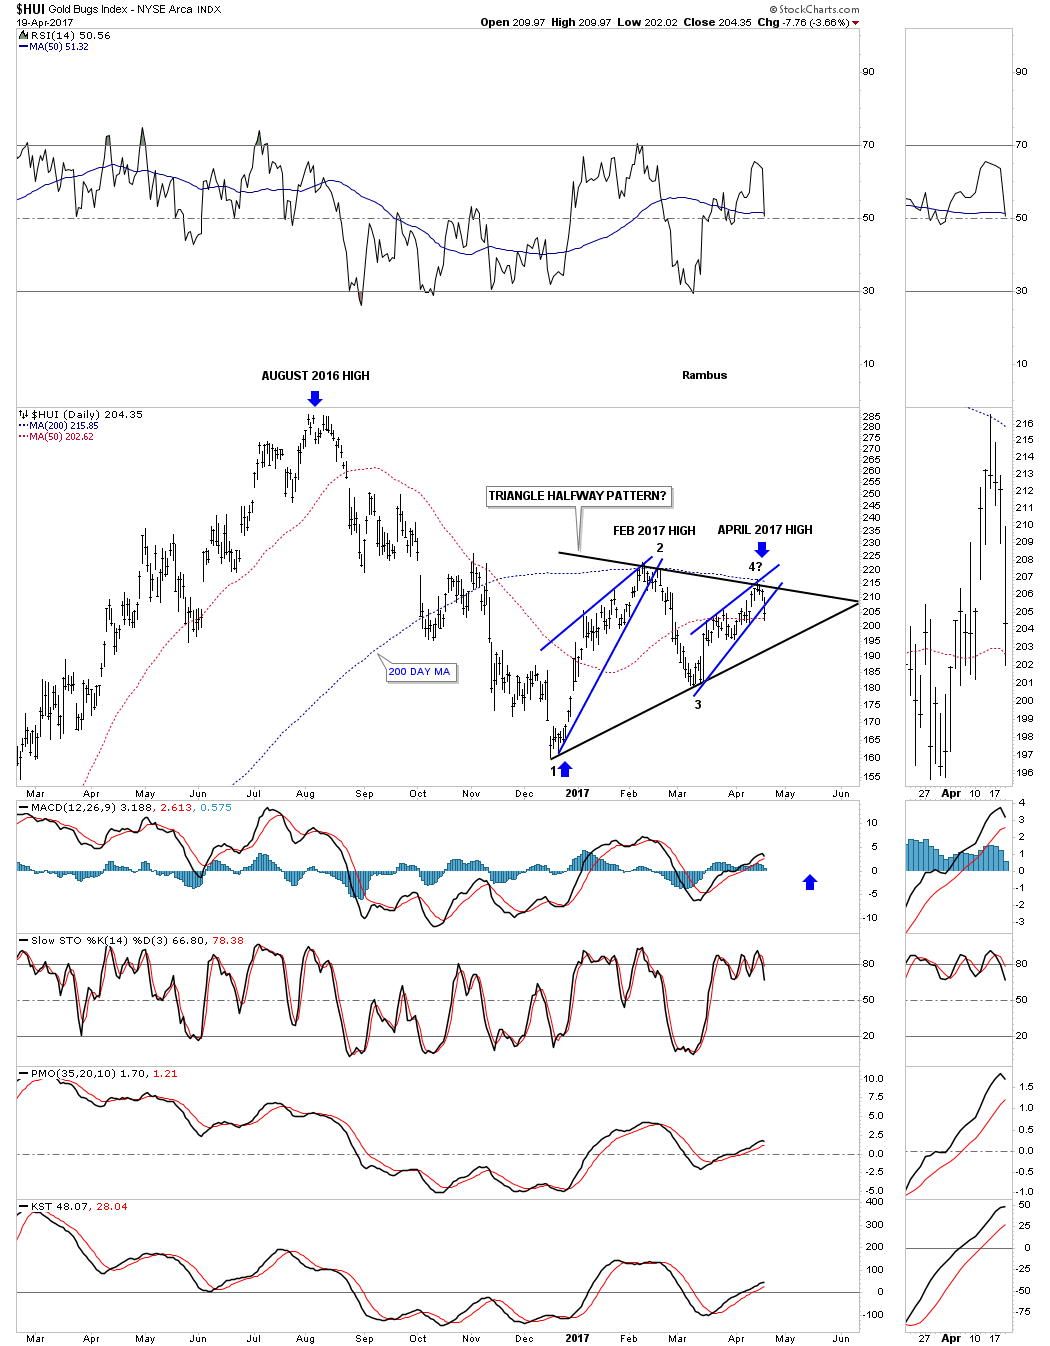
In a confirmed downtrend one needs to see lower lows and lower highs. This daily chart below shows the August 2016 high, followed by the Feb 2017 high, followed by our most recent high in April, all lower highs. As you can see there is still more work to be done in building out the black triangle, but as long as things keep following the script we need to let things play out.
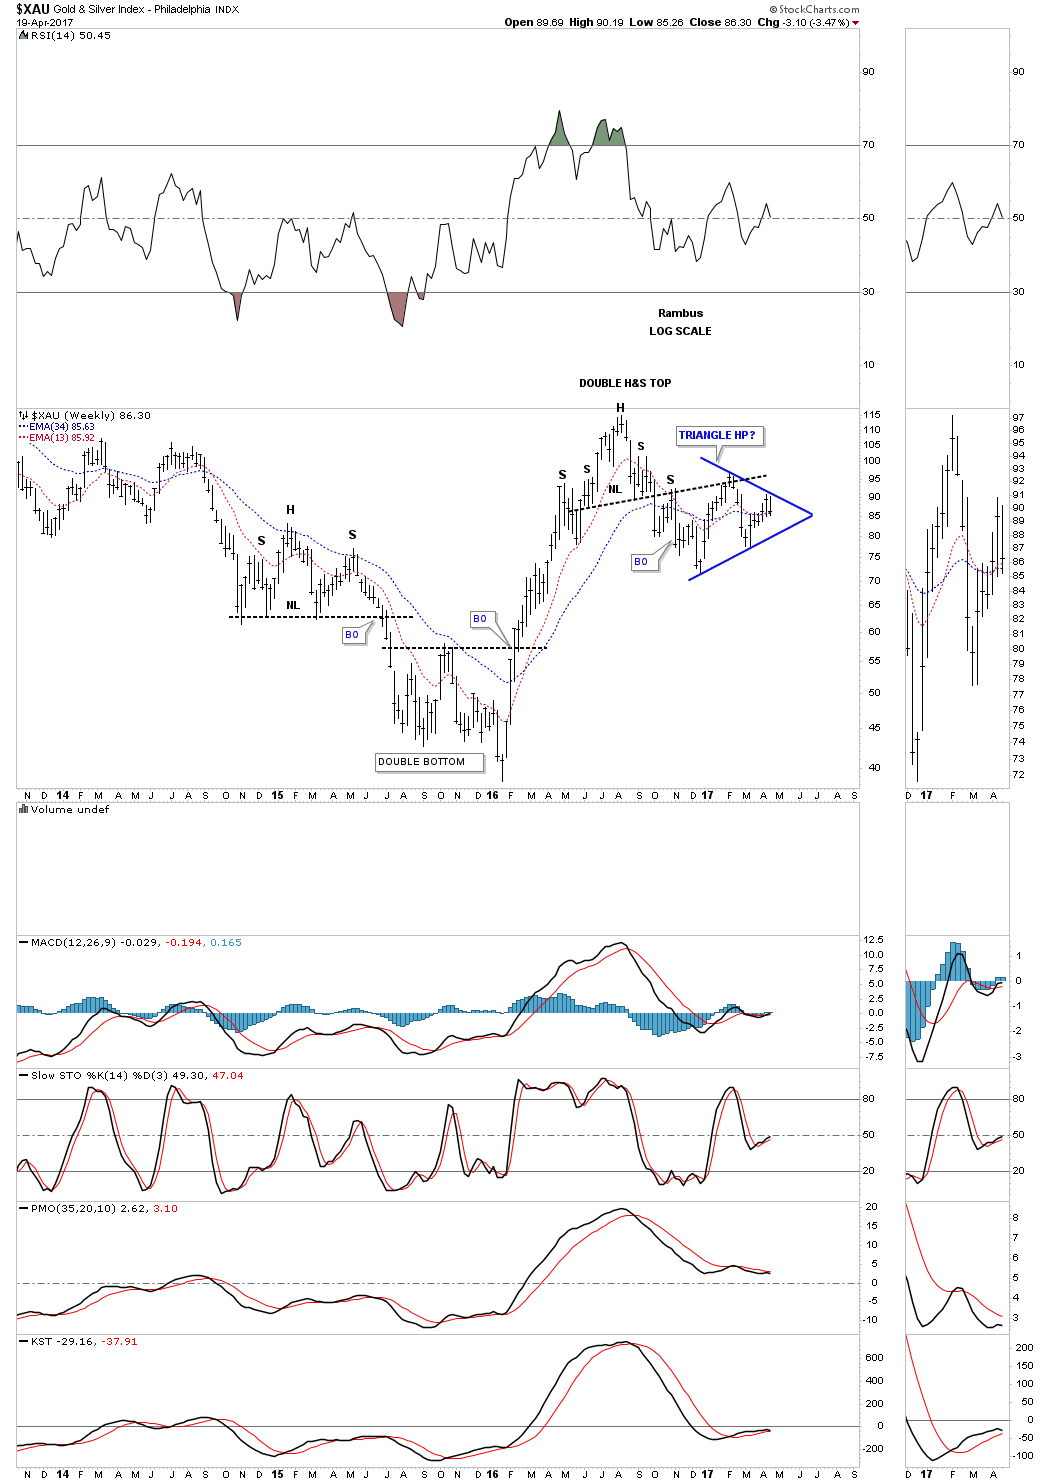
Below is the $XAU and its potential black triangle consolidation pattern.
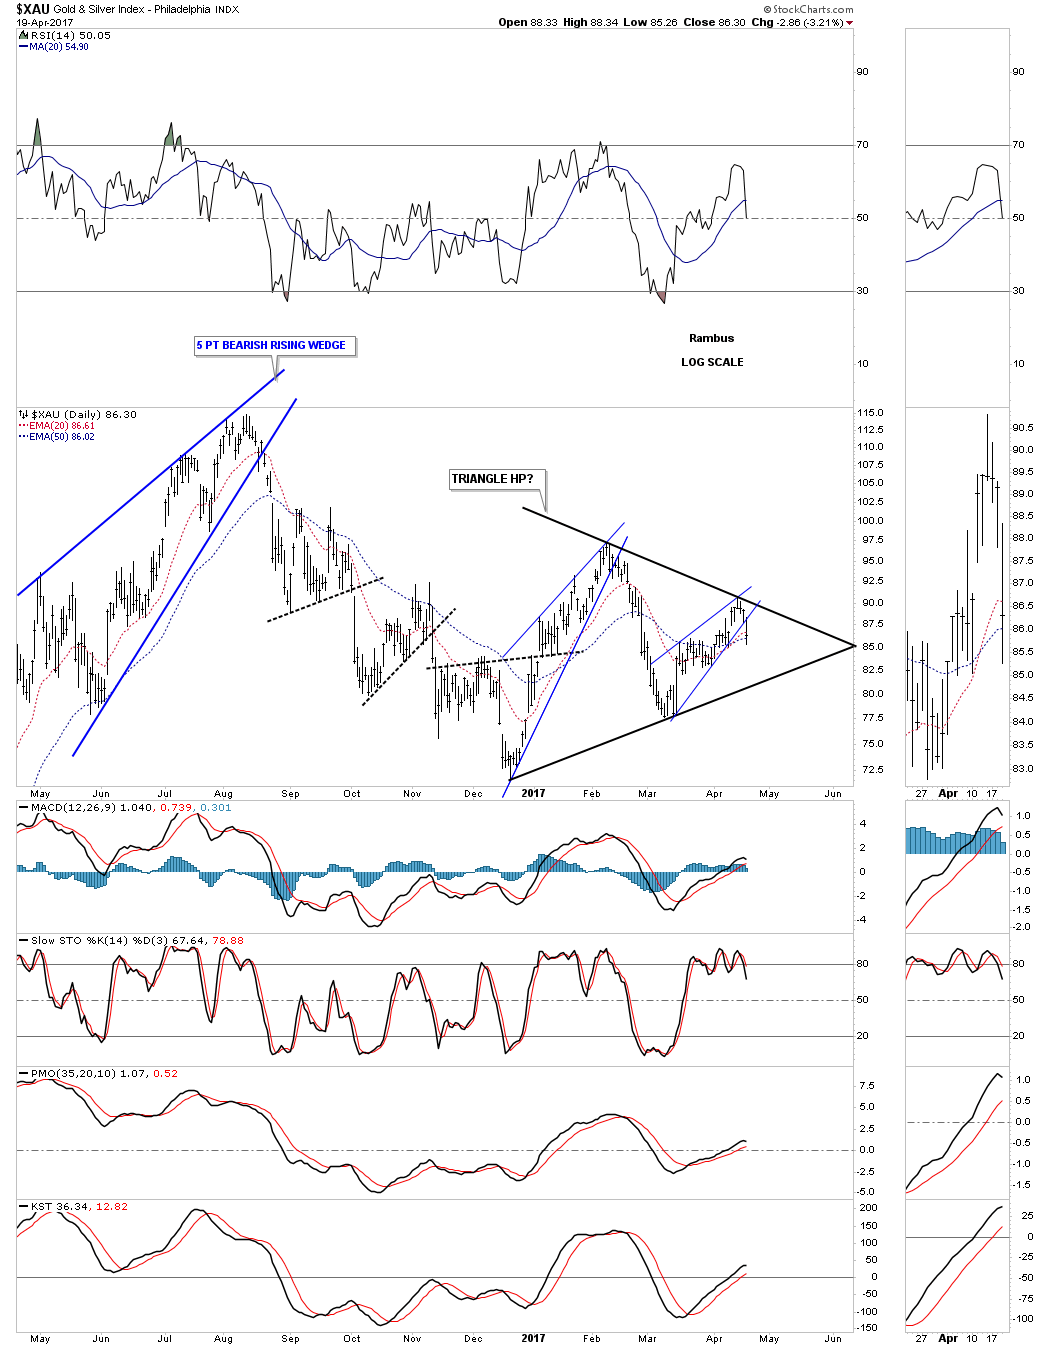
This weekly chart shows how the triangle consolidation pattern has built out just below the neckline, which has been holding resistance.
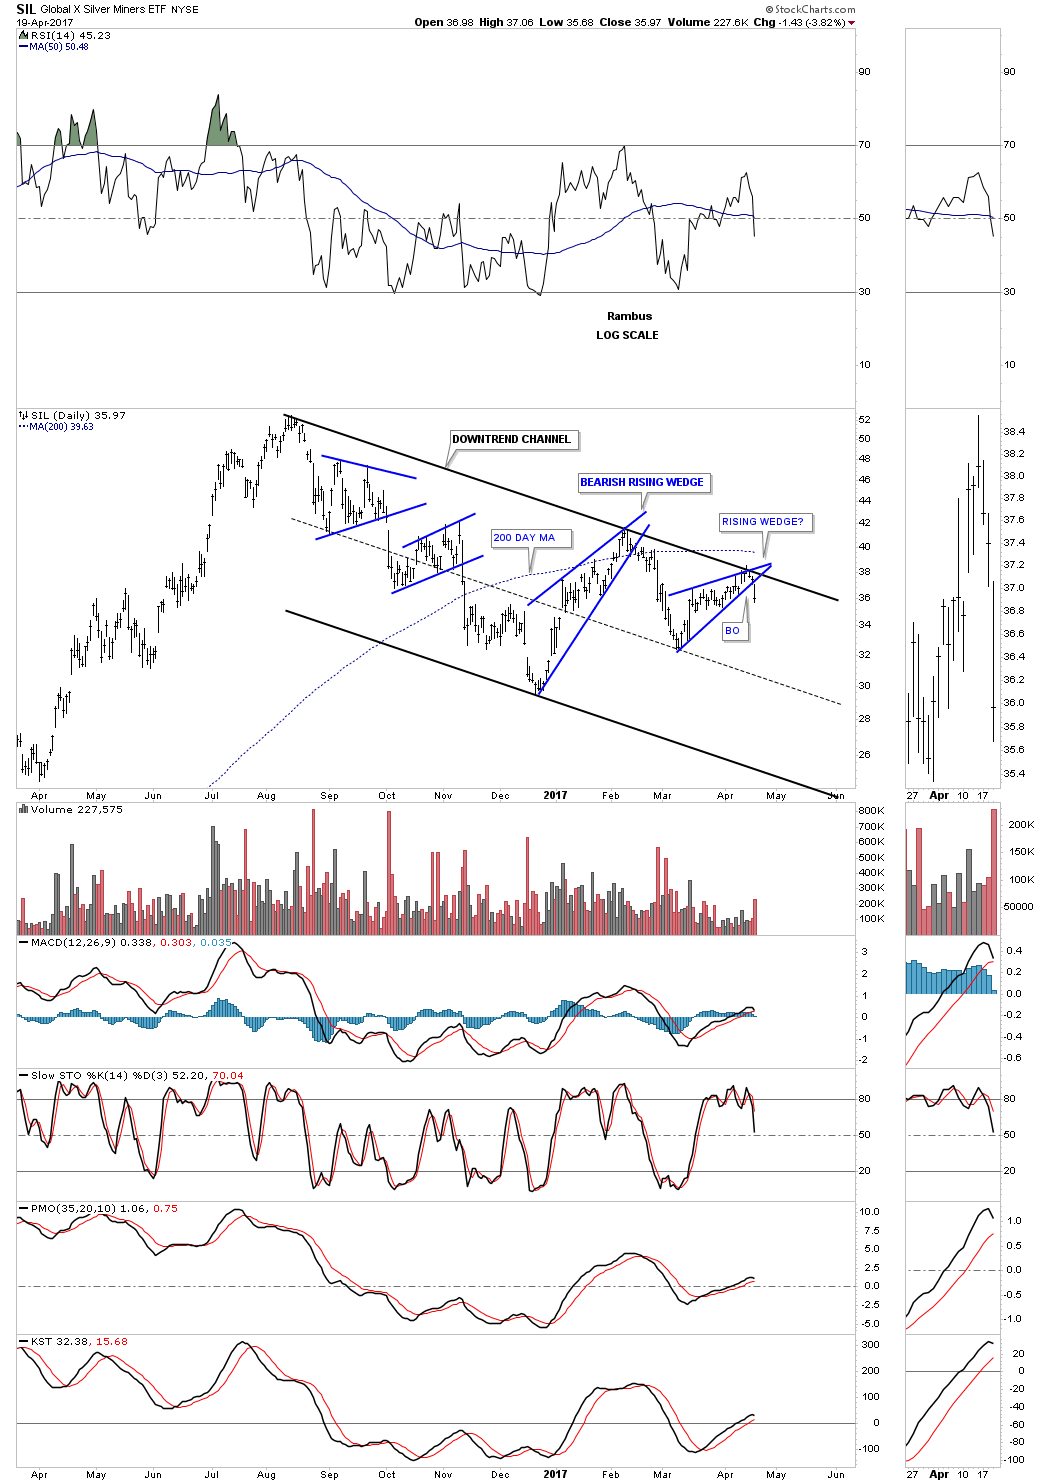
Below is the daily chart for the SIL which shows its downtrend channel firmly in place.
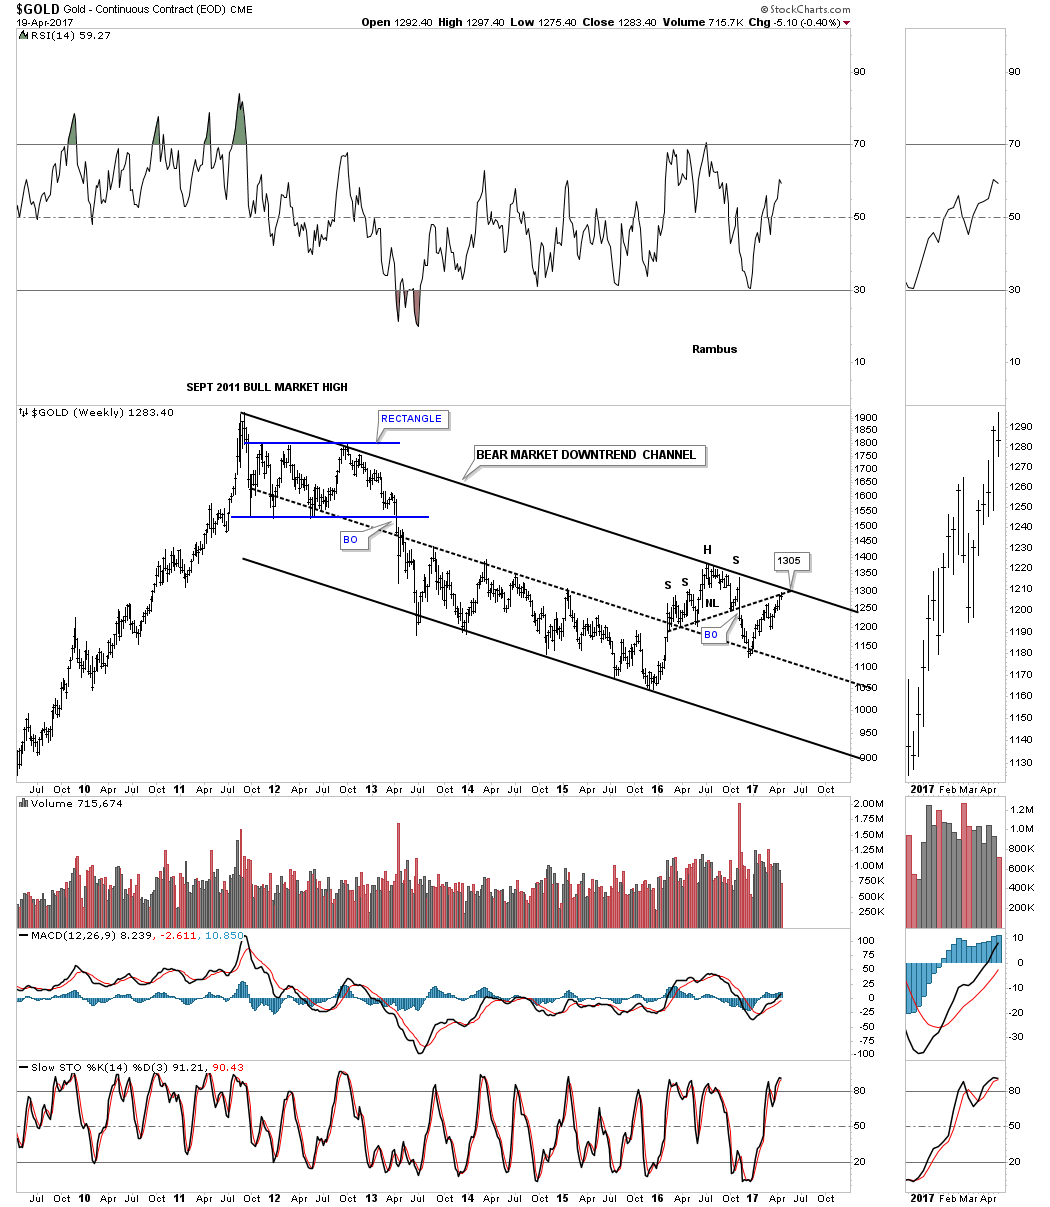
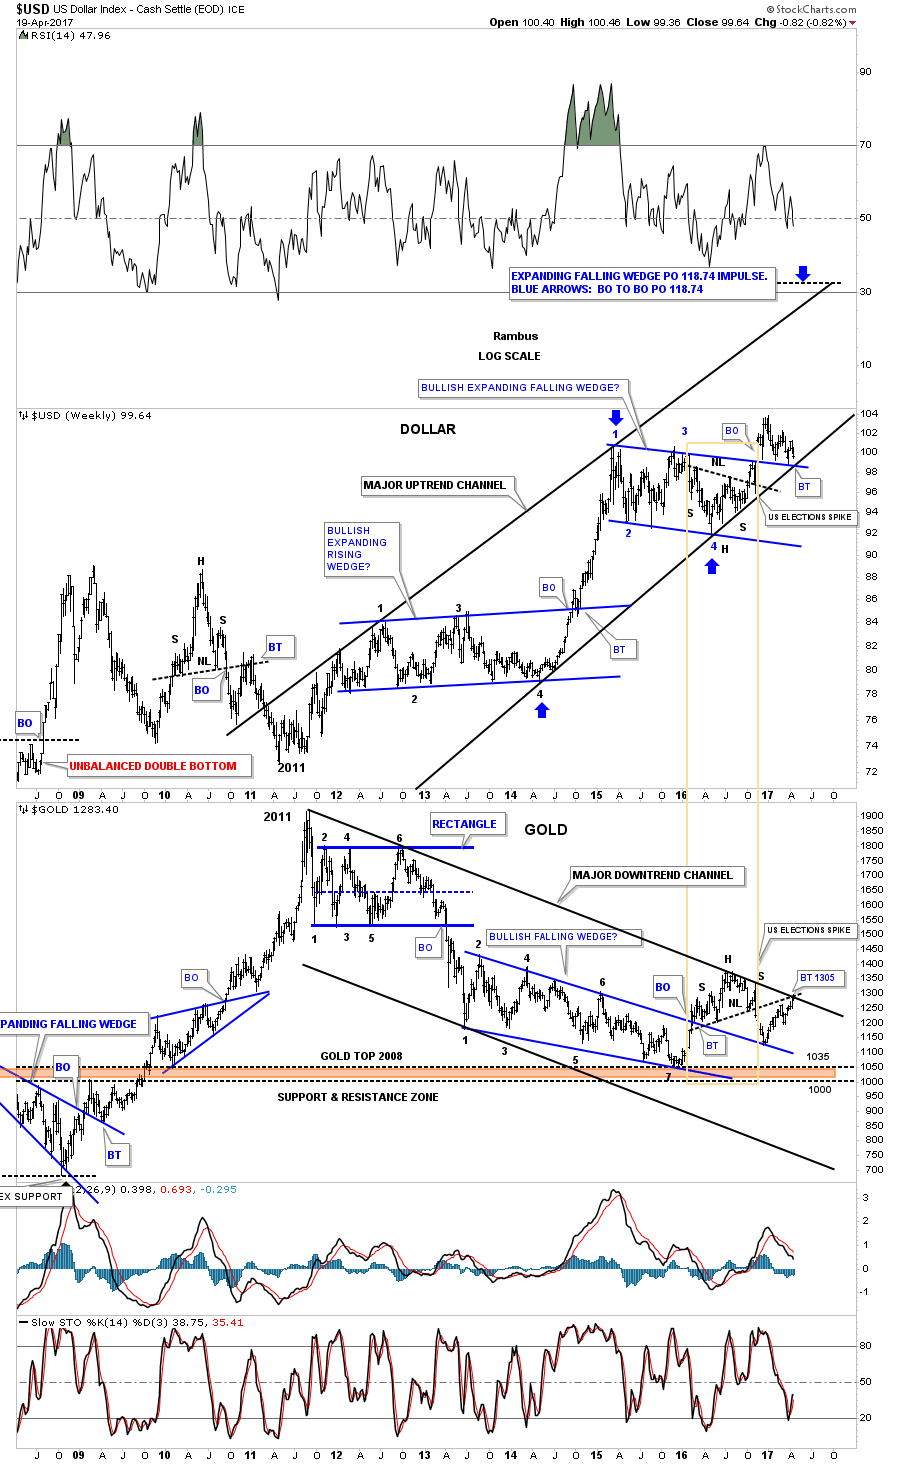
Lets change it up a bit and look at gold. If I had only one chart to use it would be this weekly chart which shows gold’s bear market downtrend channel. Since the first of the year I’ve been waiting patently for gold to rally back up to the top rail of the downtrend channel. I’ve been showing 1305 as the price objective for close to a year, which is now at hand. This is where the neckline and the top rail of the downtrend channel intersect. If gold can trade above that area then the bulls will be in charge.
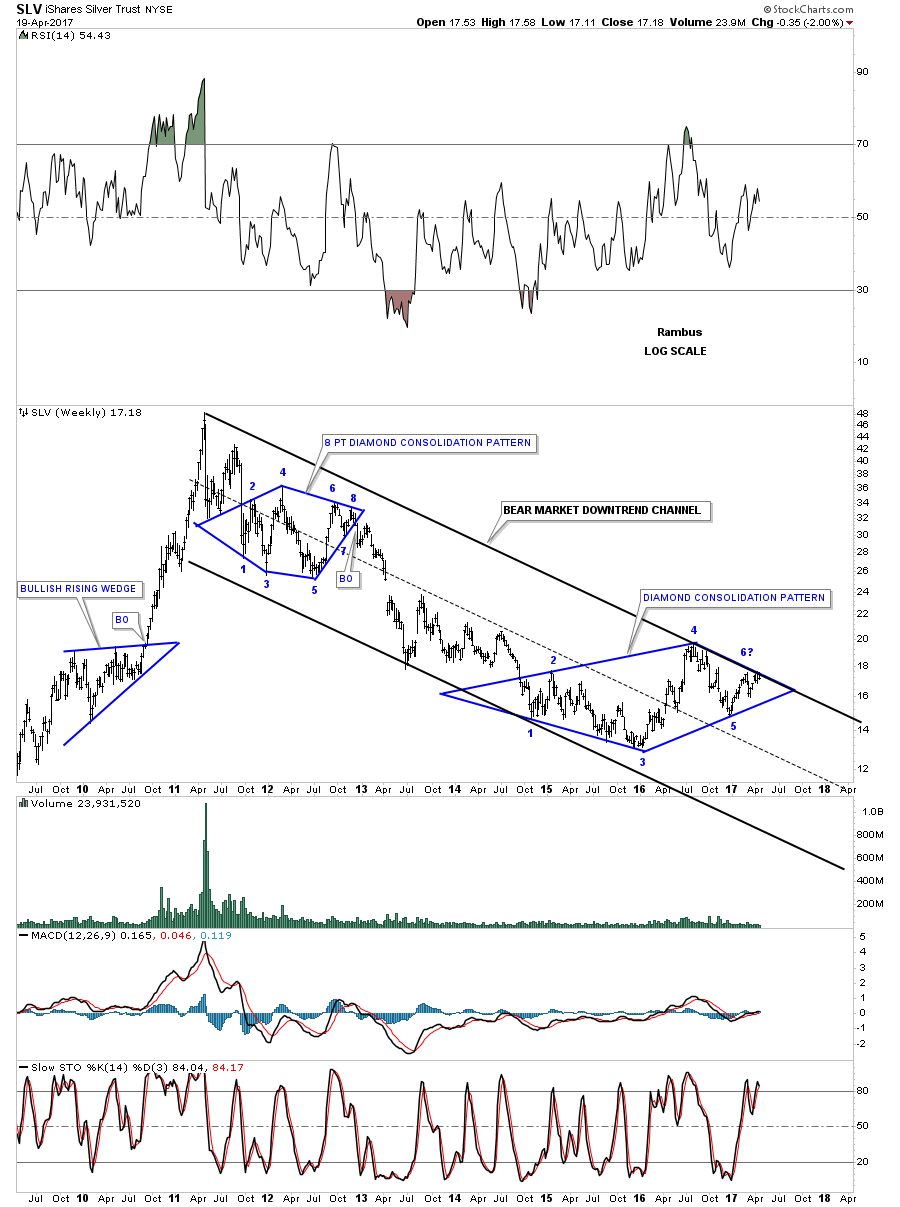
Ironically enough SLV is also testing the top rail of its bear market downtrend channel. The top rail of the downtrend channel may also be part of the 6 point diamond consolidation pattern.
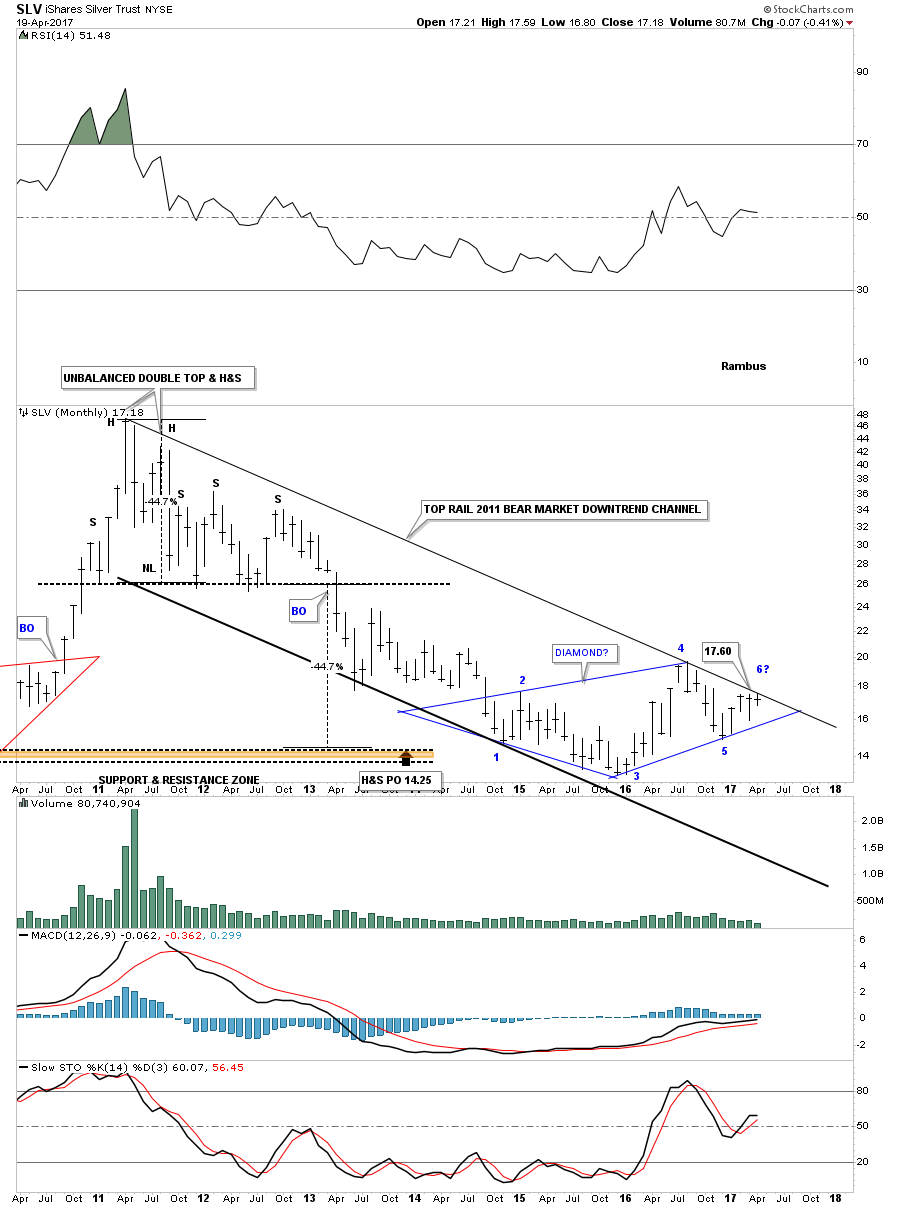
Below is a longer term weekly chart for SLV which shows the top rail of the downtrend channel holding resistance at the 6th reversal point in the blue diamond. To say this is a critical spot on this chart is an understatement.
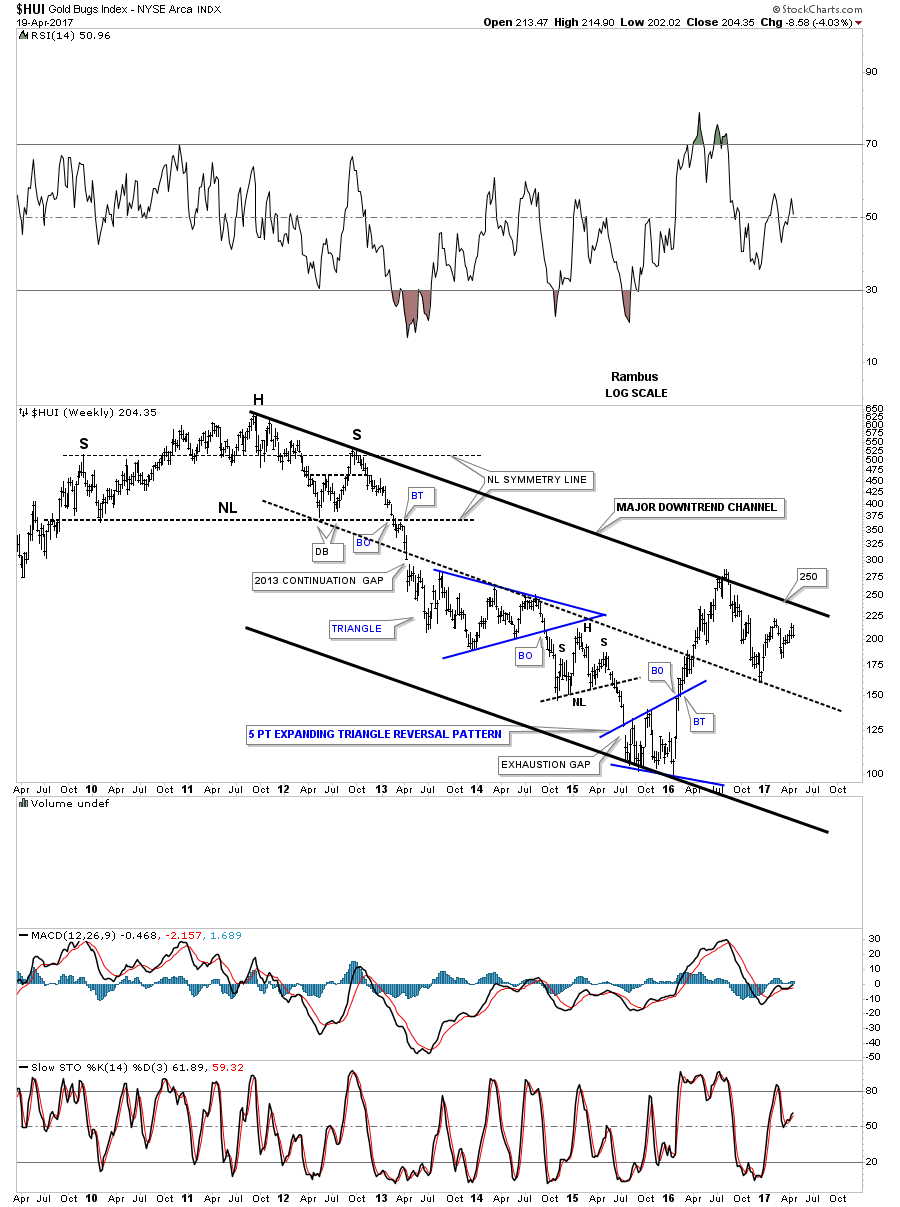
If the HUI is going to show some bullish price action the first thing it will need to do is trade above the top rail of its major bear market downtrend channel
The same can be said for the GDX.
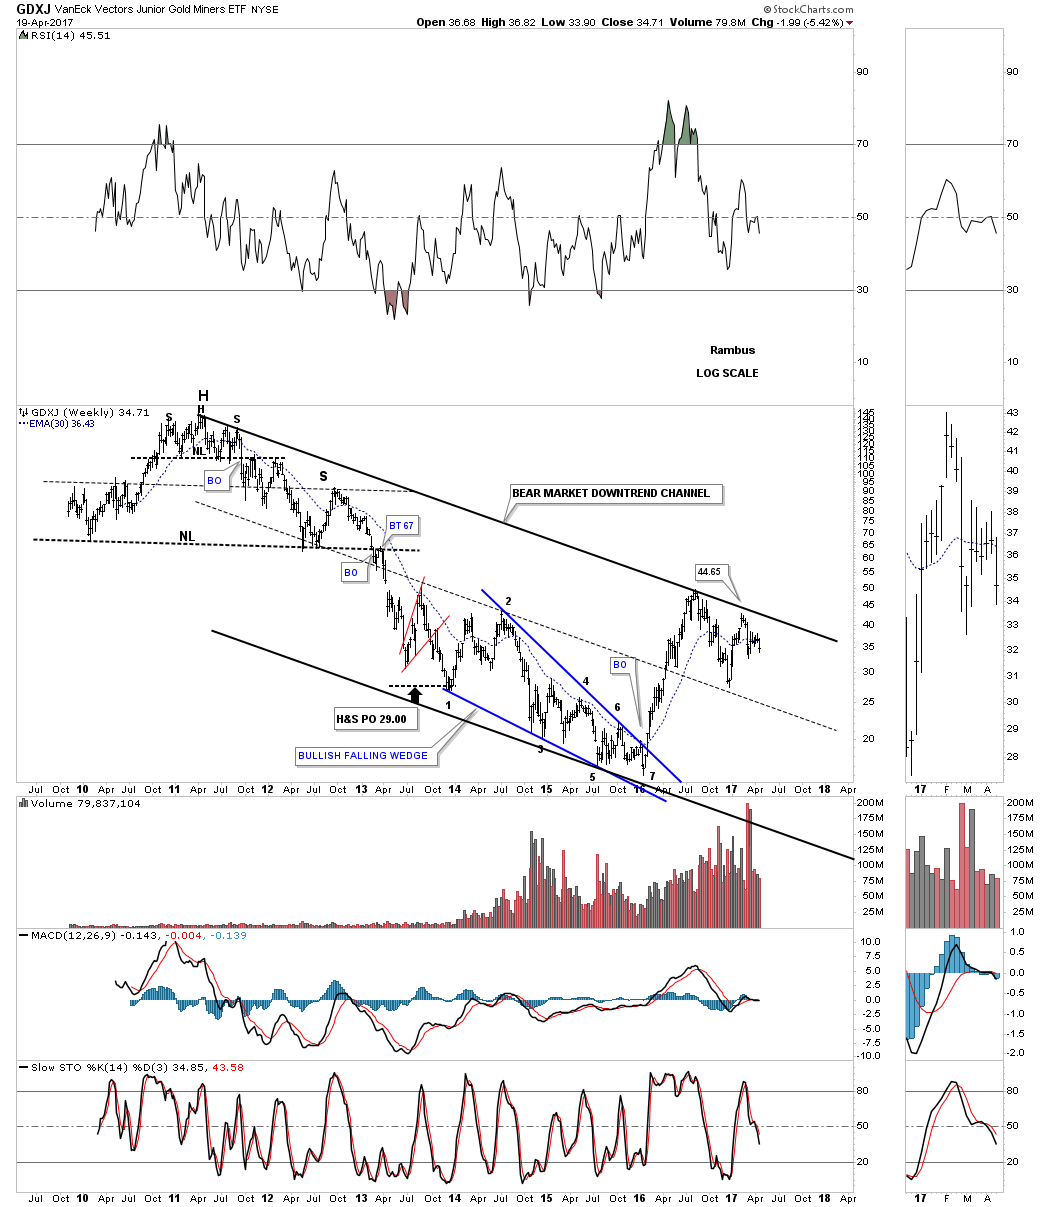
Below is the downtrend channel for the GDXJ.
This next chart is a ratio chart which compares the GDX to the SPX. When the ratio is falling GDX is under preforming the SPX. After another backtest to the neckline this week we could be seeing a potential triangle consolidation pattern building out.

Lets look at one last chart for tonight which is a weekly combo chart which has the US dollar on top and gold on the bottom. The brown rectangle shows the H&S bottom on the US dollar and the H&S top on gold. Both are at important inflection points at their respective trend channels.
The charts above show a game plan that will need to be followed. As long as the game plan continues to play out having some patience will be important. That is much easier said than done. There are usually a couple of times a year when one can get the intermediate term trend right and ride it for all its worth. Hopefully we are on the brink of such a move. All the best…Rambus
From Tulips to South Seas, from Dot Coms to Houses, all manias have something in common. Assets rise gently, largely unnoticed by the great unwashed, as the easy money is made and price rises above historical norms they become more popular by mainstream, then they become overvalued as their price rises way above “intrinsic value” and when the mania finally matures overvalued grows to extremely overvalued. And then at some point in time at some price level on the chart the market exhausts itself and collapses back to and often below it’s starting point. These collapses tend to be sudden, out of the blue and violent and usually happen without any obvious cause or reason. What was made during the boom gets lost in the bust. Only the smart money has greater odds of surviving ending manias but only if it does not get outsmarted.
 What we as Danielcode members are interested in is markets turns. As we said above manias end at some point in time and at some price. Think about that for a minute. A mania pushes up price to a certain level and at one specific point on the chart it all collapses under its own weight for no obvious reason. Whatever reason is pinpointed to the start of the crash by financial journalists is merely linking an event or piece of news that happened after the top was made. The real question on our mind is “Why is a specific price THE top and why did that top happen in that specific week or even on that specific day?” And God help us, what if we could foresee these points on the chart and have a good idea where and when they should happen. Is that even possible? The truth is that God does help us, the sad truth is that no one listens and even less are interested.
The Danielcode is a mathematical matrix of numbers straight from the book of Daniel discovered by our mentor John Needham. How these numbers are calculated is beyond my time schedule to write here but you can discover all of that in the “Live at the Springs” audio under the articles tabs at the Danielcode website. The Danielcode ratios are 29.7 , 37.5 , 44.5 , 50 , 62.5 , 59.3 , 74.2 and the powerful 89 number. And these numbers are important folks. Very important. They rule all markets in both time and price, they even rule all life and death in the universe. Or do you think it is a coincidence that the synodial month, the average length of a month, is 29.7 days or that the orbit of Saturn (referred to by the ancients as Cronus or Kronos the Roman Deity of Time) is 29.7 earth years or that the orbital velocity of Mercury is 29.7 miles per second?
Maybe. But our mentor has shown us so many charts where price has recognized so many Danielcode numbers always with precision down to a few ticks that I have completely sworn off Random Walk theory a long time ago. Nothing is random in a chart my friends. Markets are not random, they are perfectly mathematically organized, and sometimes even perfectly predictable. Let me show you what I mean.

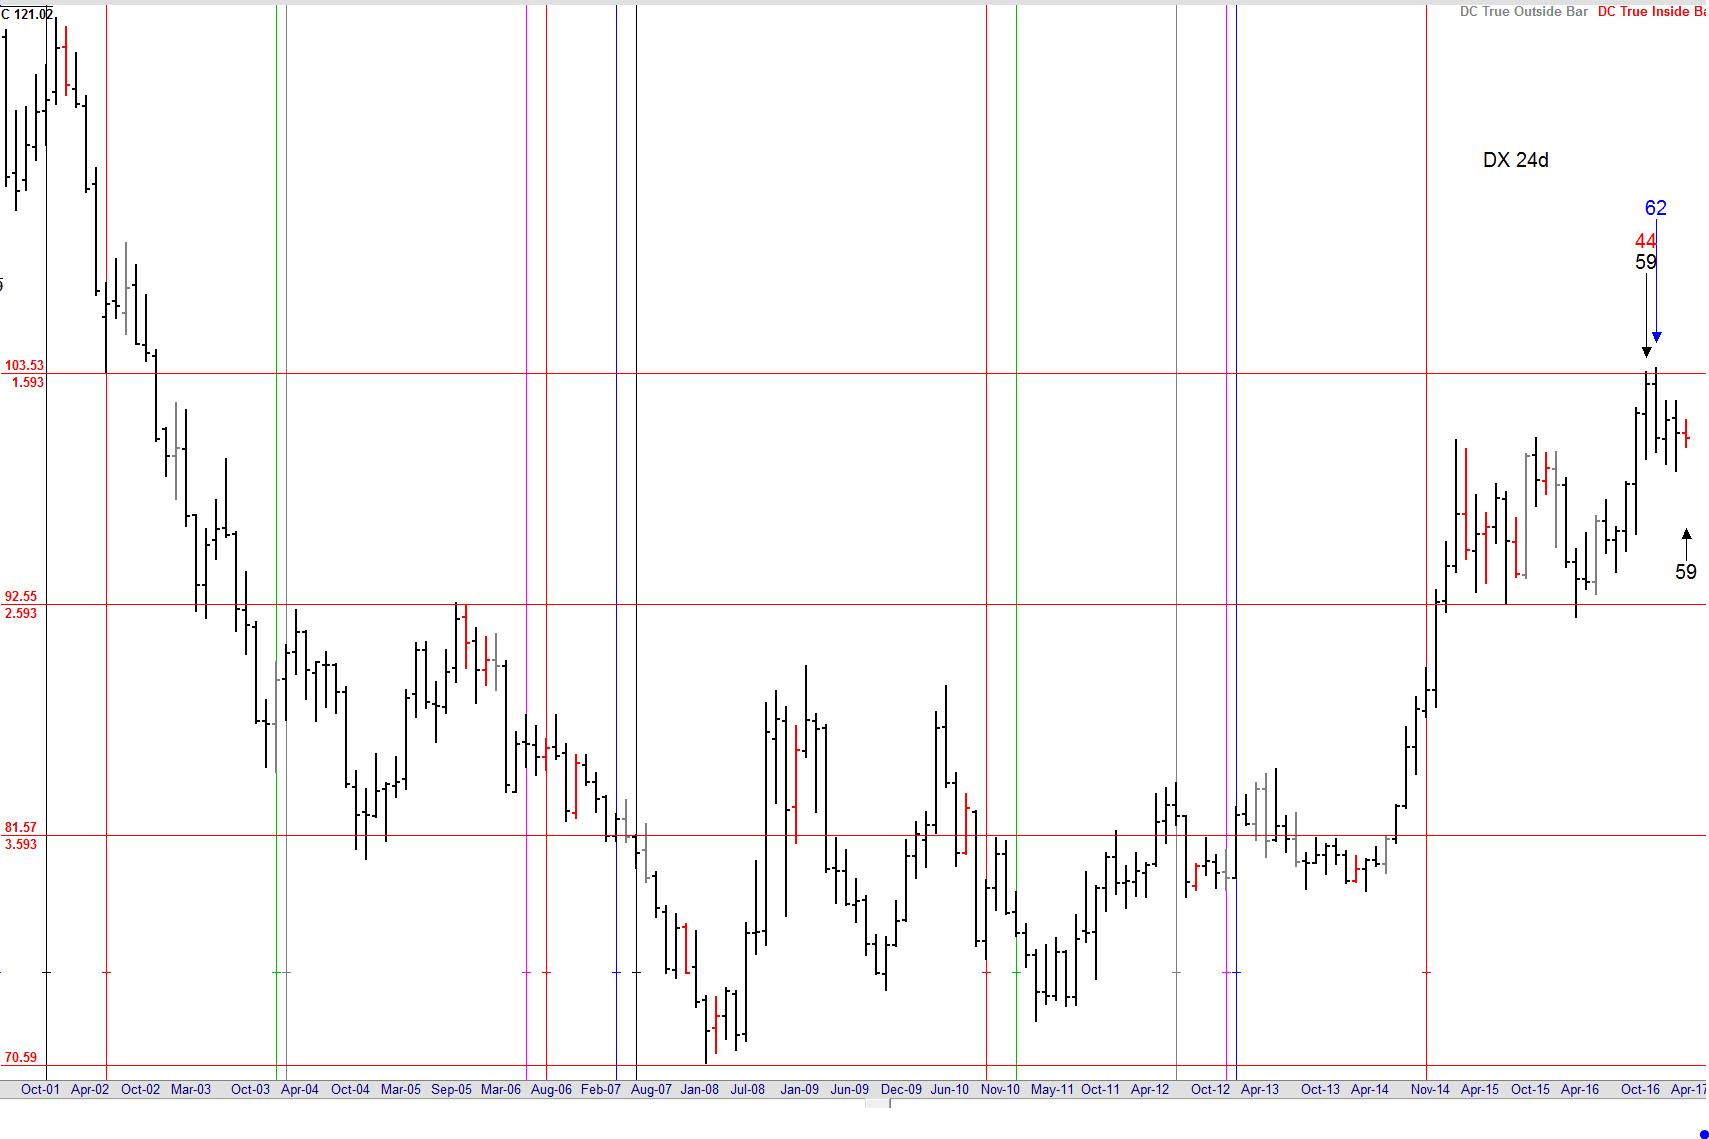
This is a 24 day chart of the US Dollar Index DX. Non-daily Danielcode charts are always composed of bars that contain 6 trading days or multiples of that (12, 24 and 48 trading days). The reason for that is beyond the scope of this article but it all comes straight from the Bible. You can read about it in the two “Master Class” articles on the Danielcode website under the articles tab. (Master Class I and II). Notice how the strong rally in DX since 2014 found it’s perfect top at 100.51 just 3 ticks shy of the 59.3% retracement from the 2008 low to the 2001 high. And how this happened on a 59 time cycle. Yes, that’s right, these numbers can also be projected on the time axis of the chart where they become time cycles instead of price levels.
If you think this is complex, let me tell you that I had never seen a trading chart before I met the Needham family in Taupo, New Zealand for a Danielcode Tutorial a few years ago. That was the first time that Mr Needham had taught The 4th Seal, and since then I have loved, lived and worked with it every day. It is indeed a marvel.
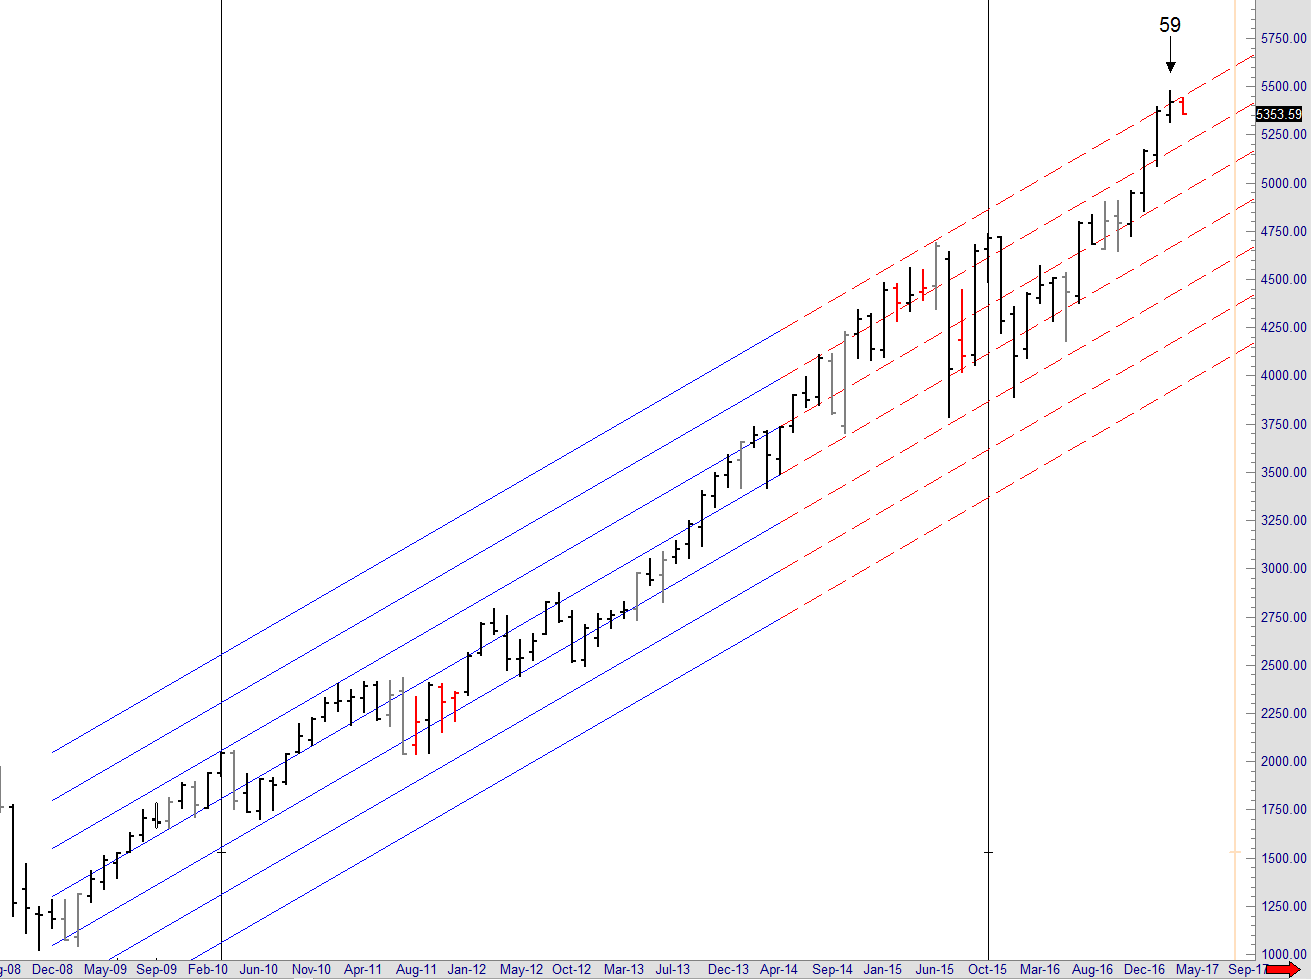
Now take a look at the next long term DX chart and how this market reacts to known Danielcode numbers in the form of price extensions. Does this seem random?
I don’t think so. The precision with which the price levels from the Danielcode sequence are recognized is stunning. Markets recognize these numbers all the time and if you draw the right DC sequence that a market is following on your chart you will see that markets lock on to these sequences for months sometimes even years in a row before switching to another DC sequence. It’s truly amazing how precisely all markets vibrate on the Danielcode sequence. And it happens all the time right before your eyes and totally unnoticed by even the biggest and smartest traders on the planet.
The current state of the market
A question many financial experts are asking themselves is: “What’s next?”. In fact it is the most important question on every mind that cares about the market. The truth is, we don’t know. Nobody does. Only our Creator has foreknowledge. But there are clues and chance favors the prepared mind. Allow me to help prepare your mind.
Here at the Danielcode we try to become experts at timing market turns and we approach this from a totally different angle. We use the numbers from the Danielcode straight from the Book of Daniel in the Bible. Sounds scary right? It’s not. In fact it’s quite a miracle.
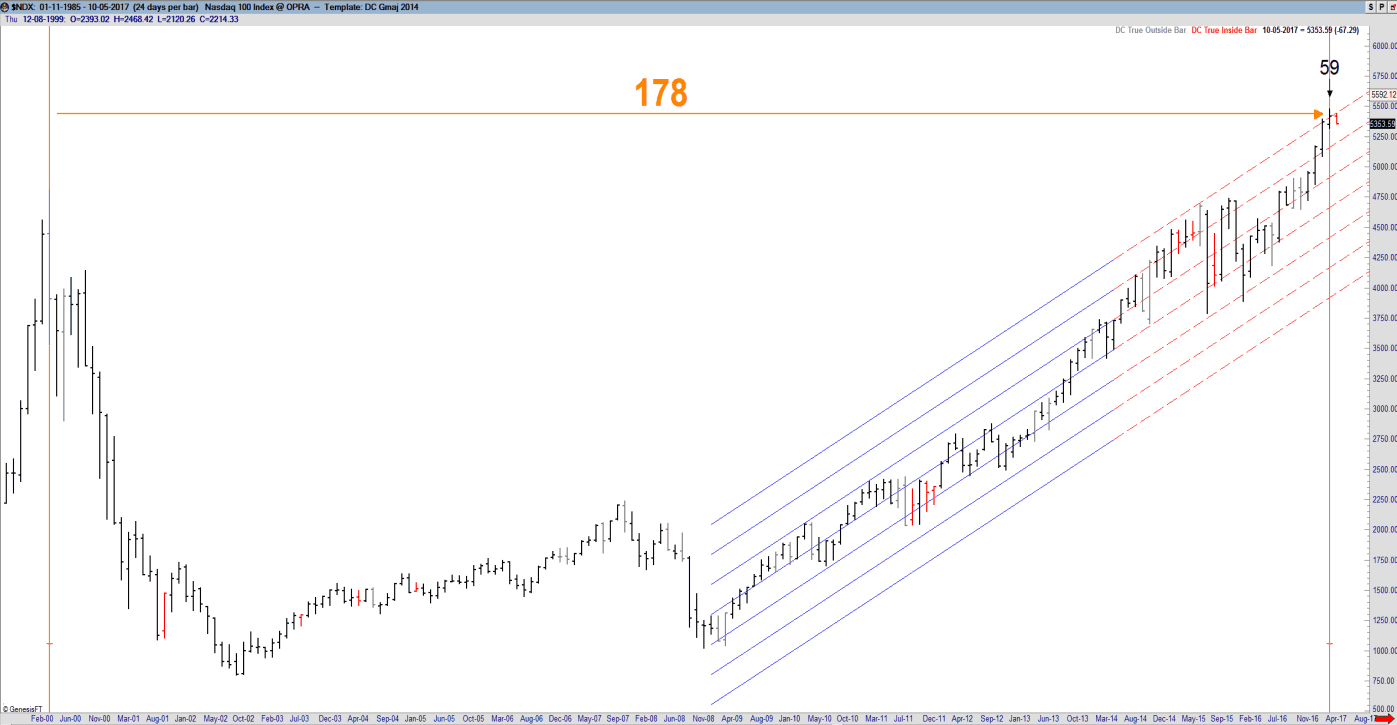
Below is a 24 day chart of the NASDAQ NDX. It has a DC regression channel drawn on it that is constructed on the important 59.3 DC ratio.
This chart shows The Death Cycle on NASDAQ. The last Death Cycle we saw was on the S&P in October 2007 and you know how that turned out!!
Notice how this market is at the 3rd standard deviation of the DC regression channel. This means that this market is 3 standard deviations away from the median of its uptrend. This in and of itself is a sign of extreme speculation and tells us NDX is on a unsustainable path. Markets rarely go beyond the 3rd standard deviation. But there is more. Both the 24 day chart and the 6 day chart have a 59 death cycle expiring early April. Death cycles are 59 topping cycles expiring from the first hub. When they bite they kill the market and turn its trend around to clear whatever excess was build up during the boom. On the 6 day chart of NDX we already broke the low of the previous bar which means this 59 death cycle is alive and kicking. Once the 24 day chart does the same odds are that this market has a serious meeting with mother nature’s laws of gravity and that my friends should get you on high alert for the potential end of this bull market and the start of a financial storm. When the Danielcode 59 death cycle bites there is no interest rate or central bank liquidity injection that can save the market. Markets turn on Danielcode ratios of time and price and when they do, nothing or nobody can change that. Markets do not turn because they are overbought or because some event happens. They turn on a specific time and price because it’s in their DNA to turn there and that DNA is ruled by the Danielcode numbers hidden in the old testament. Amazed? You should be.
The 3rd Day
Remember I just showed you how NDX was at the 3rd standard deviation of the mean? 3 is a fractal of 6 and 6 days is a DC week (“6 days you shall work and on the 7th day you shall rest”). The number 3 is important all across the Bible and since it’s Easter today let me remind you what is written in Luke 24:7
Luke 24: 7 “The Son of Man must be delivered over to the hands of sinners, be crucified and on the third day be raised again.”
Well folks, take a look at the next long term 24 day chart of NDX. The 59 time cycle comes from the 59.3 Danielcode number and that number comes from 1335/45 which is 29.666 half of 59.333. If you multiply that number by 3 you get exactly 178. Well in early April we were 178 bars away from the 2000 peak in NDX.
And that my friends should get you exited. The Danielcode is the biggest discovery in financial markets ever made. I know that is a big statement but I also know it’s true. I do not wish to impress you nor do I care whether you believe me or not. But I know that you cannot deny the charts I just showed you and I hope that is enough information to get your investigative mind stimulated so you can do some digging around on the Danielcode website yourself. There is a ton of information there just waiting to be discovered and I promise you that the believer’s mind will be blown away. And remember, markets are ruled by the Danielcode. They always have been, they always will be. Even Isaac Newton knew that there was major knowledge hidden in the book of Daniel.


-
I know Mike is a very solid investor and respect his opinions very much. So if he says pay attention to this or that - I will.
~ Dale G.
-
I've started managing my own investments so view Michael's site as a one-stop shop from which to get information and perspectives.
~ Dave E.
-
Michael offers easy reading, honest, common sense information that anyone can use in a practical manner.
~ der_al.
-
A sane voice in a scrambled investment world.
~ Ed R.
Inside Edge Pro Contributors

Greg Weldon

Josef Schachter

Tyler Bollhorn

Ryan Irvine

Paul Beattie

Martin Straith

Patrick Ceresna

Mark Leibovit

James Thorne

Victor Adair