
Energy & Commodities
The big trade of this year positions oneself for the upcoming US recession. In speculating and investing if one can get the main concept right everything else falls into place. Various trades will branch off from this theme. The trade is not priced into the market at all since we are betting against the accepted narrative. We can use various proxies to play the trade, as just about anything economically sensitive may qualify. Base metal producers, car companies, sub prime financiers, retail establishments, the list goes on. The main vehicle I have chosen to execute the trade is the oil price. I have chosen this because both fundamentals and technicals indicate to me it is over priced and due for a fall. It trades deep and has a record of falling under distressed economic conditions.
“All that we see or seem is but a dream within a dream”- Edger Allan Poe
That’s what we have lived over the past 8 years, an economic mirage. A historic FED fueled reflation rally, that was just a dream. Central banks led by Phd academics applied their unproven pet theories of substituting credit conjured from thin air in place of accumulated savings to stimulate demand. We are now going to see if their theories worked. Von Mises explained in “Human Action” that a credit-fueled boom ends in one of two ways:
“Either the banks continue the credit expansion without restriction and thus cause constantly mounting price increases and an ever growing orgy of speculation, which, as in all other cases of unlimited inflation ends in a “crack-up boom” and in a collapse of the money and credit system. Or the banks stop before this point is reached, voluntarily renounce further credit expansion and thus bring about the crisis.”
That is where we are right now, at the beginning of the credit restriction, the crisis will then follow. Its time to take the trade before its begins to be priced into the market. The oil market is rife with false understandings that should soon be exposed. Chief among them is that OPEC is in control. A belief in an OPEC put reminds me of the belief in the central bank put which existed in 2008. That dream was soon blown away. The false idea that producers will simply shut down production once they reach their all in costs is simply wrong. Sovereigns and independents have bills to pay, the costs of infrastructure can be written off.
Diego Parrilla has written a wonderful book “The energy world is flat”where he describes forces converging on the energy markets which ultimately work towards lower prices. These forces have converged to put crude oil on the defensive. Substitution, regional convergence, lower transportation costs have essentially made Oil into strictly a transportation fuel. Oil once the source of power generation is no more. Oil now competes at a disadvantage with virtually most other energy sources.
Consumers have defended themselves in various ways and geopolitics no longer add much of a premium into price with ample storage capacity and diverse supplies. Peak oil turns out was a very linear static view of the world. It ignored the dynamism of the market. These are forces that will exert a downward pressure on prices for years to come and when a faltering economy runs headlong into the largest spec long position of any commodity in history prices will drop.
Distressed producers and investors.
Reversion to the mean is a statistical certainty. The only question is what duration do we use to determine it? If one is to look at the oil price spanning the entire modern era (post WWII) the mean price, in today’s dollars, would be around $35. So its not hard to imagine a dip below the mean during a mean reversion cycle.

Capturing that move below $35 is what this trade is all about. As I said earlier what makes this the Big Trade is not the percentage move, but in getting the theme right and using that theme in your other investments.
Yesterdays Geniuses Tomorrows Suckers
People always invest the most money at the wrong part of the cycle. I believe this is what happened in the oil patch. The big asset players, the Blackstone’s, Carlyle’s, Blackrock’s and others bought at what they thought was the bottom. They believed they were the distressed buyers in 2015. Perhaps Jesse Livermore would say they are still suckers, but just suckers in a higher class. These private equity players all bought using debt and are highly levered. But I believe the game isn’t played out yet. If prices drop precipitously these guys will be selling at fire sale prices.
Mechanics of the trade.
This is a broad theme, hence the name The Big Trade. One could pick various entities to short. GM, Chrysler, Auto Nation, Carmax and subprime auto lending companies such as ALLY, NAVI, SC and CAR & HTZ would be a good place to start. Also energy companies with a large amount of debt are also prime candidates. But let’s for now focus on oil.
I have taken an initial short position using an option spread on the USO. I have also shorted outright the 3X ETF UWT. One can taylor ones risk reward by adapting different levels of leverage using options. These are trades I hold and am in no way giving specific advice to anyone else in constructing their own trade positions. We are all our own managers here.
When oil starts its downward impulse I will likely buy a direct put on one of the oil ETFs and buy DWT or SCO. But I will try to time the moment to reduce the amount of decay that one carries while holding that instrument.
Back to the Big Picture
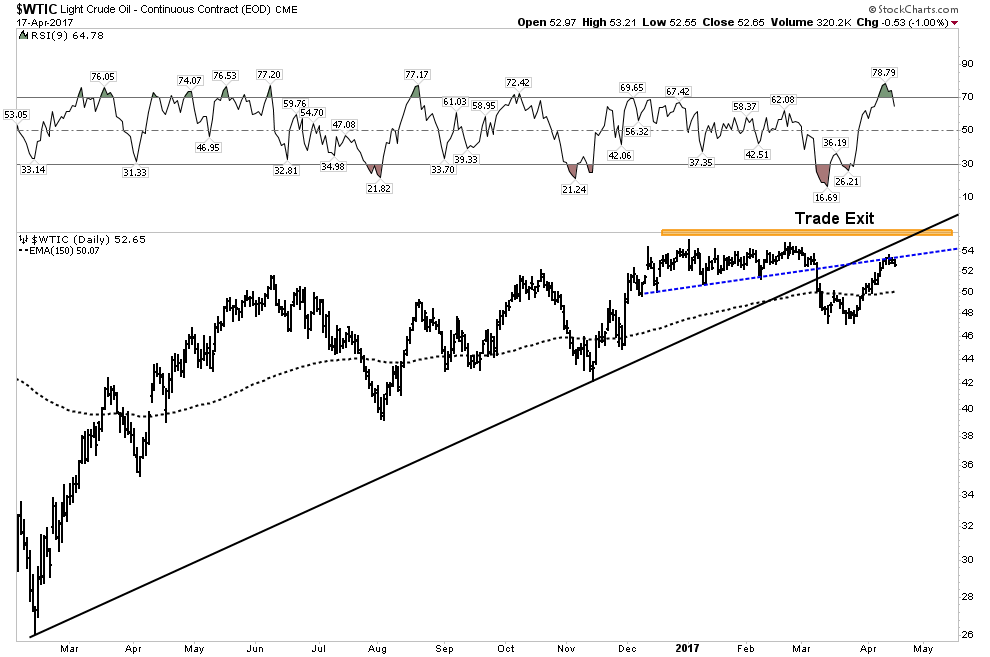
Looking again at the big picture phase chart we see below I believe we are in phase II of the secular bear market which started in 2008. I suspect it wont be over until the end of the next recession. I have no idea how low oil could go, but I presume the 2015 lows will be tested as a minimum.
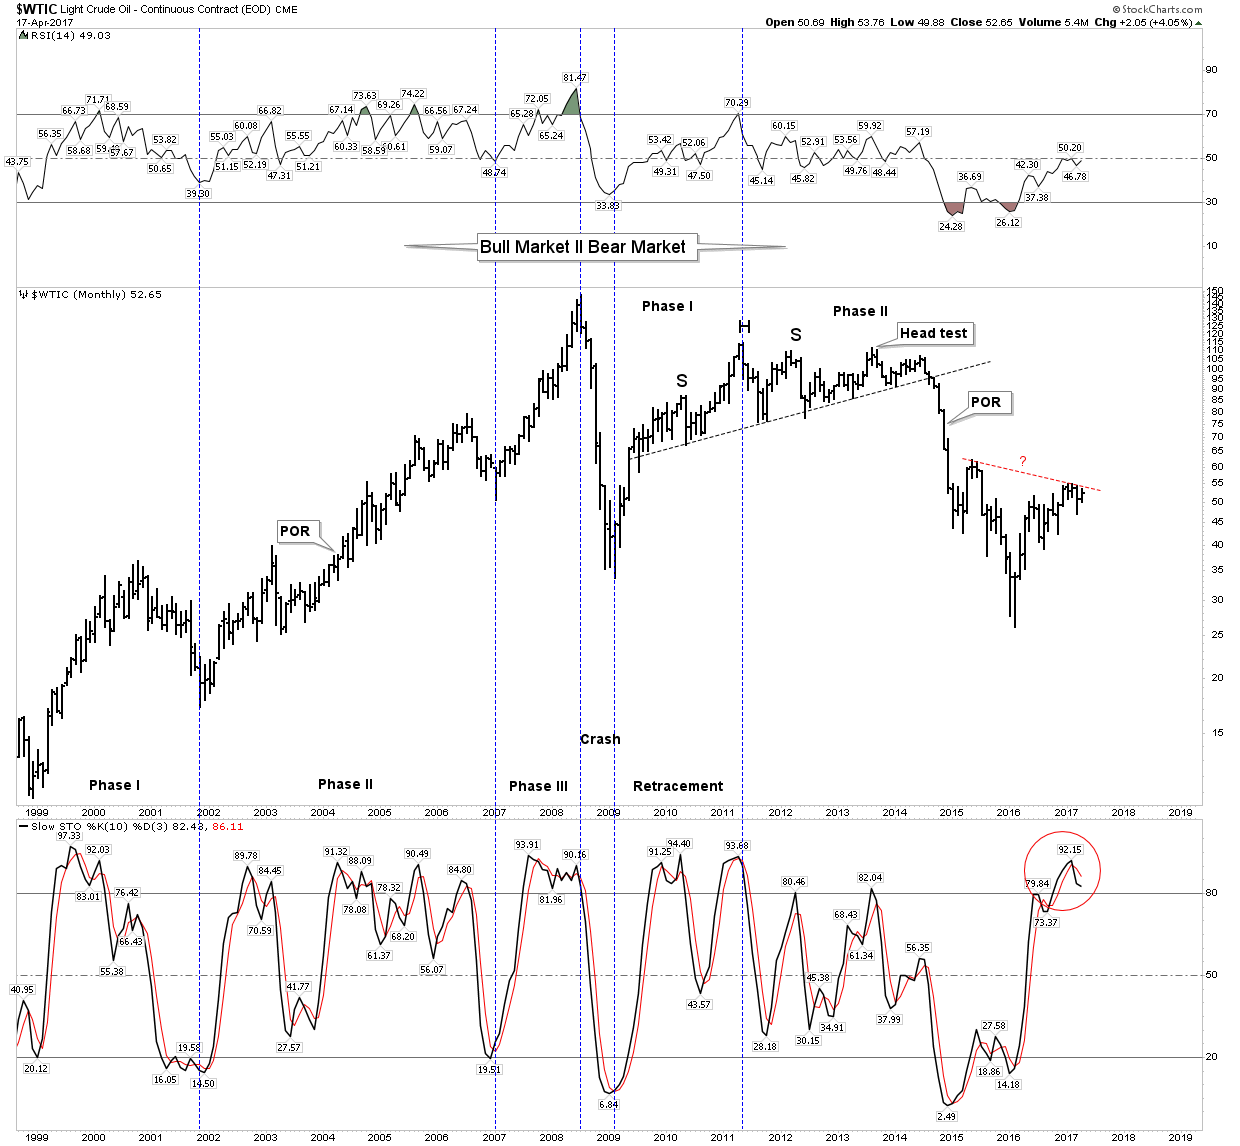
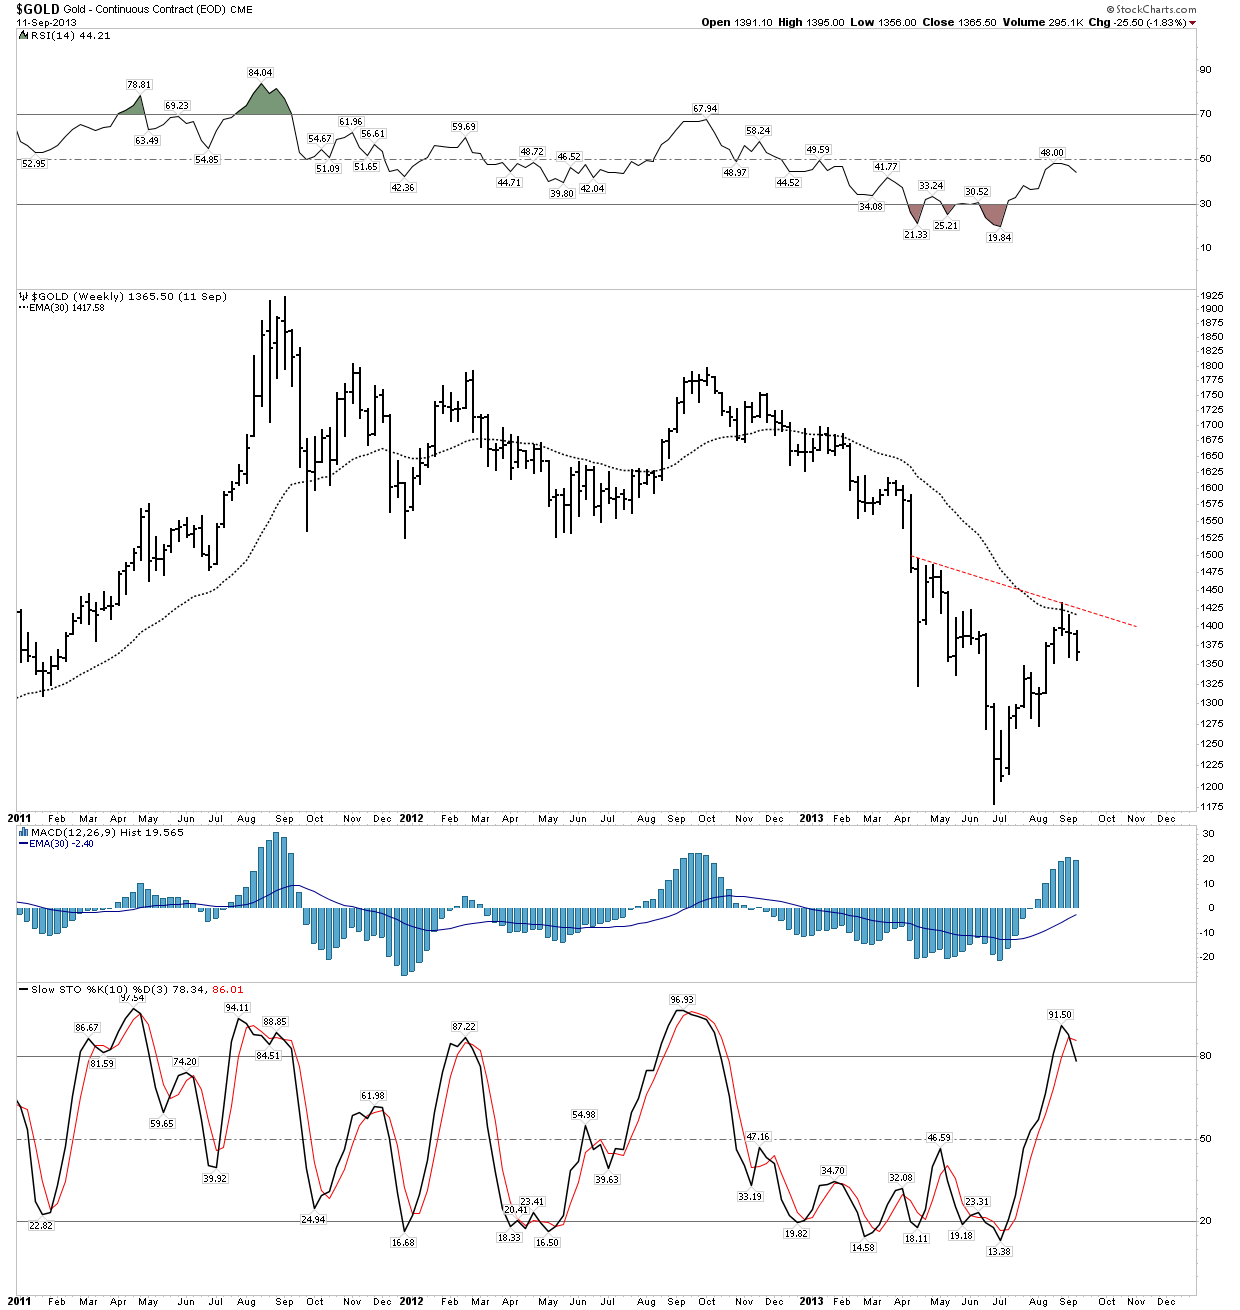
We all know that gold’s price just kept on going down and the H&S was never was valid. I suspect the same thing will play out with oil.
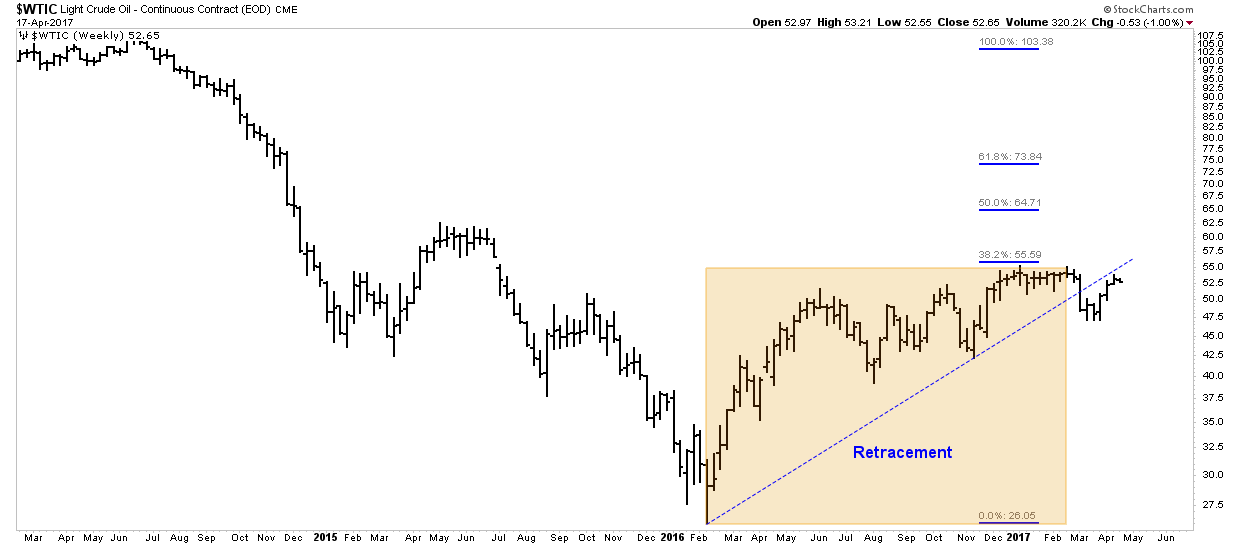
Another Retracement in an ongoing bear market
What we have witnessed over the past year in the oil market is likely just another retracement of the decline from $114. Oil got bombed out at the bottom just like gold did in 2015. All the sellers had left, it could only bounce up. Mr. Bear needed a recharge so he put on a cyclical bull to draw in the usual suspects… the oil bugs, close cousins to the gold bugs.
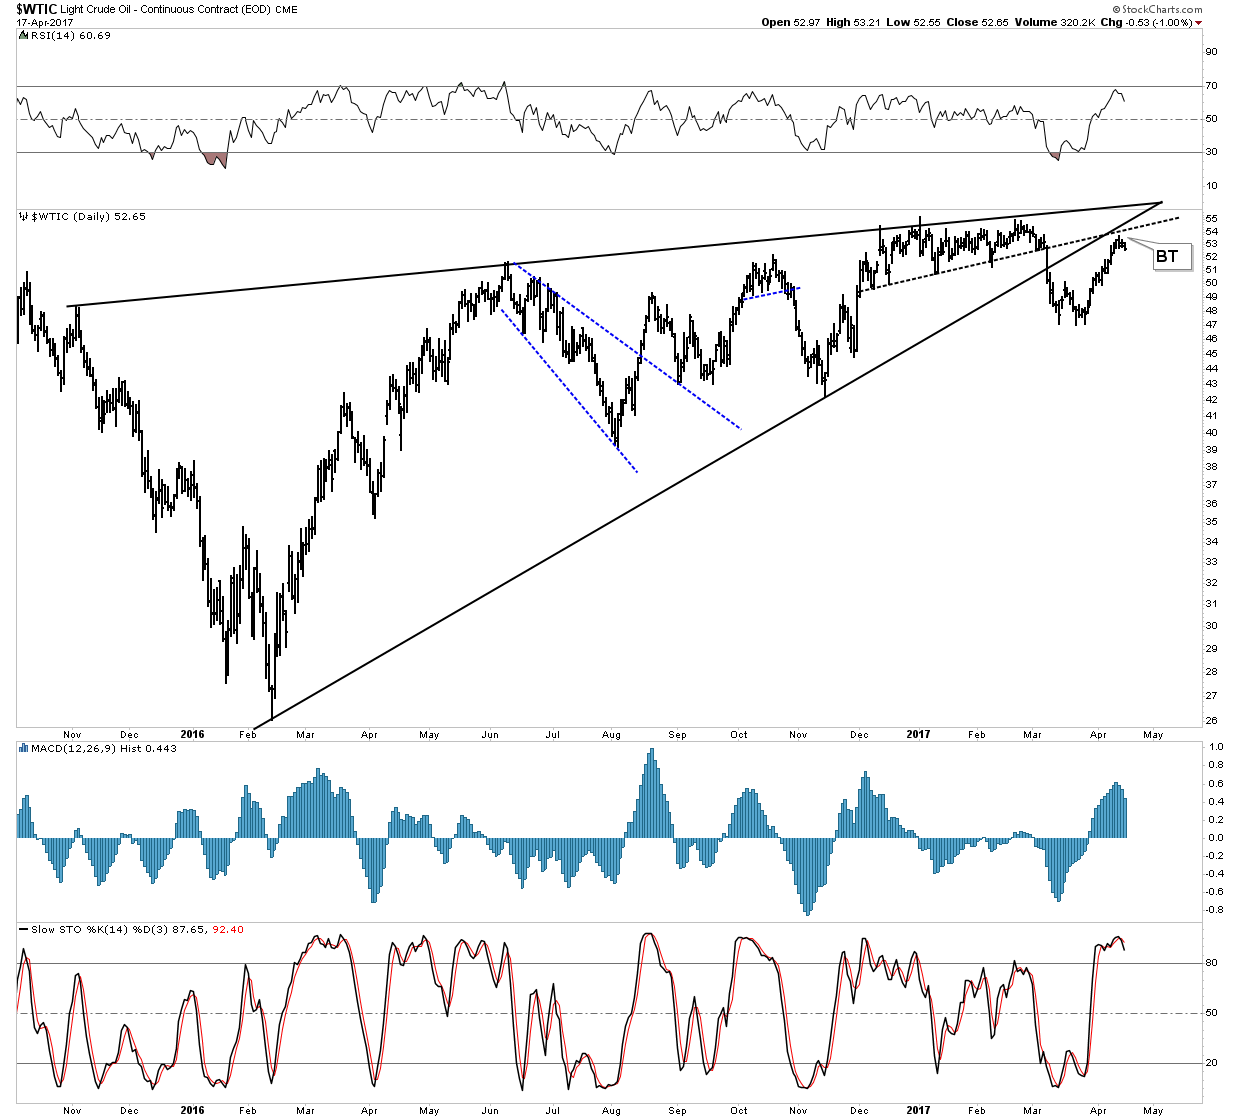
But according to chartology the bounce took the form of a giant bearish rising wedge which lasted about one year and recently broke down out of the wedge. It is now in an aggressive backtest which offers a low risk short entry.
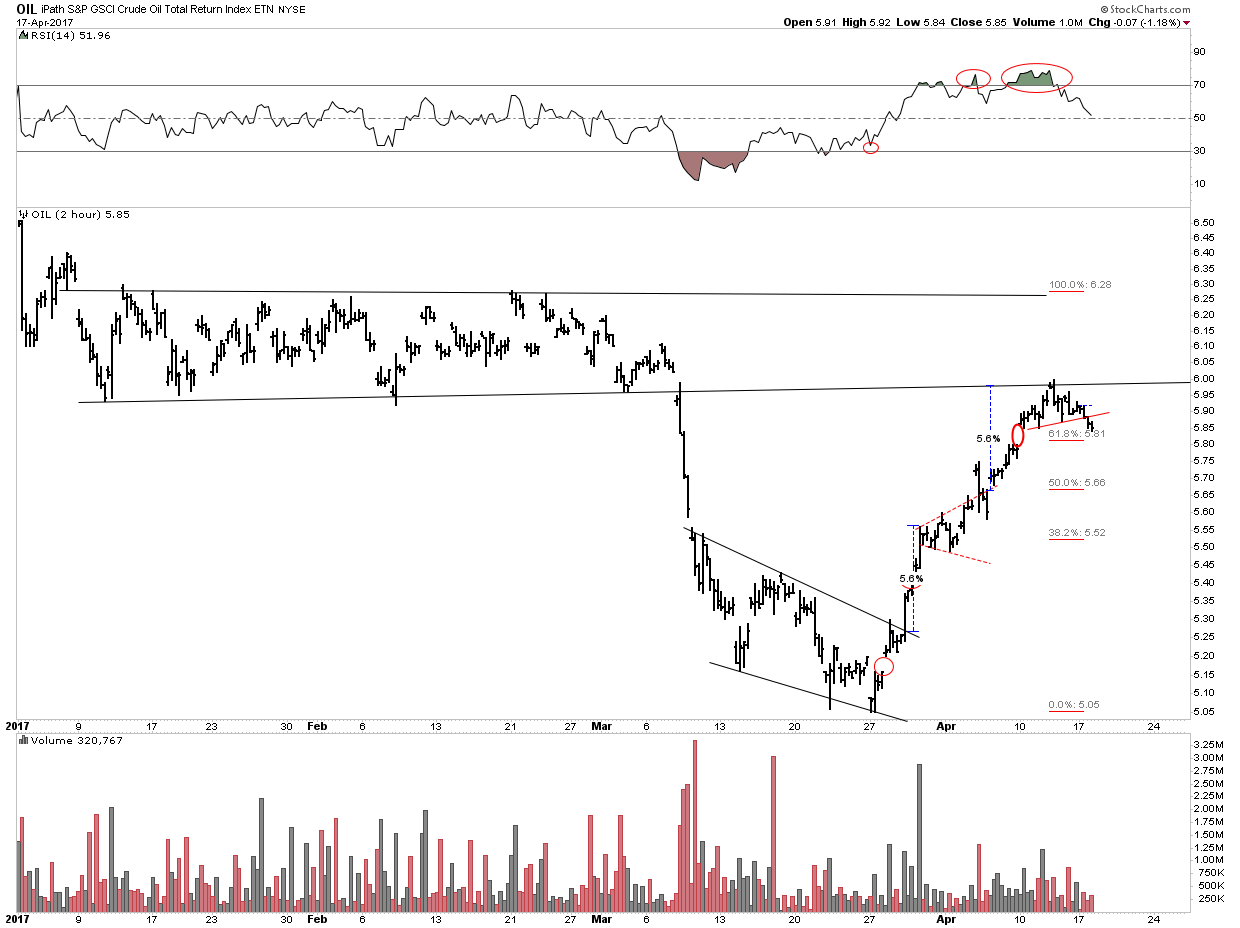
Here is a close-up 2-hour duration chart depicting OIL ETF in its recent retracement after falling out of its massive one year retracement wedge. IMO this recent bounce over the past 3 weeks was fueled by initial bearish psychology. Several newsletter writers advised their flocks to short oil using leveraged vehicles after the initial breakdown had occurred. I am on record of entering my short, using UWT right at the initial break. I closed out the trade after the second bounce on March 23rd. The aggressive bounce starting on March 27th I view as a short squeeze jacking all the Johnny come lately’s. That’s how initial breakdowns often develop, Mr Market needs to squeeze out the shorts and retest the original breakdown level.
The run up to resistance since Mar 27 has several interesting features. Note the three running gaps in the chart. These are caused by urgency and cry out to be filled. Also price was projected precisely to the point of overhead resistance by the blue breakout to breakout 5.6% measurements. Finally, I found it interesting that price retraced just above FIB 61.8%. If you go back to Part I and look at the chart labeled the great retracement you will see the oil price retracement from 2009 to 2011 retraced exactly the same amount, just above the 61.8% level. All of these points lend credence that the bounce may now be over and its time to enter short.
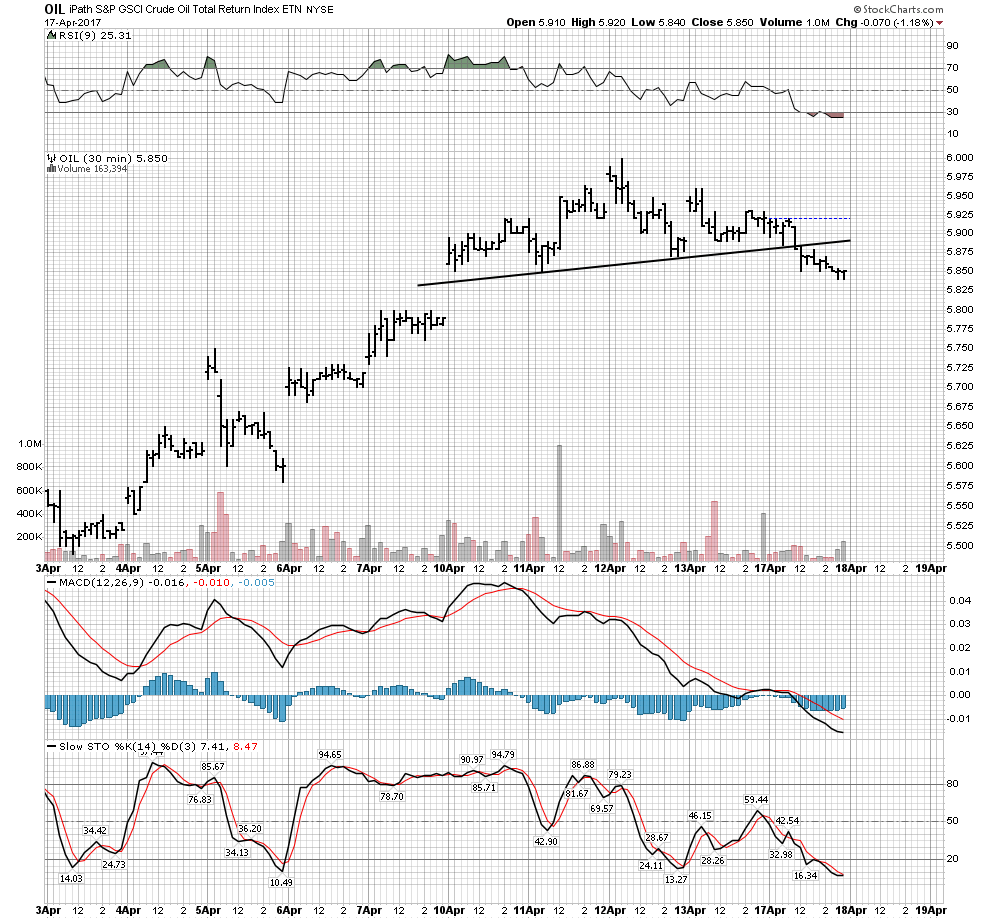
Here is todays action. There is a chance we have a top with the break of the short term NL.
Risk Factors
It’s easy to be wrong so I have controlled risk of potential loss by buying call options at higher strike prices. Waking up tomorrow to find the Iranians have blocked the straits of Hormuz would be painful, but not a wipeout. However I consider this a low risk entry because if prices close above the February highs I close out the trade. That’s only $3 per bbl of risk above today’s price. That’s limited exposure, despite leverage. Above that point we reevaluate our investing premise and if its still valid we wait for the next entry set-up.
Normally I don’t short when above a rising 30 W EMA, however I see this as a unique set-up with defined risk exit points. When weekly stochastics turn down and the 30 W EMA tilts down it would be appropriate to add to the short position. Until then its a starter entry. The plan is to ladder into the trade as the technicals improve and we increase the probability of success.
By shorting UWT and selling in the money Jan18 USO calls it aligns the decay of these vehicles in favor of the trade. This also skews the risk reward favorably.
So that’s the Big Trade. My objective is to earn 50-60% on my capital deployed over a period of 10 months. If the oil price drops to $30-35 this should be achieved. What makes the trade big is not the rate of return but the economic implications. Again, get the main theme right and other things fall into place. Other trades will be related to this central theme.
Trade aggressively but protect your capital.

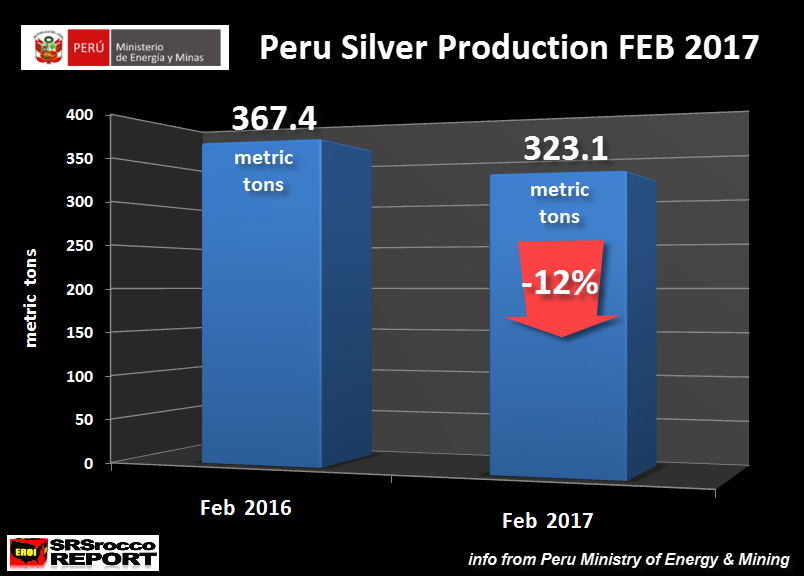
The Peru Ministry of Energy and Mining just released their silver production data for February, and it was a whopper to the downside. Actually, I was quite surprised to see how much Peru’s silver production declined versus the same month last year. Also, Peru’s gold February production took a similar big hit.
According to the Peru Ministry of Energy and Mining data, the country’s silver production fell 12% to 323.1 metric tons (mt) this February versus 367.4 mt the same month last year:
This is a 44 mt decline in one month, nearly 1.5 million oz lost. Here is the table from the Peru Ministry of Energy and Mining showing various metals production data for February:

Silver is shown as “PLATA” and as we see, overall silver production for JAN-FEB has declined 6.7% compared to the same period last year. Which means, Peru’s silver production took a much larger hit in February than in January. Furthermore, Peru’s gold production (shown as “ORO”), also declined significantly by falling 11.3% in February.
The Peru Ministry of Energy and Mining put out this brief explanation why their silver and gold production declined in February:
However, in this month precious metals slightly suffered a lower production volume gold decreased by -11.91%, while silver -11.29%. In the accumulated January, national production of these precious metals decreased by 6.81% for gold and 6.3% for silver.
In the national production of silver, the Lima region (127,157 kg fine), Ancash (126,816 kg fine) and Junín (116,473 kg fine) regions are in the top positions, associated with the polymetallic exploitation of the center of the country. Peru is the second largest silver producer in the world and boasts the largest proven and probable reserves of this precious metal in the world.
Antamina (101,824 kg Fine) in the Ancash region, followed by Uchucchacua (84,745 Kg. Finos) in Lima and Inmaculada (30,468 Kg Finos) in Ayacucho, among several others.
In the case of gold, the national production accumulated to February 2017, reached 23.8 tons fine. Its production was concentrated in the regions of La Libertad (6.4 tons) contributing the total production in 26.92%; Cajamarca cooperating with 23.32% (5.5 tons fine) and Arequipa (3.03 tons fine) contributing 12.74%. These regions accumulate 63% of the national gold production.
The decrease is explained by the lower results (-23.53%) of the main producer: Minera Yanacocha S.R.L. Whose operations in Cajamarca have been affected by an exhaustion of the reserves in the current deposits in operation.
I don’t know why the Peru Ministry of Energy and Mining’s data for gold and silver production declines are different in their explanation than what they show in the excel spreadsheets. However, it is only off by a small percentage. Regardless, the important part of the text above is highlighted in RED. The reason for the big decline of Peru’s gold production was due to “an exhaustion of reserves in the current deposits of operation.” This is a KEY FACTOR that will be played-out across the world as other mines lose production due to the same situation of reserve exhaustion.
We must remember, Peru is the second largest silver producer in the world, right behind Mexico. According to the Silver Institute’s 2016 Interim Report, Mexico’s silver production is estimated to decline to 183 Moz in 2016 (189 Moz in 2015), while Peru’s silver production increased to 141 Moz (136 Moz in 2015).
Global Future Silver Production At Risk
As the global markets finally succumb to the massive amount of debt, economic activity is going to plummet. This will have a negative impact on most energy, metals and commodity prices. Thus, production of base metals will decline significantly. This will impact the production of silver the most at the majority comes as a by-product of zinc, lead and copper production.
According to the World Silver Survey, 34% of silver production came as a by-product of zinc and lead, while 22% came as a by-product of copper production. Thus, 56% of global silver production is a result of copper, zinc and lead production:

Which means, more than half of the world’s future silver production is at risk when base metals prices take a big hit during the next economic crash. People need to realize that using a massive amount of leveraged debt to continue economic activity is not only UNWISE, it is seriously INSANE.
While there is no guarantee what the value of gold and silver will be in the future, LOGIC suggests investors holding onto most STOCKS, BONDS and REAL ESTATE will suffer the financial enema of their life. Again, this is all due to the disintegrating U.S. and global oil industry in the future.
So, PLACE YA BETS and let’s see who made the better investment decision when the global market finally cracks.
….also from the SRSrocco Report:
CONSPIRACY vs FACT: How Much Gold Is In The World??

 Summary
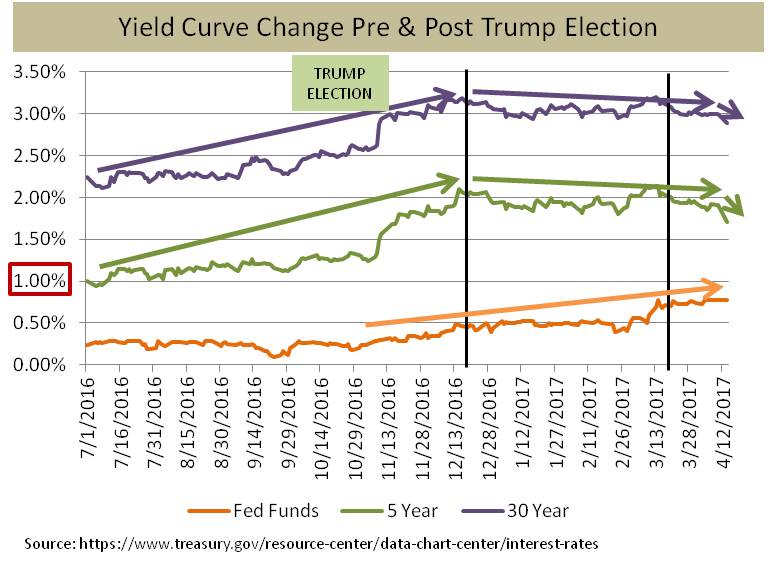
Trump’s election is a potential game changer for the Keynesian fiscal policy status quo in Washington.
Interest rates spiked higher across the board in late 2016 in anticipation of potential major fiscal policy changes.
Since early March 2017, however, the yield curve has flattened, sometimes an indicator of a looming recession.
In 1949, under similar monetary and fiscal policy market dynamics, the US economy experienced a recession and US stocks fell over 20% in a 12-month time frame.
This article compares and contrasts the current financial market to that faced by Harry Truman in 1949 when the Fed was also raising rates off the zero lower bound.

 Afghanistan, Iraq, Syria, Iran, North Korea, Russia, China ……..
In the 1960s Peter, Paul and Mary popularized a song written by Pete Seeger – “Where Have All the Flowers Gone?”
The short version is:
Where have all the flowers gone?
Young girls have picked them.
Where have all the young girls gone?
Gone to husbands.
Where have all the husbands gone?
Gone for soldiers.
Where have all the soldiers gone?
Gone to graveyards.
Where have all the graveyards gone?
Gone to flowers.
And repeat.
When will they ever learn?
Another version of this “cycle of life” is:
Where has all the money gone?
Gone to taxes.
Where have all the taxes gone?
Gone to governments.
Where have all the governments gone?
Gone to bankers for more money.
Where have all the bankers gone?
Gone to buy politicians.
Where have all the politicians gone?
Gone to buy voters.
Where have all the voters gone?
Gone to work for money.
Where has all the money gone?
Gone to taxes.
And repeat.
When will we learn?
Fifty years ago we were bombing North Vietnam “back into the stone age.” That worked out well for the military contractors, killed many, and raised prices for the US people.
Twenty-five years ago we were fighting Iraq and Saddam Hussein. That worked out well for the military contractors, killed many, and raised prices for the US people.
Ten years ago we were fighting in Iraq. That worked out well for the military contractors, killed many, and raised prices for the US people.
Today we are still fighting in the Middle-East and bombing Syria. A taskforce of ships is threatening North Korea. Who benefits?
When will we learn?
Looking ahead:
- War: Not to win, never to end.
- Debt and currency in circulation are rising exponentially.
- Consumer prices will increase… and increase.
- Gold, silver, gasoline and food will become more expensive.
- Voters will continue voting for politicians and wars even though both are expensive and destructive.
- The political and financial elite will be fine. Tough luck for rest of us…
When will we learn?
Gary Christenson
The Deviant Investor
Thursday’s, April 13th, 2017, trading displayed some evidence of “exhaustive selling”. It is still trading well above its 200- simple moving day average. The BULLISH RALLY has not stopped.
In identical occurrences, based on historical data, the one-month returns, during which the SPX rallied 15 out of 16 times with a greater than 5-to-1 reward-to-risk ratio. “Emotional selloffs” occur in strong uptrends which have only presented themselves with greater buying opportunities. This is the predominate case we are facing during this month of April.
Wave A is the first of three waves in the corrective phase. Corrections are almost always more difficult to identify than impulse waves and most investors confuse them as interim corrections. Volume might increase in Wave A and volatility will also rise, although not nearly enough to imply a bottom.
Wave B tends to be the most difficult to identify. The volume of Wave B tends to be lower than that of Wave A. Wave B will consist of three sub waves and should retrace at least .62 percent of Wave A.
Wave C is often very impulsive and marks end of the current corrective phase. Volume may be higher in Wave C than in Wave A. Wave C is made up of five sub waves and terminates beyond the end of Wave A. Some studies suggest that Wave C should not continue beyond 1.618 times Wave A, but this is not a rule
The cart below shows the worst-case scenario based on current analysis. The low put in during the month of March could be in fact a bottom as there was a very small A-B-C correct pattern in March already.
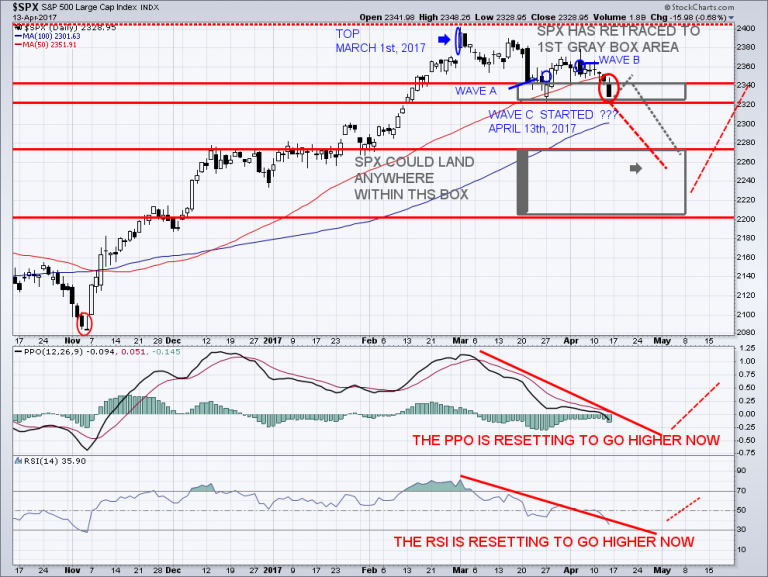
The momentum oscillators are now working themselves to the oversold levels. The SPX is in the midst of its Corrective Wave ‘A-B-C’ that has further to go on the downside.
There is no desire to rally. It appears that SPX is beginning its’ Wave C and it should see follow thru to the downside the next couple of weeks. The bond markets and gold markets will continue to have a very short-term run up, trading with a negative correlation to stocks.
What is the ‘McClellan Oscillator’
The Mc Clellan Oscillator is the most revered market breadth indicator. It is primarily used for short term trading. As one can see, when it closes under zero, the SPX starts its correction!
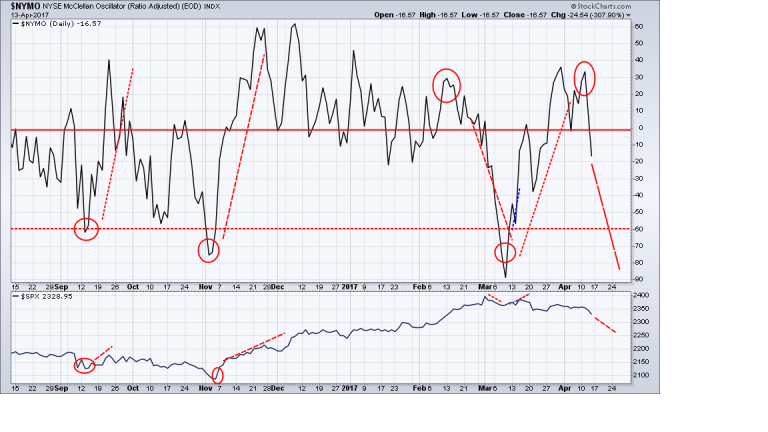
For now, I am just taking it play by play, but I think this scenario will work out. It should most likely come at least very close to this big picture!
If you want to take advantage of my insight and expertise as I can help you to grow your trading account. Tune in every morning for my video analysis and market forecasts at TheGoldAndOilGuy.com on all ‘asset classes’ and new ETF trade opportunities.
Momentum Is Resetting!
The SPX was the latest index to end a long streak of momentum. It closed below its 50-day moving average for the first time in more than 105 days. It also set a new all-time high during its parabolic move. Still, half of its 10 major sectors are still trading above their own moving averages. With momentum being this strong, it has historically led to above average returns 90 percentage of the times within three months.
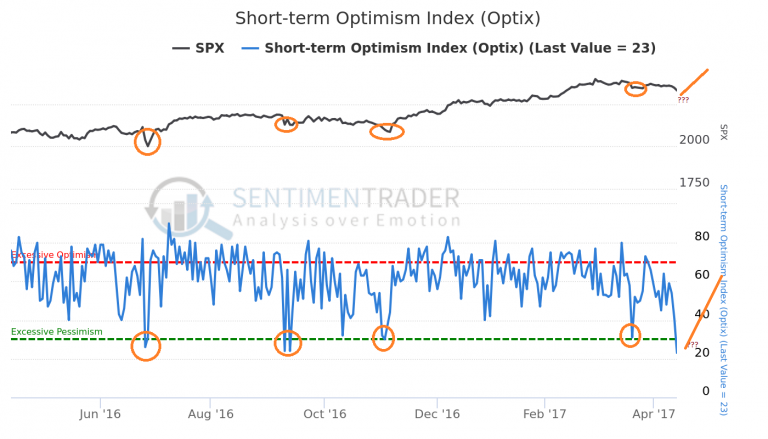
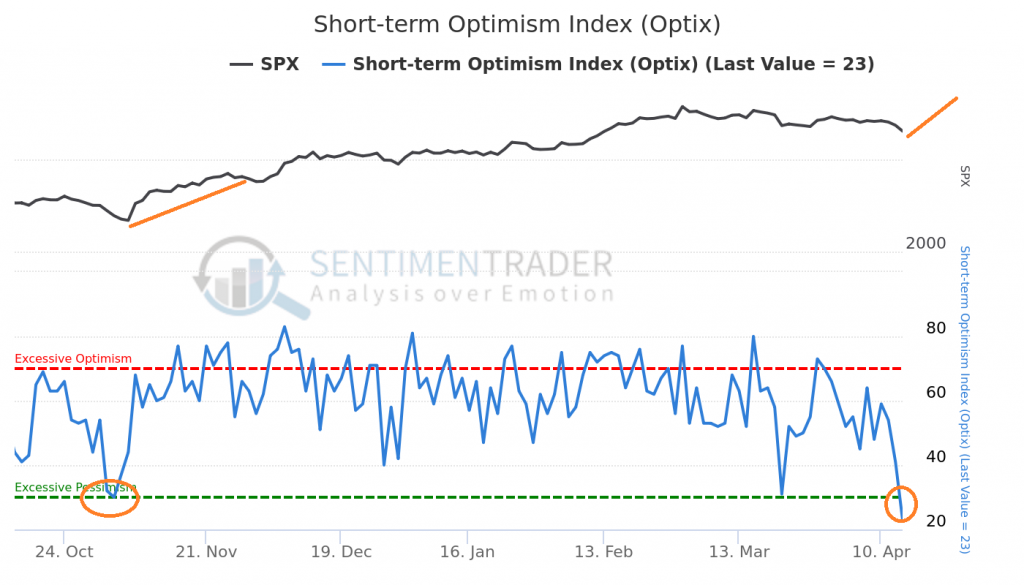
Latest Value:
Last Reading: 23.0: APRIL 13th, 2017
Extreme Values:
- Excessive Optimism: 70.0
- Excessive Pessimism: 30.0
Any values that drops below 40%, are showing “excessive pessimism”. The current reading is below 30%, now displaying the extreme, and is suggesting that a market bounce is likely to come soon!
On the six-month chart, which is shown below, one can view the strength of the next SPX rally will be very strong and unexpected by most traders. As I have mentioned in my recent market analysis, I believe the SPX is getting setup for a wonderful summer rally which will take it into the 2500 SPX range!
On a short -term basis, we are at that point where sentiment is overly ‘pessimistic’. Seasonality is turning positive and any further selling should be erased by the time when everyone pays Uncle Sam. When short -term sentiment becomes pessimistic, it creates a new BUY SIGNAL to re-enter the SPX long!
The Pessimism is getting close to its’ Extreme Value reading to register a good bottoming indication for prices. This fit well with my expectation from other indicators for a low this month.
Taking the impossible and making it possible!
As the stock market is in a corrective mode, breakouts and other reliable bullish patterns which every trader and his brother use have a greater risk of failing.
Momentum moves are significant, but normally short lived. My momentum strategy Momentum Reversal Method (MRM), is an ideal swing trading opportunity for quick profits. It captures short term 3-10 day “swings” in the market. This is the core benefit of my swing trading method, giving the trader the opportunity to obtain a short-term gain without long term risk exposure.
Recent Trading Results Include:
- UGAZ 74%
- ERX 7.7%
- NUGT 112%
- URA 2.7%
I currently have active trades which I anticipate will take off with the next market swing!
By sticking to my strict money management plan and being well prepared a trader has the opportunities to obtain great returns from short-term market movements.
Chris Vermeulen
www.TheGoldAndOilGuy.com
www.ActiveTradingPartners.com


-
I know Mike is a very solid investor and respect his opinions very much. So if he says pay attention to this or that - I will.
~ Dale G.
-
I've started managing my own investments so view Michael's site as a one-stop shop from which to get information and perspectives.
~ Dave E.
-
Michael offers easy reading, honest, common sense information that anyone can use in a practical manner.
~ der_al.
-
A sane voice in a scrambled investment world.
~ Ed R.
Inside Edge Pro Contributors

Greg Weldon

Josef Schachter

Tyler Bollhorn

Ryan Irvine

Paul Beattie

Martin Straith

Patrick Ceresna

Mark Leibovit

James Thorne

Victor Adair