


Yes, it’s happening.
And if you lose your job in five years, you will be one of the lucky ones.
It’s possible that your job is already gone, they just haven’t told you yet.
…related from Michael Campbell:


As if you need more proof that inflation is finally starting to pick up, lumber prices rose to a 12-year high last week, supported mainly by expectations that steep duties will soon be levied on cheap softwood imports from Canada. Lumber futures rose to nearly $415 per thousand board feet last Monday, a level unseen since March 2005, soon after homeownership peaked here in the U.S.
At issue is a mini-trade war between U.S. and Canadian loggers. For some time now, the American lumber industry has blamed its Canadian counterpart of unfairly dumping lumber in the U.S. that’s far below market value. Now, several factors are pushing timber prices higher. Chief among them are the likelihood of duties being raised at the Canadian border, possibly as early as next month; President Donald Trump’s calls to renegotiate NAFTA; and growing demand for new homes following the housing crisis as consumer optimism improves and millennial buyers finally seem eager to enter the market.
Shares of Canfor Corporation and Western Forest Products, Canada’s number two and number five lumber producers by annual output, have had a good three months, advancing 25.5 percent and 16.8 percent respectively as of April 12. Timberland-owner Weyerhaeuser has also impressed lately.
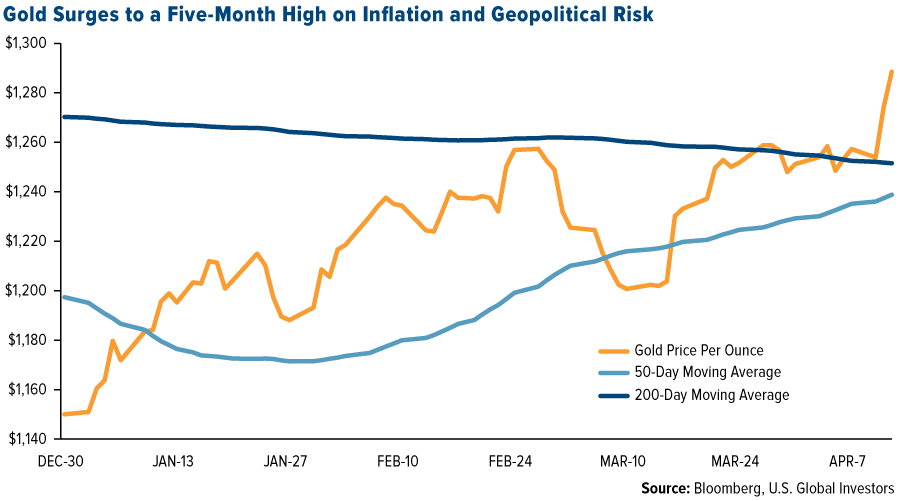
As I told Daniela Cambone during last week’s edition of Gold Game Film, this is all very constructive for the price of gold, which has historically been used as a hedge during periods of rising inflation. The yellow metal closed above $1,270 an ounce last week for the first time since soon after the November presidential election. A “golden cross” has not yet occurred, with the 50-day moving average still below the 200-day, but such a move appears likely in the next few trading sessions if upward momentum can be sustained.
Fueled also by geopolitical tensions associated with Syria, Russia and North Korea, gold demand is on the rise, with last Tuesday’s trading volumes on gold calls surging 10 times Monday’s amount on the New York Mercantile Exchange. As I already shared with you, investor sentiment of gold during the recent European Gold Forum was particularly strong. A poll taken during the conference showed that 85 percent of attendees were bullish on the metal, with a forecast of $1,495 by year’s end.
With the U.S. ramping up military action overseas, including its dropping of a devastating bomb in Afghanistan on Thursday, many investors are lightening their risk assets in favor of “safe haven” instruments such as gold and Treasuries. The S&P 500 Index dropped below its 50-day moving average last week, signaling a slowdown in blue chip stocks.
Financials were among the biggest laggards as investors have begun to question President Trump’s ability to deregulate the banking sector. After several disappointments and setbacks, including a failure to repeal and replace Obamacare, renewed military involvement in Syria and Afghanistan might provide a welcome boost to Trump’s sluggish job approval rating.
Gold also responded positively to recent comments by Trump on U.S. dollar strength and monetary policy. Specifically, he said the dollar is “getting too strong” and later supported a low interest rate policy, suggesting he might keep Janet Yellen as the Federal Reserve chair.
April is New Homes Month, and to celebrate, the National Association of Home Builders (NAHB) shared some of the significant contributions housing provides to the U.S. economy. According to the Washington, D.C.-based group, “building 100 single-family homes in a typical metro area creates 297 full-time jobs and generates $28 million in wage and business income and $11.1 million in federal, state and local tax revenue.” The sector currently accounts for 15.6 percent of U.S. gross national product (GNP).
Indeed, housing has a phenomenal multiplier effect on the economy, as I’ve pointed out before, and I’m pleased to see its recovery after nearly a decade.
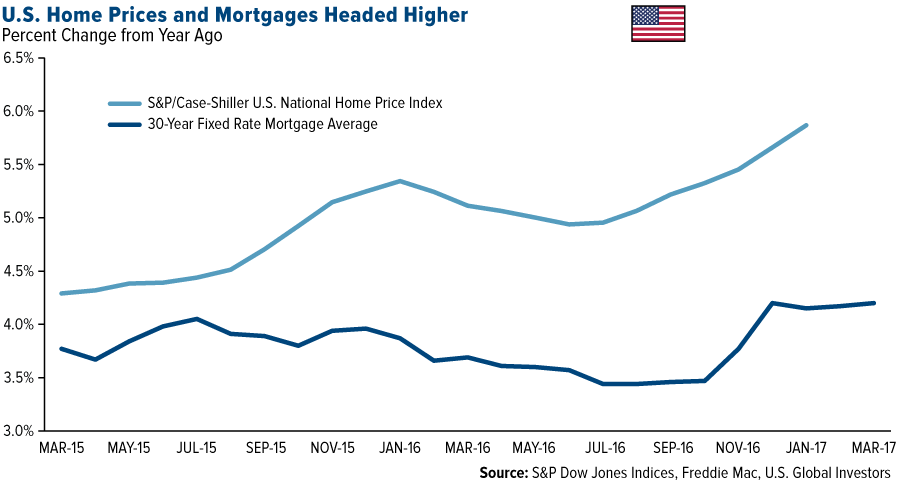
Not only is consumer confidence up, but homebuilder confidence, as measured by the NAHB, hit a 12-year high in March, supported by an improving economy and President Trump’s pledge to roll back strict regulations. In February, new housing starts hit 1.29 million units, beating market expectations of 1.26 million units.
Rising mortgage rates and home prices are also likely encouraging buyers to enter the market. With the 30-year rate having recently fallen to a fresh 2017 low, we might see an even stronger surge in mortgage applications.
Declines in homeownership among lower-income, nonwhite and young adults were especially dramatic following the housing crisis, as subprime lending, which many homeowners had previously relied on, all but dried up. Homeownership rates in the U.S. steadily fell to a 50-year low, which only lengthened the recovery time of the Great Recession. According to Rosen Consulting, a real estate consulting group, the U.S. economy would have been $300 billion larger in 2016 had the housing market fully returned to its long-term level of construction and homebuying.
Millennials, or those generally born between 1981 and 1998, have been the biggest holdouts, but we’re finally starting to see that change. The cohort—the largest group of homebuyers in the U.S. right now—represented around 45 percent of all new home loans in January of this year. It’s likely we’ll see this figure rise as more millennials become better established in their careers and tire of renting.
Some links above may be directed to third-party websites. U.S. Global Investors does not endorse all information supplied by these websites and is not responsible for their content. All opinions expressed and data provided are subject to change without notice. Some of these opinions may not be appropriate to every invest.
Holdings may change daily. Holdings are reported as of the most recent quarter-end. The following securities mentioned in the article were held by one or more accounts managed by U.S. Global Investors as of 3/31/17: Canfor Corp., Western Forest Products.
The S&P 500 Stock Index is a widely recognized capitalization-weighted index of 500 common stock prices in U.S. companies.
The S&P/Case–Shiller U.S. National Home Price Index is a composite of single-family home price indices for the nine U.S. Census divisions. It is calculated monthly, using a three-month moving average.

 Question: What if you find yourself as I do with real estate being the MAJORITY of your portfolio?
Answer:
“”If you have the bulk of your assets in real estate, then one way to keep them is to run out and get a 30-year FIXED mortgage now while you can. You have sold the risk to a third party and it is now their problem. You have the cash and wisely use for investment into other movable areas.”
“Real estate depends on how far down the rabbit hole we go. If government does not blink and it just keeps raising taxes trying to support a system that is unsustainable, then we end up in the full crash and burn and you are compelled to walk away from real estate. Hopefully, with education understanding the past, we can for once avoid the same outcome and advance in this learning curve of civilization.
Vacation properties are the worst to survive. I bought such a place to live in at about 50% of its 2007 high. So while high-end properties in cities were rising, vacation spots on the beach declined. I wanted beach front. So understanding the cycle helps tremendously for entry and exit points.
The risk of mortgages declining is real. As governments get in trouble, long-term confidence starts to decline….”
…more in this comphrensive article by Martin HERE
…related:
Michael Campbell & Ozzie Jurock more short term: Hot Properties: A Normal Spring Market?

There still seems to be some doubt in many investors minds on how much gold there is in the world. I continue to receive emails from individuals who read articles stating that the amount of gold in the world is much greater than the official estimate. Recently, I have received a spike of emails questioning the amount of gold in the world due to all these supposed “SECRET GOLD STASHES.”
Due to this, I decided to write an article to set the record straight… once and for all. I actually wrote about this in a previous article early last year. However, new information as well as additional data should help provide more FACTS vs the LOUSY CONSPIRACIES.
Before I provide this information, I would like to say the following… I mean no ill will or disrespect for analysts that I disagree with. That being said, I find it quite frustrating when individuals are being misled due to faulty or incorrect information put out by these analysts. Some analysts even state their “Conspiracy Theories” are not conspiracies, but rather…. FACTS. This is even more erroneous than providing a faulty conspiracy.
For example, some precious metals analysts suggest the Fed and Central Banks can push the price of gold anywhere they see fit. This is totally false. There is some method to their madness. This chart, republished from a previous article, shows the gold market price versus the cost of production from the top two gold miners (Barrick & Newmont) 2000-2012:
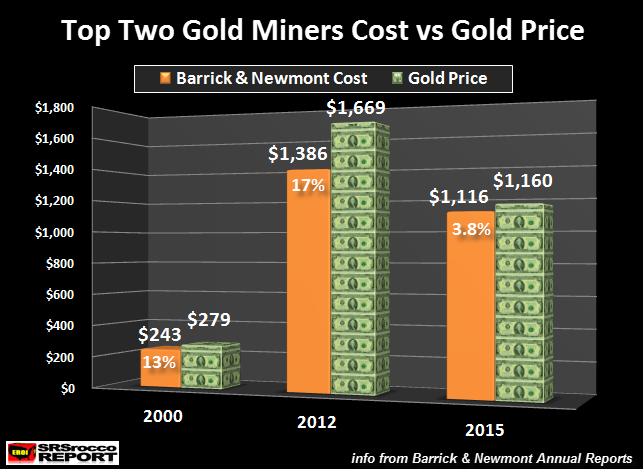
From 2000 to 2012, the total production cost for these top two gold miners increased from $243 an ounce to $1,386. Thus, their cost of production in 2012 jumped 5.7 times higher than it was in 2000. Interestingly, the gold market price increased 6 times from $279 in 2000 to $1,669 in 2012. Thus, the overwhelming increase in the market price of gold was a result due to a much higher gold production cost.
Moreover, we can see that the production cost of gold was $1,116 in 2015 versus a market price of $1,160. Which means, the gold market price in 2015 was approximately 4% higher than the cost of production from these two top miners. The Fed and Central Banks cannot push the price of gold down too far below its cost of production, or SAVVY TRADERS will come in with both hands and buy up as much as they could. Smart traders understand this cost of production-market price relationship.
Okay, let’s get back to the notion of all this SECRET GOLD being hid in the world. A few years ago, Antal Fekete and Karen Hurdes did an interview where Karen spoke about acquiring all this hidden gold in Hawaii and using it to back the U.S. Dollar. I have a great deal of respect for Antal Fekete, but for him to be sitting next to Karen as she spoke about this… makes me wonder how much he regretted it later on.
Regardless, for being a very bright individual, Karen Hudes is guilty of not fact checking her assumption that there is 170,000 metric tons (mt) of gold hidden to be used to back the Dollar. I came across an excellent article titled, Karen Hudes & Wolfgang Struck Using Myths To Muddle Global Financial Reset:
There are multiple parties that have been using the fabled Marcos Gold, Yamashita Treasures, and bogus Maharlika land titles for extracting “membership and processing fees” from unwitting victims.
As of late, personalities like Karen Hudes and Wolfgang Struck, both claiming to have worked in the World Bank, and UBS, respectively are advertising their collective efforts to cause a global reset through the “Global Debt Facility”.
The problem with what these two self-confessed experts on global finance is that they are supporting their claims with spurious historical data, some even strayed too far from alternative accounts now beginning to surface here in the Philippines.
There’s a lot of good reading there as well as documented proof that many of the claims made by Karen Hudes are completely unfounded. I don’t want to waste too much time on the specifics as the article does an excellent job. Those with doubts, please take the time to read that article.
Then we have the work of Bix Weir at Road To Roota. While I agree with Bix that the value of gold and silver will rise in the future, we are world’s apart on the LOGIC and FACTS. Bix provides his thoughts on the amount of gold in the world in his section of his site called, GOLDEN SECRETS:
Fair Warning! What follows may scare the Dickens out of you gold bugs but will make silver bugs fall over themselves to swap even more of their gold for silver. Refresh yourself on the benefits of swapping gold for silver here: http://www.roadtoroota.com/public/136.cfm
The mainstream gold world wants you to believe that in the entire history of gold mining there has been just over 180,000 tons of gold mined from the ground. On top of that, with all our latest seismic and exploration technology, we have only found about 100,000 tons of underground gold reserves that could be economically mined in the future. That is what “they” want you to believe but…
THIS IS A BOLD FACED LIE!
Don’t get me wrong…I’m a gigantic gold buff but we need to understand the truth to ever reach a point where gold can take it’s rightful place in our corrupt monetary system….
WHAT THE PUBLIC KNOWS
There are two widely accepted gold statisticians that are followed religiously by the gold mining companies, central banks, governments and investment community:
Above Ground Gold: GFMS, Ltd. is the above ground gold market prognosticator and claims that the total amount of gold ever mined in the world is 180,000 tons (5.8B oz). Historically, this measure rises only as gold is pulled from the ground as reported by global gold mining companies around the world. Any “mystery gold” that suddenly appears on the market in ETF’s, on the LBMA, in the COMEX warehouses or in Government coffers is assumed to come from the unreported gold held by private individuals so that their historical figures never have to change.
In many of Bix’s interviews, he states that the above-ground gold figure was originally stated by Harry Oppenheimer in the 1960’s. What Bix is suggesting here is that the gold market and mining industry is just taking one individual’s analysis for the basis of all the gold mined to date. This is akin to providing ONE SOURCE when a student is writing his PhD dissertation. If a student did that, the teacher would look at him straight in the face and say, “ARE YOU INSANE or STUPID??”
Unfortunately, some analysts do not do enough fact checking. While they may provide additional supposed sources, they do so from the same area. However, to provide accurate analysis, you must provide data and sources from many different areas. That is what I try to do to make sense of it all.
For example, the 2017 GFMS Gold Survey stated that total historical gold mine production is estimated to be 187,500 mt, with a current value of $7.7 trillion. I can assure you, GFMS did not pull that figure out of thin air, or take the word of one Harry Oppenheimer, more than 50 years ago. Rather, the historical data on global gold mine production has been done by several sources over 100 years ago.
Here is a table from the U.S. Bureau of Mines Summarized Data On Gold Production, published in 1929:

In the U.S. Bureau of Mines report, there were plenty of older sources quoted. Here are a few:
 https://dj0s31cxqi9ot.cloudfront.net/wp-content/uploads/2017/04/US-Bureau-Of-Mines-1929-Sources-60×35.png?x65756 60w”>
I would also imagine these sources above would likely quote even older sources. So, as we can see here, there is AMPLE FACTUAL data going back 150 years (or more) that provides reasonable estimates of historic world gold production. While the estimates are not EXACT figures, they can be relied upon as a good approximation.
I took the data from the U.S. Bureau of Mines 1929 report as well as more current data from the USGS – U.S. Geological Survey and GFMS to create the chart below of world gold production to date:
 https://dj0s31cxqi9ot.cloudfront.net/wp-content/uploads/2017/04/World-Gold-Production-1493-2016-60×43.png?x65756 60w”>
My figure of 173,000 mt only uses data from 1493-2016 and may be a bit different due to using USGS figures for certain years rather than GFMS data. So, if we include gold produced prior to 1493, my 173,000 mt figure is quite close to GFMS estimate of 187,500 mt.
Now, the reason world gold production surged in the 1900’s was due to the advent of oil. A barrel of oil equates to thousands of energy slaves. Thus, as global oil production increased exponentially after 1900, so did gold production. Matter-a-fact, 91% of all gold produced since 1493 came since 1900 and 70% of all that gold was produced since 1950.
Which brings us to this LOGICAL conclusion…. How can there be 1-2 million tons of gold in the world hidden in these supposed underground vaults if the world was only able to produce less than 200,000 mt???
Some people believe the ancient peoples, such as the ancient Roman Empire, produced a lot more gold than we give them credit. Well, I have looked at some research that provided good estimations of ancient Roman gold production. I provided this information in my previous gold article:
Estimated Ancient Roman Gold Production
According to information from the ancient book, Naturalis Historia by Pliny the Elder who died in 79 AD,annual gold production in the Roman Empire was estimated to be 9 metric tons per year (Production in Asturia, Callaecia, and Lusitania (all Iberian Peninsula) alone – Wikipedia)
That 9 metric ton figure is not for the entire Empire, so lets attribute 15 mt per year. If we assume the Ancient Romans produced 15 mt of gold for 500 years, that would equal 7,500 mt. I doubt they produced that much, but if they did.. it still won’t change the total 170,000 mt figure all that much.
Regardless, most of the ancient gold produced may be lost forever. Which is why GFMS states that 170,000 mt is a good ball park figure. Now, could they have missed some… sure. So, let’s add another 30,000 mt to get a total of 200,000 mt. That is still ten times less than the 2 million ton figure that Bix Weir and Karen Hudes claim.
Folks, it is just physically impossible for ancient peoples to produce the amount of gold that can be extracted by massive haul trucks that can move 400 mt of ore in a single trip. These trucks average about 0.3 MPG. I spoke with someone who worked at a large open-pit mine and he told me that these huge haul trucks go through five sets of tires a year. Some of these tires are 13 feet high and cost $50,000+ a piece.
In addition, gold production wasn’t the only metal that increased exponentially with oil…. so did copper and silver (just to name a few):
 https://dj0s31cxqi9ot.cloudfront.net/wp-content/uploads/2017/04/Global-Copper-Silver-Gold-Production-Since-1900-768×520.png?x65756 768w, https://dj0s31cxqi9ot.cloudfront.net/wp-content/uploads/2017/04/Global-Copper-Silver-Gold-Production-Since-1900-60×41.png?x65756 60w”>
Here we can see that all three metals (copper, silver and gold) increased exponentially along with oil. Thus, if we assume the majority of most metals increased the most since 1900, especially since 1950, the majority of production of these metals have come more recently. Using logic, we can plainly see that the official estimate of 187,500 mt of gold produced in the world is likely a very realistic figure.
Now, the reason I bring this up again is to try to inform individuals who have been mislead by LOUSY CONSPIRACY THEORIES, that while conspiracies do take place and are real, not everything is a conspiracy theory.
Bix Weir also mentions there is all this gold hidden in the Grand Canyon due to some 1909 article on the Arizona Gazette. I suggest you all take a look at this article, Canyonitis: Seeing evidence of ancient Egypt in the Grand Canyon:
The original story goes that the team found an underground network of tunnels, high above the Colorado River, containing various ancient artefacts, statues and even mummies. A major discovery, no doubt about it. Impossible to slip off the archaeological radar. Still, the Smithsonian Institute will report it has no records on the subject. So what happened? To find out, there is only one guide: the article itself. Though the article was anonymous, it did identify some of the archaeologists involved: “under the direction of Prof. S. A. Jordan”, with Smithsonian-backed adventurer G. E. Kinkaid, who then relates his findings.
But the story gets weirder when the Smithsonian stated that it had no Kinkaid or Jordan on record. In one enquiry from 2000, the institution replied: “The Smithsonian Institution has received many questions about an article in the April 5, 1909 Phoenix Gazette about G. E. Kincaid and his discovery of a ‘great underground citadel’ in the Grand Canyon, hewn by an ancient race ‘of oriental origin, possibly from Egypt.’ […] The Smithsonian’s Department of Anthropology, has searched its files without finding any mention of a Professor Jordan, Kincaid, or a lost Egyptian civilization in Arizona. Nevertheless, the story continues to be repeated in books and articles.”
The article goes on to say that the truth is somewhere in between CONSPIRACY and FACT based on hidden Egyptian treasures… not a huge gold reserve. That being said, there are these folks called “INDEPENDENT GEOLOGISTS.” They can look at mineral and oil deposits and aren’t being paid by the corporations and the Elite to keep the supposed truth from Americans that there is all this HIDDEN GOLD and CAPPED OIL WELLS.
I still come across people who tell me that the United States has all these uncapped oil wells and when we want, we can just open up the spigot and let the oil flow. I can tell you from talking to several oil geologists that NO ONE ever wants to shut in an oil well… only if there are problems with the well. Why? Because once a well is shut in, when it is opened later on, its production never returns to what it was before. Shutting in an oil well normally destroys the productivity of the well in the future. Again… the oil industry does not want to SHUT IN AN OIL WELL… only if it has to, and not because of waiting for higher prices in the future.
Furthermore, I have also spoken to some gold geologists, and they tell me that if there was all this hidden gold in the United States, we would have gone after it already. Because, the economic model of resource extraction is that we go after the BEST FIRST, then mine the lower quality ore as time goes by.
Analysts who continue to talk about the hidden stashes of Hawaiian Gold, Yamashita’s Gold, the Nazi Gold and so on and so forth do so because people who don’t fact check are completely gullible. Moreover, those analysts who focus on what I call, LOUSY CONSPIRACIES can make money peddling this to their unsuspecting subscribers.
Folks… LOUSY CONSPIRACIES can be financially rewarding for analysts as it is addictive to their readers. And to keep the money flowing using this business model, more and more LOUSY CONSPIRACIES have to be promulgated. It is a sad and viscous cycle.
I hope this clears up the notion of 1-2 million tons of gold floating around in the world. Those who continue to believe it after they have read this article… you have my sympathies. Why? Because the Falling EROI – Energy Returned On Investment, not even known by those who peddle lousy conspiracy theories will push our modern society over the edge to collapse… a collapse we can never grow back out from.
Lastly, those analysts who promote a story that when the markets crash and the financial institutions are finally allowed to go bankrupt, that we can rebuild… are doing serious harm by misleading individuals. When the collapse comes, we won’t be able to grow out of this one. Rather, we transition to something more regional and local… at best.
Check back for new articles and updates at the SRSrocco Report.

 Summary
Artificial intelligence and automation is accelerating far faster than anyone realizes.
It is all extraordinarily disruptive.
This will cause corporate profits to rocket and share prices to soar, but at the price of higher nationwide political instability.
Yes, it’s happening.
And if you lose your job in five years, you will be one of the lucky ones.
It’s possible that your job is already gone, they just haven’t told you yet.
…related from Michael Campbell:


“Double-click to enlarge what I believe is the greatest bull wedge chart pattern in the history of global markets.”
Apr 18, 2017
Thanks!
Cheers
st
Apr 18, 2017
Stewart Thomson
Graceland Updates
website: www.gracelandupdates.com
Stewart Thomson is a retired Merrill Lynch broker. Stewart writes the Graceland Updates daily between 4am-7am. They are sent out around 8am. The newsletter is attractively priced and the format is a unique numbered point form; giving clarity to each point and saving valuable reading time.
Risks, Disclaimers, Legal
Stewart Thomson is no longer an investment advisor. The information provided by Stewart and Graceland Updates is for general information purposes only. Before taking any action on any investment, it is imperative that you consult with multiple properly licensed, experienced and qualifed investment advisors and get numerous opinions before taking any action. Your minimum risk on any investment in the world is 100% loss of all your money. You may be taking or preparing to take leveraged positions in investments and not know it, exposing yourself to unlimited risks. This is highly concerning if you are an investor in any derivatives products. There is an approx $700 trillion OTC Derivatives Iceberg with a tiny portion written off officially. The bottom line:

I know Mike is a very solid investor and respect his opinions very much. So if he says pay attention to this or that - I will.
~ Dale G.
I've started managing my own investments so view Michael's site as a one-stop shop from which to get information and perspectives.
~ Dave E.
Michael offers easy reading, honest, common sense information that anyone can use in a practical manner.
~ der_al.
A sane voice in a scrambled investment world.
~ Ed R.

Greg Weldon

Josef Schachter

Tyler Bollhorn

Ryan Irvine

Paul Beattie

Martin Straith

Patrick Ceresna

Mark Leibovit

James Thorne

Victor Adair