
Bonds & Interest Rates
Angst in America, Part 4: Disappearing Pensions
Defined What?
Risk Transfer
Public Playground
Unionized Losses
Nowhere to Hide
Houston and Deadlines
“Companies are doing everything they can to get rid of pension plans, and they will succeed.” – Ben Stein
“Lady Madonna, children at your feet
Wonder how you manage to make ends meet
Who finds the money when you pay the rent?
Did you think that money was heaven sent?”
– “Lady Madonna,” The Beatles

There was once a time when many American workers had a simple formula for retirement: You stayed with a large business for many years, possibly your whole career. Then at a predetermined age you gratefully accepted a gold watch and a monthly check for the rest of your life. Off you went into the sunset.
That happy outcome was probably never as available as we think. Maybe it was relatively common for the first few decades after World War II. Many of my Baby Boomer peers think a secure retirement should be normal because it’s what we saw in our formative years. In the early 1980s, about 60% of companies had defined-benefit plans. Today it’s about 4% (source: money.CNN). But today defined-benefit plans have ceased to be normal in the larger scheme of things. We witnessed an aberration, a historical anomaly that grew out of particularly favorable circumstances.
Circumstances change. Such pensions are all but gone from US private-sector employers. They’re still common in government, particularly state and local governments; and they are increasingly problematic. They are another source of angst for retirees, government workers who want to retire someday, and the taxpayers and bond investors who finance those pensions. Today, in what will be the first of at least two and possibly more letters focusing on pensions, we’ll begin to examine that angst in more detail. The mounting problems of US and European pension systems are massive on a scale that is nearly incomprehensible.
I came across a chart that clearly points to the growing concern of those who are either approaching retirement or already retired. This is from the October 2016 Gloom, Boom & Doom Report from my friend and 2017 SIC speaker Marc Faber. The gap in confidence between younger and older Americans is at an all-time high, after being minimal for many years. A survey by the Insured Retirement Institute last year noted that only 24% of Baby Boomer respondents were confident they would have enough money to last through their lifetimes, down from 37% in 2011. This is the case even after a most remarkable bull market run in the ensuing years.
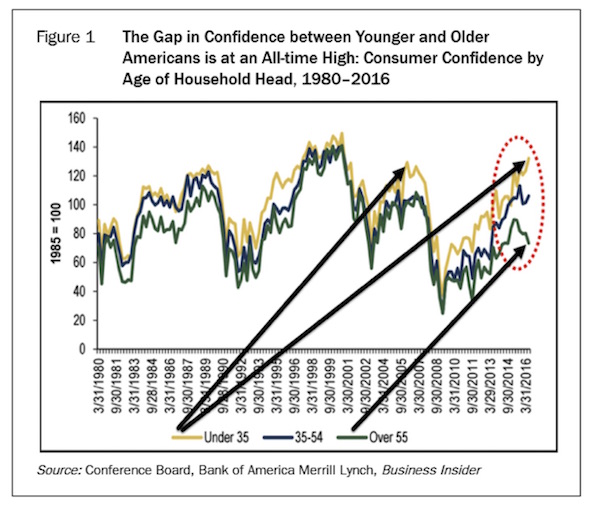
Even though the equity market has more than recovered, the compounding effect that everyone expected for their pension funds and retirement plans didn’t happen as expected. If the money isn’t there, it can’t compound. If your plan lost 40% in the Great Recession, getting back to even in the ensuing years did not make up for the lost money that was theoretically supposed to come from that 40% compounding at 8% a year. And, as I highlighted in last week’s letter, the prospects for compounding at 8% or even 5% in the next 10 years are not very good. Thus the chart above.
And speaking of Marc Faber’s joining us at the conference; let me again invite you to come to Orlando for my Strategic Investment Conference, May 22–25. I have assembled an all-star lineup of financial and geopolitical analysts who will help us look at what is likely coming our way in the next few years. Then we’ll spend the final part of the conference examining various pathways for the next 10 years and what we have to do to navigate them successfully. There is truly no other conference like this anywhere. I’m continually told by people who attend the Strategic Investment Conference that it’s the best investment conference they’ve ever been to. You can find out how to register here.
Let’s begin by defining some important terms. US law provides for various kinds of tax-advantaged retirement plans. They fall into two broad categories: defined-benefit (DB) and defined-contribution (DC) plans. The differences involve who puts money into them and who is responsible for the results.
Defined-benefit plans are generally the old-style pensions that came with a gold watch and guaranteed you some level of benefit for the rest of your life. Your employer would invest part of your compensation in the plan, based on some formula. In some cases, you, the worker, might have added more money to the pot. But regardless, at retirement your employer was obligated to send you a defined benefit each month or quarter – usually a fixed-dollar amount, sometimes with periodic cost-of-living adjustments.
(Note: There are defined-benefit plans that small, closely held employers such as myself or doctors/dentists can create for themselves and their employees that have significant retirement planning benefits but that function more like defined-contribution plans. For the purposes of this letter we’re going to focus on the more or less conventional types of plans rather than the multitudes of retirement plans that creative accountants and businesses have developed.)
Once your benefit was defined in this way, your employer was on the hook to continue paying under the agreed-upon terms. DB beneficiaries had no control over investment decisions. All they had to do was cash the checks. Employers took all the risk.
This arrangement works fine as long as you assume a few things. First, that your employer will invest the DB plan’s assets prudently. Second, that your employer continues to exist and remains able to make up any shortfalls in the plan’s liabilities.
DB plans work pretty well if those two things happen. It’s simple math for actuaries to estimate future liabilities based on life expectancies. They are uncannily accurate if the group is large enough. So the plan sponsor knows how much cash it needs to have on hand at certain future dates. It can then invest the plan assets in securities, usually bonds, calibrated to reach maturity in the right amounts at the right times.
That all sounds very simple, and it was, but the once-common scheme ran into trouble for reasons we will discuss below. First, though, let’s contrast defined-benefit plans with the other category, defined-contribution (DC).
DC plans are what most workers have now, if they have a retirement plan at all. The 401(k) is a kind of defined-contribution plan (as are various types of IRAs/Keogh/SEP plans, etc.). They are called that because regulations govern who puts money into the plan, and how much. Typically, it’s you and your employer. Your employer also has to give you some reasonable investment options, but it’s up to you to use them wisely. Whether there is anything left to withdraw when you retire is mostly up to you. Good luck.
Which type of plan is better? The more salient question is, which is better for whom? Both have their advantages. People like feeling they have some control over their future, but they also like certainty. Companies, on the other hand, like being able to transfer risk off their balance sheets. DC plans let employers shuck the risk.
The rub, of course, is that abundant evidence now shows that most workers are not able to invest their 401(k) assets effectively. That reality explains some of the retirement angstwe discussed two weeks ago. But DB plans are no bed of roses, either, particularly when you put elected officials in charge of them and make unionized government workers their beneficiaries.
Defined-benefit plans have issues going way back. The Studebaker Motor Company had such a plan when it began shutting down in 1963. The plan turned out to be deeply underfunded and unable to meet its pension obligations. Thousands of workers received only a small fraction of what they had been promised, and thousands more received zero.
That failure kicked off several years of investigations and controversy that eventually led to the law called ERISA: the Employee Retirement Income Security Act of 1974. It set standards for private-sector pension plans and defined their tax benefits under federal law.
Important point: Neither ERISA nor any other law requires employers to offer any kind of retirement or pension plan; it just sets standards for those who do. Those standards have turned into something of a mess, frankly. The IRS, Labor Department, and assorted other agencies all have their own pieces of the regulatory pie. It is no wonder that many smaller companies don’t have retirement plans. Simply doing the paperwork is a big job.
That aside, ERISA succeeded in bringing order to previously inconsistent practices. Workers gained some protections that hadn’t existed before, and employers had legal certainty about plan administration. ERISA also created the Pension Benefit Guaranty Corporation (PBGC) to insure pension plans from default and malfeasance.
Many experts believe the PBGC will run out of money in as little as 10 years at its current funding levels. The PBGC is not taxpayer-funded (yet) but exists as a classical insurance fund into which each retirement plan pays roughly $27 per year per covered employee. That figure would need to increase to $156 per year per person just to give the PBGC a 90% chance of staying solvent over the next 20 years.
And if your plan goes bankrupt and you fall into the gentle hands of the PBGC, your pension funding is likely to be cut by 50% or more. Plans that were at one point quite generous could see their beneficiaries lose as much as 75–80% of their previous monthly payouts.
ERISA was all to the good, but it couldn’t cure the biggest headache: the growing amount of money that companies had to to contribute to their plans to keep them fully funded. Plans that covered retiree health benefits had an additional headache trying to project future healthcare costs. Yes, that was a big deal even back in the 1970s.
In 1980, a benefits expert named Ted Benna discovered the 401(k). Yes, he literally discovered it in changes to the Internal Revenue Code that had become law two years earlier. No one set out to create the kind of plans we now recognize as 401(k)s; Benna just looked at the new law and realized it would allow such a thing. That’s where we got the defined-contribution plan.
The initial idea was that the 401(k) would be a supplement to an employer’s DB plan, but employers soon realized that it could also be a replacement. That was an attractive option for many companies, so they began dropping their DB plans and instead expanded their 401(k) contributions.
Business owners will understand this well. I’ve been there, too. You have enough headaches as it is. Having the benefits manager come around at the end of a year when the market had underperformed, telling you to write an additional giant check to the DB plan, was not fun. With a 401(k), in contrast, you could add a little match to everyone’s checks on paydays and be done with it. No one would pop up years later and tell you it wasn’t enough. That some employees liked the idea of having control over their retirement accounts was even better.
DB plans got even less compelling when Alan Greenspan began pushing interest rates down ahead of Y2K. Lower rates meant employers had to pitch in more cash to keep the plans funded at the necessary level. Or, they had to take on additional investment risk and be ready to make up any losses from the company’s resources. None of that is attractive to most business owners. Now DB plans are all but unknown in the private sector, the main exceptions being union-run plans and those run by one-person professional corporations like physicians and lawyers.
Note carefully: The risks and worries associated with retirement plan funding have not disappeared. They have simply been dispersed from a small number of employers to a much larger number of employees. As we discussed earlier, very few of the latter are in a comfortable position. I don’t mean to be flippant here, but it’s true: If DC plan owners aren’t worried, they should be. The days of retiring with a gold watch and a guaranteed monthly check are gone.
ERISA applies only to private-sector employers. Government entities need not comply with ERISA’s many requirements, which is good because many of them don’t. They do, however, have massive retirement obligations to their retirees and workers that simple math says will land them in some form of default. The promises are too generous, and the resources to meet them are too scarce.
The really frustrating part is that this impending crunch was completely predictable, given what we know of politics in this country. Elected officials make extravagant promises to attract votes or contributions. But everything takes time in government, so politicians just delay making changes long enough that everyone forgets or finds other things to worry about.
Pension promises aren’t like campaign promises to build new parks or sewers; Governments can’t forget pension obligations. Pension plans are not like other, more general public services. They involve specific amounts of cash owed to specific people on specific dates. Those dates will arrive, and the cash has to be there. State and local governments can’t run endless deficits the way the federal government does.
That’s all obvious; yet, for some reason, two things happened in recent decades:
State and local politicians kept raising pension benefits.
State and local workers believed the promises.
In fairness, we can’t expect city council members and firefighters to be financial experts. But they have access to experts. The unions that negotiate most public pension contracts have their own lawyers, accountants, and actuaries. They should know whether they are being offered unrealistic projections and promises. And elected officials likewise have expert counsel, so they should know, too. So I’m not sure who is more at fault.
By the way, I have a great deal of respect for the people who keep our cities and states running. Those who protect citizens from harm or otherwise provide public services deserve fair wages and benefits. Pensions are part of that. However, we can’t make something from nothing.
One problem is that accounting rules permit governments to do things private companies can’t. They calculate contributions to their defined-benefit plans in, shall we say, aggressive ways that do not serve anyone well. And, they can shop around for consultants who will tell them what they want to hear. What they want to hear is that they can get away with adding less to the pension fund so they can spend more on shiny new buildings or just fix the roads and keep up with normal city services that make them look productive.
Eventually the math catches up. Here’s a chart my friend Danielle DiMartino Booth included in a Bloomberg View article on this topic last month.
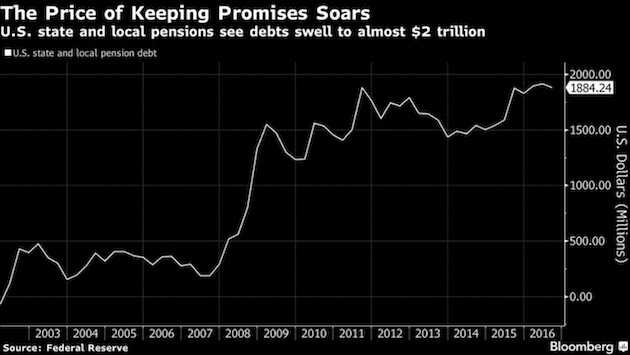
Here we see how state and local pension costs have soared in the last decade. Total unfunded liabilities amounted to only $292 billion in 2007. They have more than quintupled since then, to $1.9 trillion. That’s due to a combination of extravagant promises, poor investment results, and failure to contribute enough cash to the plans. Danielle reels off some startling numbers:
Federal Reserve data show that in 1952, the average public pension had 96 percent of its portfolio invested in bonds and cash equivalents. Assets matched future liabilities. But a loosening of state laws in the 1980s opened the door to riskier investments. In 1992, fixed income and cash had fallen to an average of 47 percent of holdings. By 2016, these safe investments had declined to 27 percent.
It’s no coincidence that pensions’ flight from safety has coincided with the drop in interest rates. That said, unlike their private peers, public pensions discount their liabilities using the rate of returns they assume their overall portfolio will generate. In fiscal 2016, which ended June 30th, the average return for public pensions was somewhere in the neighborhood of 1.5 percent.
Corporations’ accounting rules dictate the use of more realistic bond yields to discount their pensions’ future liabilities. Put differently, companies have been forced to set aside something closer to what it will really cost to service their obligations as opposed to the fantasy figures allowed among public pensions.
The situation is actually far worse than the chart shows. The $1.9 trillion in liabilities presumes that the plans will earn far more over time than the 1.5% return they actually made in 2016. Danielle says unfunded liabilities are as much as $6 trillion by some estimates.
Anytime we see a liability, the unspoken assumption is that someone is liable. Who is liable for public pension obligations? Probably you, depending where you live or own property. State and local governments’ prime asset is the ability to tax their residents. We are financially responsible for the poor and/or self-interested decisions of the politicians we elect. That’s one reason we ought to pay far more attention to local elections than most of us do. Congress and the White House matter a great deal – but so do state legislatures, school boards, and city councils.
When we have a significant bear market during the next recession (that is not an if but rather a when), that $6 trillion figure will balloon to double that amount or more. And remember, those are state and local obligations that must be paid from state and local tax revenues. Paying them would require tax increases for many municipalities and would more than double current tax rates.
Sound incredible? My own city of Dallas, whose Police and Fire Pension System was advertised as solvent just a few years ago, is now so deep in the hole that it would take almost a doubling of city taxes to plug the gap. Note that I bought my Dallas apartment after that news was announced. I was not pleased when I read that headline. Such an increase would make my taxes cost more than my mortgage. Can you say taxpayer revolt? Houston is another city with such problems.
Nationwide, state and municipal spending has risen from $730 billion in 1990 to $2.4 trillion in 2015. And yet the amount of money used to fund pensions has risen only a fraction of the amount that other spending has. The financial problems of Illinois and many California cities are well known. Let’s turn to a chart listing some of the problem areas in the state of Massachusetts:
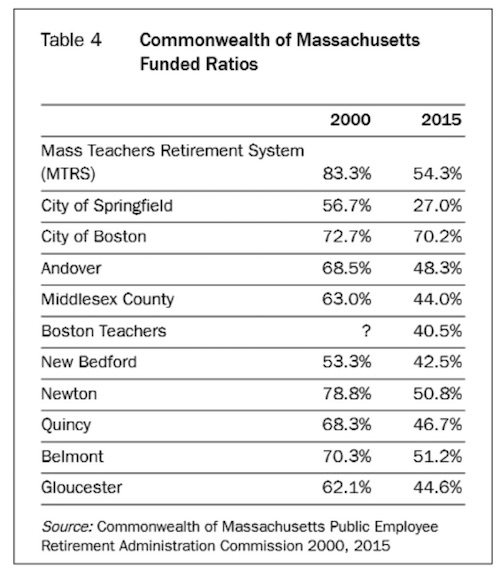
(Note that most Massachusetts government workers are not eligible for Social Security. This is going to be a serious tragedy when push finally comes to shove.)
It is almost actuarially impossible for pension funds that are less than 50% funded to catch up without massive tax hikes that are implemented solely to allow increases in pension payments but that also result in reductions in services, not only for retirees but for the general public as well. Those pension-funding levels are going to be further eroded during the next recession because more and more cities and states are increasing their equity exposure, and low interest rates are not helping matters.
We have here the proverbial irresistible force/immoveable object quandary. Government agencies signed contracts guaranteeing retirement benefits to their workers. The workers did their jobs, many for decades, trusting that the promises were solid. Now we see that they often weren’t.
It’s hard to imagine good outcomes here. Retirees want what their contracts promised, but the money just isn’t there. Governments have little recourse but to raise taxes, but the taxpayers aren’t captives. Higher property taxes will make them move elsewhere. Higher sales taxes will make them shop elsewhere.
My good friend Marc Faber generously let me use one of his newsletters in Outside the Box last week. In discussing household wealth, he notes that while the nation’s $22 trillion in pension fund assets is a main component of household wealth, much of it may be illusory. The illusion is slowly being exposed, and not just with regard to public-employee pensions. Union plans are in trouble, too. Marc explains with a February 2017 New York Daily News story.
Narvaez, 77, got a union certificate upon retirement in 2003 that guaranteed him a lifetime pension of $3,479 a month.
The former short-haul trucker – who carried local freight around the city – started hearing talk in 2008 of sinking finances in his union’s pension fund.
But the monthly checks still came – including a bonus “13th check” mailed from the union without fail every Dec. 15.
Then Narvaez, like 4,000 other retired Teamster truckers, got a letter from Local 707 in February of last year.
It said monthly pensions had to be slashed by more than a third. It was an emergency move to try to keep the dying fund solvent. That dropped Narvaez from nearly $3,500 to about $2,000.
“They said they were running out of money, that there could be no more in the pension fund, so we had to take the cut,” said Narvaez, whose wife was recently diagnosed with cancer.
The stopgap measure didn’t work – and after years of dangling over the precipice, Local 707’s pension fund fell off the financial cliff this month. With no money left, it turned to Pension Benefit Guaranty Corp., a government insurance company that covers pensions.
Pension Benefit Guaranty Corp. picked up Local 707’s retiree payouts – but the maximum benefit it gives a year is roughly $12,000, for workers who racked up at least 30 years. For those with less time on the job, the payouts are smaller.
Narvaez now gets $1,170 a month – before taxes.
This is stunning. The union worker they mention went from a $3,479 monthly benefit, supposedly guaranteed for life, to $1,170 a month. That’s a 66% pay cut. Worse, it seems to have happened with almost no warning, to a man in his late 70s with a cancer-stricken wife. What an awful situation – and it will be an increasingly common one for anyone depending on a union pension. The story quotes one union pension lawyer:
“This is a quiet crisis, but it’s very real. There are currently 200 other plans on track for insolvency – that’s going to affect anywhere from 1.5 to 2 million people,” said Nyhan. “The prognosis is bleak minus some new legislative help.”
I am sorry to disappoint Mr. Nyhan, but “legislative help” is not on the way. Legislatures have their own pension headaches. So he’s right that the prognosis is bleak. PBGC doesn’t have infinite resources. The only answer is some combination of benefit cuts for current retirees and higher contributions from current workers.
That $156 annual per-worker hike that I mentioned above for the PBGC? As more and more companies and governments abandon their defined-benefit plans, there will be fewer and fewer people to make those contributions, which means that future contributions to the PBGC will potentially need to be much higher still.
So we have seen that both public employees and union workers are right to worry about their pensions. We saw in part 3 of this series that millions more have no significant retirement savings. What about private-sector pensions? As noted, defined-benefit plans are disappearing, but many companies still have legacy plans covering current retirees and those approaching retirement. Marc Faber is not optimistic for them:
So, whereas priorâ¨to the 2008/2009 crisis S&P 1500 companies were fully funded, today funding has dropped below 80% (see Figure 7 of the October 2016 GBD report). I also noted that I found the deteriorating funding levels of pension funds remarkable because, post-March 2009 (S&P 500 at 666), stocks around the world rebounded strongly and many markets (including the US stock market) made new highs. Furthermore, government bonds were rallying strongly after 2006 as interest rates continued to decline. My point was that if, despite truly mouth-watering returns of financial assets over the last ten years, unfunded liabilities have increased, what will happen once these returns diminish or disappear completely? After all, it’s almost certain that the returns of pension funds (as well as of other financial institutions) will diminish given the current level of interest rates and the lofty US stock market valuations .
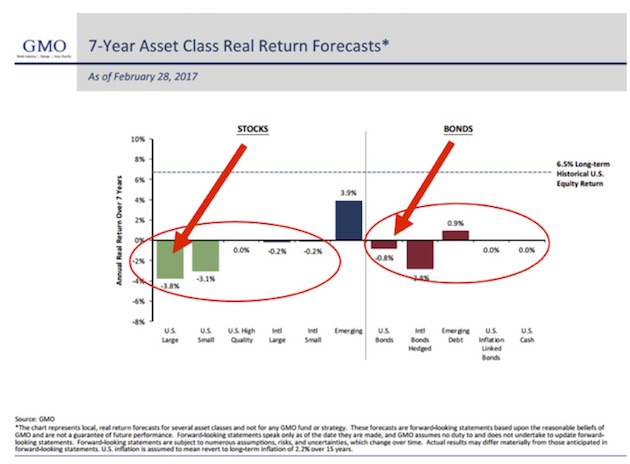
What if returns over the next seven years look like these projections from Jeremy Grantham of GMO (whose accuracy correlation has been running well north of 95%):
The deeper you look, the worse this pension situation gets. Angst is a perfectly reasonable response for anyone who is retired or thinking about retiring in the next decade. People don’t have sufficient IRA or 401(k) savings; Social Security will be of limited help; defined-benefit pensions are unlikely to be as generous as advertised; and healthcare costs keep climbing. All of the above will keep taxes rising, too, even as the economy remains mired in slow-growth mode at best or enters a long-overdue recession.
I want to end this letter on a positive note. Can we see any glimmers of hope? Some, yes. As I noted last week, one answer for older workers is to work longer and delay retirement. That gives you more years to save and fewer years to consume your nest egg. It doesn’t have to be drudgery if you plan ahead and design your encore career strategically.
Helping on that front will be some truly amazing medical breakthroughs. I see them in the biotechnology research Patrick Cox and I follow. I spent two days in Florida with Patrick and a few biotech revolutionaries last week, and it is hard not to be very encouraged. You should begin to see some of what we learned become publicly available in the next year or two. These developments will increase both lifespans and health spans, letting us stay active well into our 80s and beyond.
Finally, someone responded to part 3 of this series by pointing out that the Baby Boomer generation is still set to receive trillions in assets held by their still-living parents. That could help. The oldest boomers are now 72, which means their parents are likely in their 90s.
That said, if your retirement plan consists of waiting for your parents to die and leave you their house, you are still in a very risky position. For one thing, how much is the house really worth? How much will it be worth as more people like you try to sell houses like that one? Who will buy them?
I talked in part 3 about our tendency to deal with immediate needs first. So many other things seem like higher priorities than retirement planning and saving. What do you do?
Theodore Roosevelt may have had the best answer: “Do what you can, with what you have, where you are.” Angst frequently paralyzes us. Don’t let it. Maybe you can’t do everything it takes, but you can do some of it. Start there.
I will have a quick daytrip to Houston next week, but my calendar looks amazingly clear for almost a month, except for a flurry of conference calls. The next big event seems to be the Strategic Investment Conference May 22–25! You really should plan on joining me there.
Being at home for a while is good, because I have so many deadlines and so much research and reading to do that I really need some time to catch up. I glance at the inbox on my computer, and I find that I have achieved a personal all-time high number of unanswered messages at 602 – which is not exactly something I should be proud of. I probably owe a bunch of you responses. Hopefully I will get to them in the coming weeks. Plus, I have a number of deadlines, both business and writing, that are looming in the next month, so not traveling might actually enable me to meet some of them.
In my defense, I did mostly unplug while I was at the Masters (which, if you are a golfer, is as awesome as you think it would be). And this year’s final day shoot-out was just the stuff of legends. What a great Masters to attend! It was really fun to watch Sergio against one of the greatest young golfers in a head-to-head battle. That, and I had some of the greatest hosts you could possibly want to have. They asked me not to mention their names, but they know they are, and Shane and I are thoroughly grateful.
And then I ended up spending an extra day in Florida, delving into the future of biotechnological research and aging. Things seem to be happening a lot faster than I expected just a few years ago. Or maybe I’m thinking it was just a few years ago when I last caught up with this field, and it was actually more like 10. In any event, I’m convinced that if you are younger than 55, you really do need to plan to work longer than you expected to. And those of us who are older need to take better care of ourselves so that we have a chance for some of these new developments to actually make a difference for us.
When I heard Ray Kurzweil say some 15 years ago that it was his goal to live long enough to live forever, I sighed. Now, I am no longer sighing. I am actively planning how to go about doing that very thing. No, I don’t want to be a 105-year-old shriveled up ghoul, barely able to move about. The promise that induced tissue regeneration seemingly holds for reversing the effects of old age within my lifetime is astonishing, and what was impossible now seems potentially doable. There still a long way to go, but there are researchers who believe they can see a path where none existed before.
So for now, let’s hope that some of the true antiaging drugs that are in the labs actually turn out to be useful. But there are some things we know now: A healthy diet, working out and getting plenty of aerobic exercise, taking the medicines that we know are helpful (like blood pressure medicine), keeping mentally active and involved, and maintaining healthy relationships will go a long way to increasing our life and health spans.
There’s nothing you can do about accidents, genetic diseases, and so forth. Yet. But I just hope that I can be writing this letter for a very long time and that you will be with me as we figure out how to manage an ever-changing and ever-more-interesting world.
Have a great week and make it your Easter resolution to get into the gym more.
Your not planning on going gently into that good night analyst,

John Mauldin
subscribers@MauldinEconomics.com

Strengths
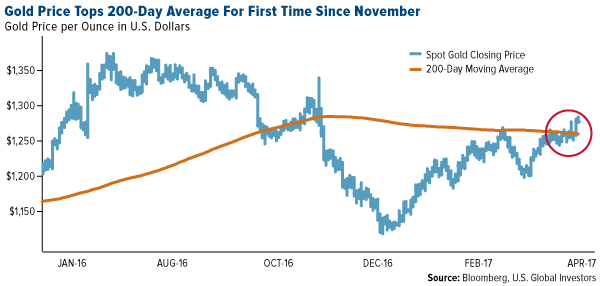
- The best performing precious metal for the holiday-shortened week was silver, up 3.01 percent, followed by gold, up 2.66 percent as geopolitical risks surrounding Syria and North Korea sparked demand for haven assets. Gold settled above its 200-day average for the first time since November, reports Bloomberg.
- Indian gold imports surged nearly seven-fold, or 582 percent, in March from a year earlier, reports Bloomberg. Jewelers stocked up on the yellow metal in anticipation of a demand recovery during the wedding season that began this month, with shipments advancing to 120.8 metric tons since last year, the article continues.
- The U.K. Royal Mint’s gold sales jumped 20 percent during the first quarter of the year, reports Bloomberg, following month-on-month declines in January and February. In volume terms, March sales jumped 263 percent, while gold sold and stored by the mint under its Signature Gold program—which allows partial ownership of bars held in its vault—jumped 178 percent in March.
Weaknesses
- The worst-performing precious metal for the week was palladium, down 0.85 percent. Hedge funds had boosted their net-long position in the futures market to a two-year high in the prior week just as a report came out the following week that U.S. auto sales slumped in March.
- The London Bullion Market Association (LBMA) PM gold price was set nearly $15 below spot on Tuesday, reports Kitco News, once again putting the market’s transparency in the spotlight. Jeff Christian, managing director at CPM Group, says he sees this as the effect of poorly conceived regulations and a faulty price discovery mechanism. Because banks and financial institutions are backing away from becoming market makers, Christian says this has resulted in a sharp reduction in liquidity during the auction process, creating a large discrepancy in prices. “There is something wrong with the process. You have a working spot market and then you have to stop that to then go over to this auction,” he added.
- Gold’s rally steadied earlier in the week on the back of U.S. jobs data that is consistent with the economy growing at 2 percent this year. “The U.S. jobs data was weaker than expected and these provided good support to gold until investors digested the data,” Brian Lan, managing director of GoldSilver Central, said over email. Other news comes from Centerra Gold this week, which reported a fatality at its Kumtor mine in the Kyrgyz Republic. According to Bloomberg, on April 11 a vehicle mechanic was fatally injured while inspecting a light vehicle pickup truck in the field.
Opportunities
- President Donald Trump had a few notable remarks this week, the first being that he will not brand China a currency manipulator, as he previously promised as part of his election platform. As for the second, he thinks the U.S. dollar is too strong, making the U.S. noncompetitive globally as other countries continue to devalue their currencies. Although the dollar dropped after these currency remarks, gold jumped around $8 on the news, potentially setting the backdrop for further gains.
- This week’s quote of the week comes from Secretary of State Rex Tillerson on the matter of chemical weapons in Syria: “The Russians are either complicit or incompetent.” Tillerson seems to have found his voice after enduring criticism of being silent and sidelined in the Trump administration. He traveled to Moscow to deliver his message of disappointment to Russia for its inability to deliver and oversee Syria’s supposed removal of chemical weapons. And just to make sure that anyone thought “59 and done” Tomahawk missiles launched into Syria was where the Trump administration was stopping, it was revealed on Thursday that the U.S. dropped the massive “Mother of all Bombs,” the largest non-nuclear bomb in the world, on suspected terrorist camps in Afghanistan.
- According to BMO Capital Markets, there will be a massive rebalance trade around the GDXJ ETF rebalances in June 2017, including significant demand for around 18 potential new additions, as well as a large selling of existing GDXJ names. There are some huge flows around these gold names, with an average daily trading volume of eight days of volume. The ETF will need to sell $3 billion worth of its existing holdings to buy the new additions, which will create a massive funding trade significantly impacting existing names. On this note, don’t think you can front run the front runners. The brokers, which are Authorized Participants to create the shares for the ETF, will spend the next eight weeks going short and long the expected index changes, largely excluding any outside parties from getting a piece of the trade. Speculators who show up to trade on the rebalance date likely won’t get the price they expect. So over the next eight weeks, we may see some market impact from the pre-rebalance of the index, but keep in mind the GDXJ ETF is about suppling beta to investors. They need the most liquid names to deal in, but this will be a great opportunity to pick up some small-capitalization, high-quality growth names that deliver alpha to investors.
Threats
- The threat of a government shutdown is looming. Government funding expires on April 28, reports Bloomberg, giving Congress five days to “unveil, debate and pass an enormous spending bill, or trigger a government shutdown.” Paul Brace, a congressional expert at Rice University, is even quoted as saying: “It was so much easier when all you had to do was oppose Obama.” There is an exception, the article continues, with a bipartisan group of lawmakers who have been quietly negotiating an omnibus spending bill that would fund the government through the end of the fiscal year on September 30. The border wall decision remains a wild card if it’s included in the budget.
- Although the bond market seems to be focused on what will happen once the Fed whittles down its investments in U.S. government bonds, perhaps more attention should be paid to an even bigger debt pile that could draw buyers away from Treasuries at just the wrong time, writes Bloomberg. “In overseas markets, more than $3 trillion of negative-yielding government bonds—which all but guarantee losses for buy-and-hold investors—have turned positive in recent months,” the article continues. Consequences for the U.S. bond market could be great, as foreigners who previously poured lots of money into higher-yielding Treasuries may be less inclined to do so now that they have “more viable fixed-income options at home.”
- Goldman Sachs maintains its overweight recommendation on commodities but sees a short-term decline for gold, reports Bloomberg. The bank sees the yellow metal falling to $1,200 an ounce in three months, on improvement in hard U.S. growth data and subsequent increases in real rates. Similarly, BMI Research says that the Fed’s rhetoric on balance sheet contraction, together with a stronger dollar, and declining credit growth and inflation expectations, are negative for gold.


Over the last year we transitioned from the stock market angst of 2015 to the bullish breakout of 2016. For NFTRH, the real proof in the pudding was the ramp up in the cyclical Semiconductor sector’s Equipment sub-segment (Applied Materials, Lam Research and the like). Specifically, we tracked a trend in Equipment orders and projected a bullish Semi sector a year ago. The logical extension of this was a bullish stock market, since the Semis are a leader.
What a difference a year makes....Always looking ahead, and only looking behind for frames of reference, we see that some macro signals are shifting beneath conventional market participants’ feet.

Stock Trading Alert originally sent to subscribers on April 17, 2017, 6:56 AM.
Briefly: In our opinion, speculative short positions are favored (with stop-loss at 2,410, and profit target at 2,200, S&P 500 index).
Our intraday outlook is bearish, and our short-term outlook is bearish. Our medium-term outlook remains neutral, following S&P 500 index breakout above last year’s all-time high:
Intraday outlook (next 24 hours): bearish
Short-term outlook (next 1-2 weeks): bearish
Medium-term outlook (next 1-3 months): neutral
Long-term outlook (next year): neutral
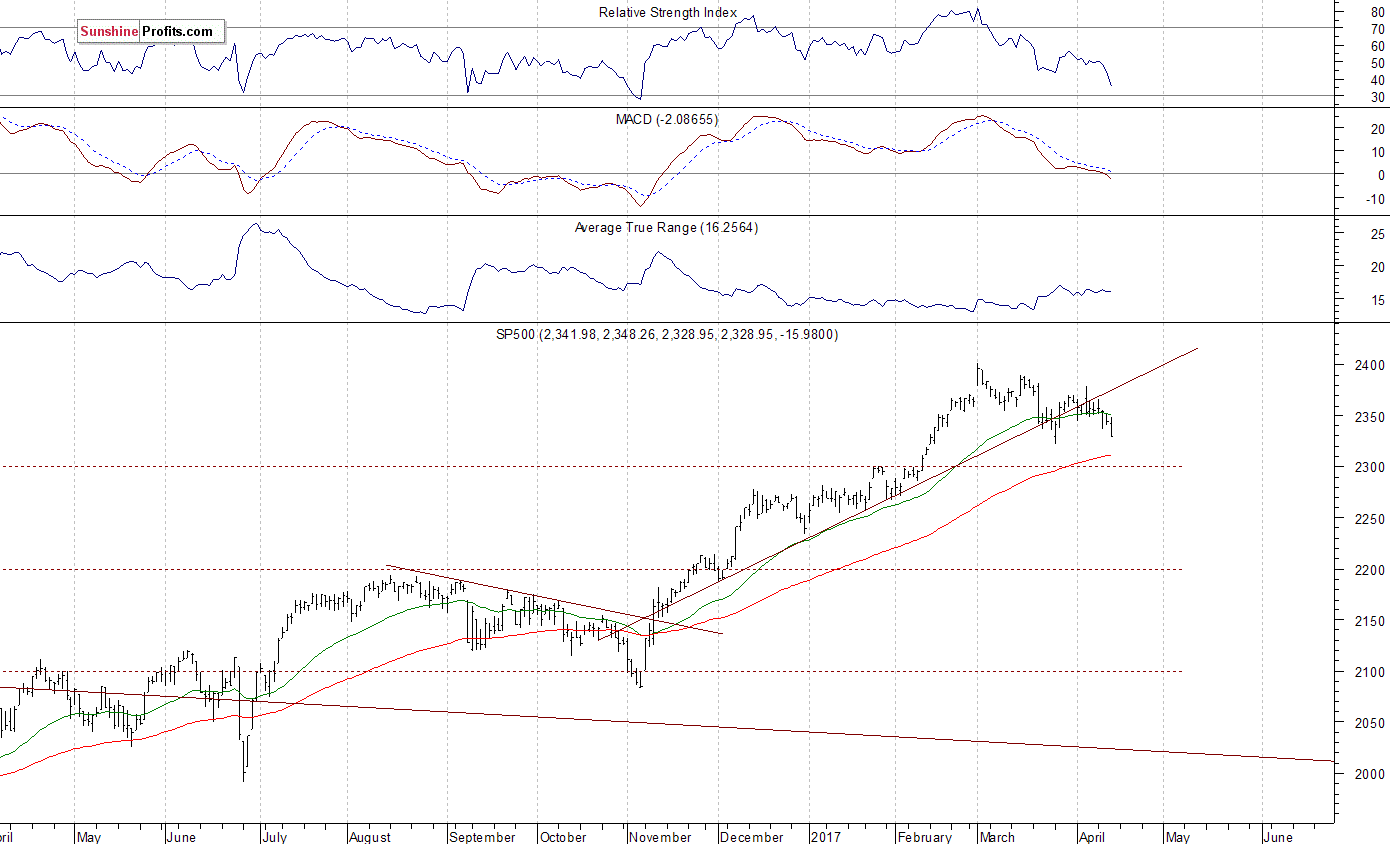
The U.S. stock market indexes lost between 0.4% and 0.7% on Friday, extending their short-term downtrend, as investors reacted to economic data releases, global politics news. The S&P 500 index got close to its late March local low above 2,320 mark. It is now around 3% below its March 1 all-time high of 2,400.98. Is this a new downtrend or just relatively shallow downward correction before another medium-term leg up? The Dow Jones Industrial Average closed below the level of 20,500, and the relatively stronger technology Nasdaq Composite index closed at around 5,800 mark, following its last April 17 move to new record high. The nearest important level of support of the S&P 500 index is at around 2,300-2,320, marked by previous short-term consolidation, among others. The next support level is at 2,270-2,280. The support level is also at around 2,250. On the other hand, the nearest important level of resistance is now at 2,350, marked by some recent local highs. The next resistance level is at 2,370-2,380, marked by the early April local highs. The resistance level is at also at around 2,400, marked by record high. We can see some short-term volatility following five-month-long rally off last year’s November low at around 2,100. Is this a topping pattern before medium-term downward reversal? The uptrend accelerated on March 1 and it looked like a blow-off top pattern accompanied by some buying frenzy. The S&P 500 index is currently trading below its medium-term upward trend line, as we can see on the daily chart:
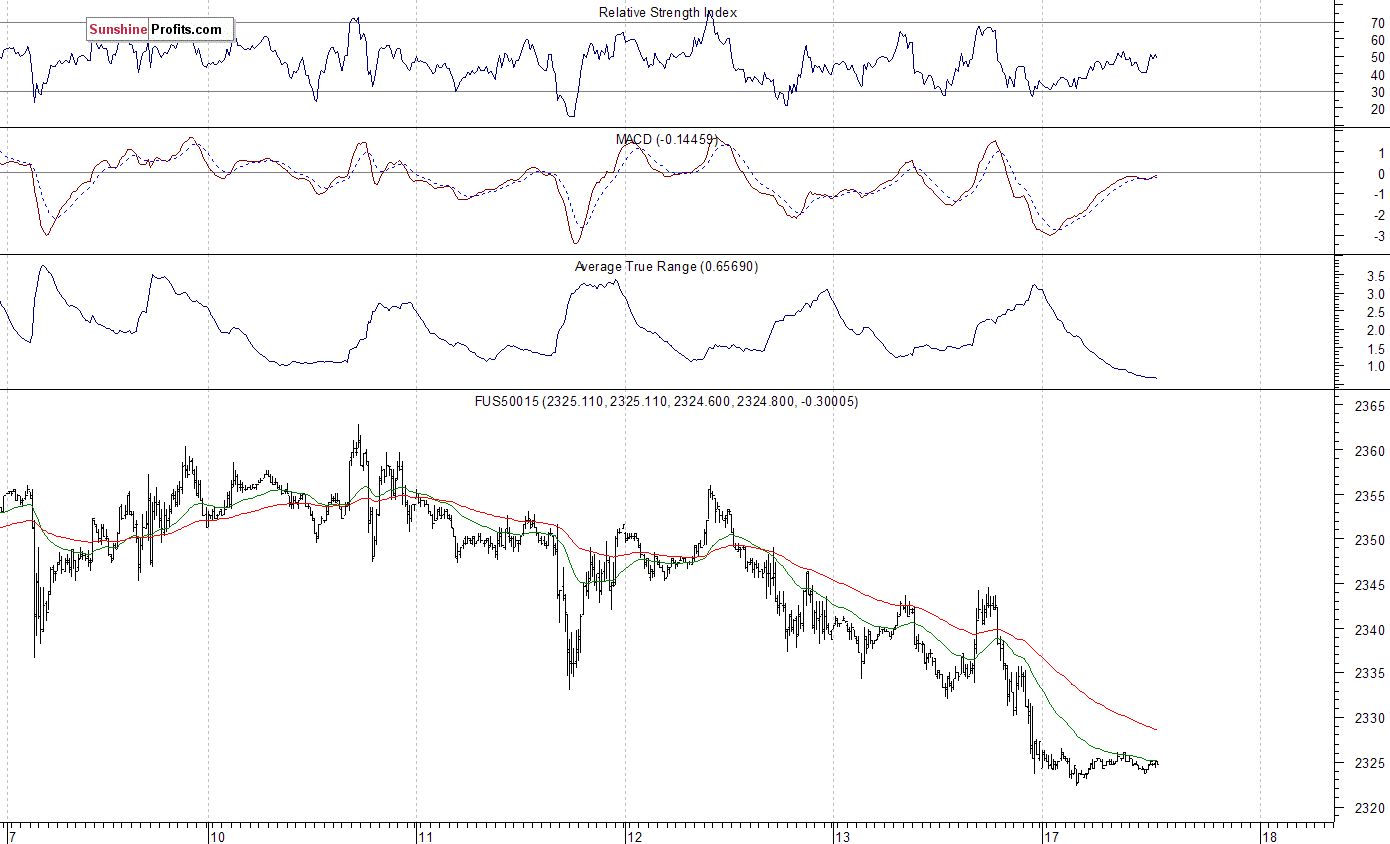
Expectations before the opening of today’s trading session are virtually flat, with index futures currently down 0.1%. The European stock markets are closed today. Investors will now wait for some economic data announcements: Empire Manufacturing number at 8:30 a.m., NAHB Housing Market Index at 10:00 a.m. The market expects that the Empire Manufacturing was at 13.0 in April. The S&P 500 futures contract trades within an intraday consolidation following Friday’s move down. The nearest important support level is at 2,320, marked by short-term consolidation. The next level of support is at around 2,300. On the other hand, the nearest important level of resistance is at around 2,330-2,340, marked by previous local lows. The next resistance level is at 2,345-2,355, marked by recent consolidation. The resistance level is also at 2,370-2,375, marked by the early April local high. The market trades within a short-term downtrend. Will it extend its move down? Or is this some short-term bottoming pattern before an upward reversal?
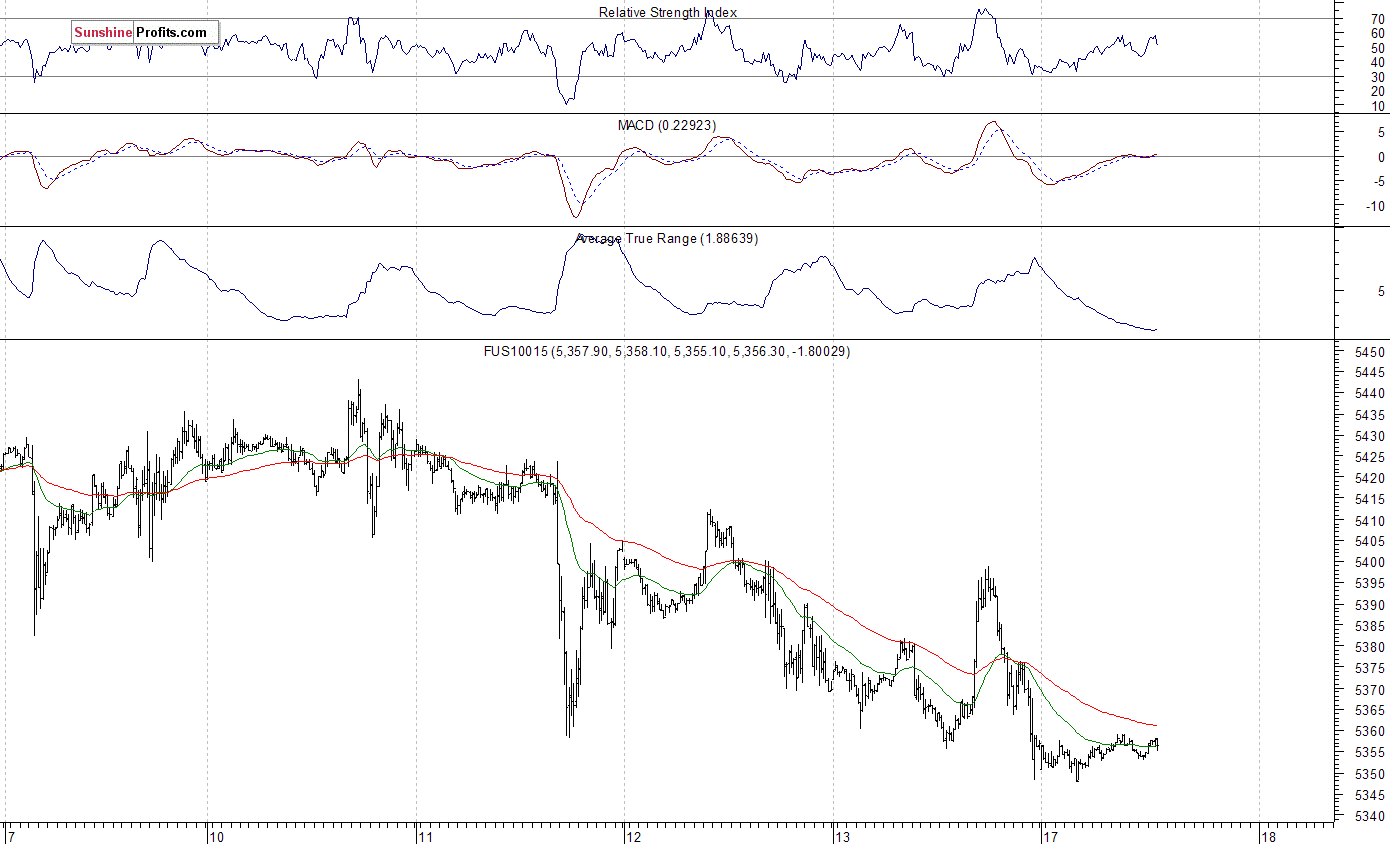
The technology Nasdaq 100 futures contract follows a similar path, as it currently trades within an intraday consolidation after its Friday’s decline of 0.4%. The nearest important support level is at around 5,350, marked by local lows. On the other hand, resistance level is at 5,380-5,400, marked by recent support level, The next resistance level is at 5,420-5,440, marked by short-term consolidation, as the 15-minute chart shows:
Concluding, the S&P 500 index continued its short-term downtrend on Friday, as it got closer to the late March local low. Is this a new downtrend or just downward correction? The broad stock market remains within an over-month-long consolidation following November-March rally. The index is currently trading below five-month-long medium-term upward trend line. There have been no confirmed short-term positive signals so far. However, we still can see medium-term negative technical divergences. Therefore, we continue to maintain our speculative short position (opened on February 15 at 2,335.58 – opening price of the S&P 500 index). Stop-loss level is at 2,410 and potential profit target is at 2,200 (S&P 500 index). You can trade S&P 500 index using futures contracts (S&P 500 futures contract – SP, E-mini S&P 500 futures contract – ES) or an ETF like the SPDR S&P 500 ETF – SPY. It is always important to set some exit price level in case some events cause the price to move in the unlikely direction. Having safety measures in place helps limit potential losses while letting the gains grow.
To summarize: short position in S&P 500 index is justified from the risk/reward perspective with the following entry prices, stop-loss orders and profit target price levels:
S&P 500 index – short position: profit target level: 2,200; stop-loss level: 2,410
S&P 500 futures contract (June) – short position: profit target level: 2,197; stop-loss level: 2,407
SPY ETF (SPDR S&P 500, not leveraged) – short position: profit target level: $220; stop-loss level: $241
SDS ETF (ProShares UltraShort S&P500, leveraged: -2x) – long position: profit target level: $15.47; stop-loss level: $12.98
Thank you.
Paul Rejczak
Stock Trading Strategist


Perspective
The key line is about banks pulling back and “new players with looser lending are stepping in”. This reminds of the culmination of the 1772 Bubble. The Ayr Bank was newly formed and became an aggressive lender in the final stages of that mania. The partners were out to show the older banks what the world of new finance was all about. The collapse ruined most of its investors and became a subject in Adam Smith’s book, The Wealth of Nations. An inquiry completed in 1777 listed some reasons for the failure. One was “giving credit too easily”.
As with most great bubbles, that one climaxed in June and then the contraction started. As usual, the panic got underway in late September and cleared in November. The post-bubble contraction ran the usual twenty years.
For new readers, the great bubbles completed in 1720, 1772, 1825, 1873, 1929 and 2007. All had common characteristics and consequences.
And Papua New Guinea—it was only a few decades ago when the national pastime was headhunting. The key concept in the proposed issue is “dollar bonds”, due and payable in New York in dollars.
Stock Markets
For some reason, the song Up Up and Away comes to mind. It was a big hit in 1967 by a group called the Fifth Dimension. The lines include “My beautiful, my beautiful balloon”.
https://www.youtube.com/watch?v=5akEgsZSfhg
That was close to the peak in the stock market as deflated by the CPI. That bear market ran until 1982 when in painfully abandoning “inflation”, the world discovered inflation in financial assets. With some violence, this has continued. But it seems that inflation in Treasuries blew out in July and inflation in junk bonds and equities is in full bubble mode now.
This page had reckoned that whatever was bothering the markets would clear in October. On November 3rd, the ChartWorks noted a Downside Capitulation on the S&P.
We began to describe the rally as “Rational Exuberance”, due to a pro-business administration and thought it could run into March.
Considering the developing technical excesses in February, we dropped “Rational” and just called it “Exuberance”.
Two weeks ago, we noted that industrial commodities could be firm into April-May, which would help credit spreads and equities.
Also with dropping “Rational” we noted that a Big Rounding Top was possible.
A recent discovery has been that low-grade stuff such as HYG would soar up to a Daily RSI and the stock market would peak some three weeks later. The key examples were 2000 and in 2007. At a lower level, the link worked on the rebound to May 2008.
The RSI reached 77 on February 27 and the S&P set a pop-up high at 2400 on March 1st. The next high was 2390 in the middle of the month. Close enough to consider that this “model” could be effective.
As a wrap to the potential rollover, NYSE Margin has been going straight up. The report is always a month behind, but the first downtick with a MACD Sell could conclude that the bull market is over.
Within the senior indexes, some individual stocks are clocking technical excess. Last week we mentioned some names that were standing out. This week, we can add Amazon, which has accomplished super technical excesses (Chart follows).
The way to wrap this up, is that there is a seasonal positive into May. But if the S&P, base metals and HYG slip below their 50-Day moving averages it says that the party is getting tired.
The nature of the party has been intriguing. Following the natural rise in market rates of interest, the Fed has been forced to increase its rate – in a not-strong economy. In becoming speculative, the boom in financial assets has been forcing short rates up since June. Makes sense to us. Especially when we keep in mind that rising quality short rates, such as T-Bills, indicate the boom is on. When shorted-dated market rates of interest decline it indicates the party is ending.
And the conduit of this kind of a boom has been banks and financials. Particularly, the Broker-Dealers which highs have led the highs in the senior indexes. The index is at 210, and the 20-Week ema is at 209.9. Taking it out would be significant. The chart follows.
By way of a wrap for this sector, there is the usual positive seasonal going into May when a speculative market can expire. Often this relates to a key reversal in credit spreads and the yield curve. This has become an exciting stock market that has pushed technical and sentiment measures to exceptional readings. Like a tattoo, these are indelible and it is worth recalling that the tattoo machine does not have an eraser.
At this season of the year, how does Mother Nature treat such excesses?
By a significant liquidation of unsupportable positions.
Funds may be holding investment-grade stocks, but market forces have driven them to speculative prices.
In the past, after such seasonal excesses Mother Nature has arranged for seasonal lows in the fall.
Credit Markets
The long bond (TLT) rallied to 121.87 at the first of the month. This is the fourth attempt to get through 122. This could trade around the 120 level for some weeks. There is support at the 50-Day ma at 119.50. Getting through 122 is possible, but it could take into June.
Two weeks ago, we noted that lower-grade stuff (JNK) could recover for a while. The swing on the Daily RSI from overbought to oversold was impressive.
There is support at the 50-Day ma at the 87 level. It could get to 88, but we are concerned that after June low-grade bonds could turn down.
With a rally possible in TLT, this could move spreads to widening.
Subprime Lending

Of course, so far negative equity hasn’t been a problem for car buyers because lenders have been all too willing to roll those debt balances into new loans. And, courtesy of low rates and stretched out terms, consumers haven’t really cared that their debt balance are ballooning so long as their monthly pymnts remain low.
Source: Morgan Stanley, Zero Hedge
Auto Subprime Default Rates

Source: UBS
- The current cycle of failures is rising faster than in 2008.
Valuation
- Approaching 2 standard deviations beyond the mean.
- Not seen since the bubble that climaxed in March 2000.

Amazon
Huge Upside Exhaustion and Sequential Sell

- The readings are in Hourly, Daily, Weekly and Monthly.
- One dimension above a “Trifecta Sell”.
Broker-Dealers (XBD)

- Sequential (9) Sells have preceded important highs.
- Highs for Broker-Dealers can precede the peak for the senior indexes.
Listen to the Bob Hoye Podcast every Friday afternoon at TalkDigitalNetwork.com


-
I know Mike is a very solid investor and respect his opinions very much. So if he says pay attention to this or that - I will.
~ Dale G.
-
I've started managing my own investments so view Michael's site as a one-stop shop from which to get information and perspectives.
~ Dave E.
-
Michael offers easy reading, honest, common sense information that anyone can use in a practical manner.
~ der_al.
-
A sane voice in a scrambled investment world.
~ Ed R.
Inside Edge Pro Contributors

Greg Weldon

Josef Schachter

Tyler Bollhorn

Ryan Irvine

Paul Beattie

Martin Straith

Patrick Ceresna

Mark Leibovit

James Thorne

Victor Adair