
Energy & Commodities
 Investing.com – Crude prices gave up some of the early gains in Asia on Monday with tensions on the Korean peninsula in focus along with the fallout from a missile strike by U.S. forces last week on a Syrian airbase that drew a sharp rebuke from major oil producers Iran and Russia.
On the ICE Futures Exchange in London, Brent oil for June delivery wrose 0.14% to $55.32 a barrel. Elsewhere, the U.S. West Texas Intermediate crude May contract rose 0.25% to $52.37 a barrel.
Last week, oil futures settled higher for the fourth session in a row on Friday, extending a rally to the strongest level in around a month after two U.S. destroyers based in the Eastern Mediterranean fired 59 Tomahawk cruise missiles at a Syrian air base, which the U.S. said was in retaliation to Bashar al-Assad’s alleged use of chemical weapons against his own people.
Oil pared some of the gains later in the session as concerns about a wider escalation in the region faded and U.S. economic data weighed on global markets.
But analysts said the initial knee-jerk reaction to the airstrike may have been overdone given Syria’s role as a very minor oil producer and after U.S. officials described the attack as a one-off event that would not lead to wider escalation.
Meanwhile, oil traders continued to focus on the ongoing rebound in U.S. shale production, which could derail efforts by other major producers to rebalance global oil supply and demand remained in focus.
Oilfield services provider Baker Hughes said late Friday that the number of active U.S. rigs drilling for oil rose by 10 last week, the 12th weekly increase in a row. That brought the total count to 672, the most since September 2015.
Earlier in the week, the U.S. Energy Information Administration said that crude oilinventories increased by 1.57 million barrels to yet another all-time high of 535.5 million.
It was the 13th weekly build in U.S. stockpiles in the past 15 weeks, feeding concerns about a global glut.
Market participants, however, remained optimistic that OPEC would extend its current deal with non-OPEC producers to cut output beyond June in an effort to rebalance the market. In November last year, OPEC and other producers, including Russia agreed to cut output by about 1.8 million barrels per day between January and June.
A joint committee of ministers from OPEC and non-OPEC oil producers will meet in late April to present its recommendation on the fate of the pact. A final decision on whether or not to extend the deal beyond June will be taken by the oil cartel on May 25.
Investors will keep an eye out for monthly reports from the Organization of Petroleum Exporting Counties and the International Energy Agency to gauge global supply and demand levels.

Market Outlook
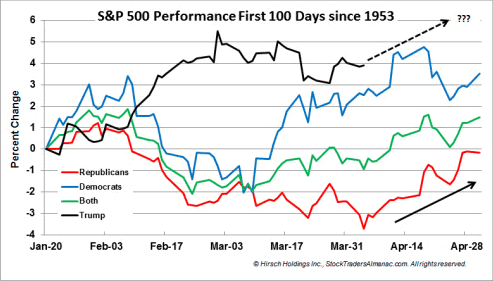
Jeff Hirsch in the Almanac Trader updated the S&P 500 Performance during the First 100 Days of new administrations since 1953 in a post titled “February Weakness Stolen, March Stolen Thunder.” Looking at the chart below March was indeed a dud. Instead of a respectable rally, S&P 500 fell 0.04% in March. It has been 78 calendar days since President Trump took office and S&P 500 has gained 3.9% which is still above historical average. Historically, March was a flat month for new Republican administrations (solid red line in chart below), but that weakness ended on average in early April and the S&P 500 rallied nearly 4% by the end of the month (black arrow). A similar result this year would put S&P 500 off this chart by the end of the month. Recently we pointed out April marks the end of what is historically the best six months for DJIA and the S&P 500. Since 2006, April has been up eleven years in a row with an average gain of 2.6% to reclaim its position as the best DJIA month since 1950. April is second best for S&P and fourth best for NASDAQ (since 1971).
The CBOE Volatility Index (VIX) is known as the market’s “fear gauge” because it tracks the expected volatility priced into short-term S&P 500 Index options. When stocks stumble, the uptick in volatility and the demand for index put options tends to drive up the price of options premiums and sends the VIX higher. Recently we pointed out “…as equity prices have faltered a bit the past few weeks’ investors are starting to show signs of nervousness by driving the VIX higher…” As evidenced in the updated chart below this trend continues as investors are becoming concerned about the White House fiscal agenda and increasing global restlessness.

The American Association of Individual Investors (AAII) Sentiment Survey measures the percentage of individual investors who are bullish, bearish, and neutral on the stock market for the next six months; individuals are polled from the ranks of the AAII membership on a weekly basis. The current survey result is for the week ending 04/06/2017. Pessimism among individual investors about the short-term direction of stock prices rose to nearly 40%, according to the latest AAII Sentiment Survey. Bearish sentiment, expectations that stock prices will fall over the next six months, rose 2.2 percentage points to 39.6%. The increase keeps pessimism at or above its historical average of 30.5% for the eighth consecutive week and the 11th out of the last 12 weeks. At the same time, optimism fell below 30%. Bullish sentiment, expectations that stock prices will rise over the next six months, fell 1.9 percentage points to 28.3%. This is the 11th time out of the last 12 weeks that optimism is at or below its historical average of 38.5%. This week’s results put optimism very close to the bottom of its typical range and pessimism very close to the top of its typical range. A bullish sentiment reading below 28.1% would be unusually low (more than one standard deviation below average.) A bearish sentiment reading above 40.0% would be unusually high (more than one standard deviation above average). Of the two, unusually low bullish sentiment readings have a much stronger record as a contrarian indicator, with the S&P 500 realizing a median gain of 6.3% over the following six-month periods. Neutral sentiment, expectations that stock prices will stay essentially unchanged over the next six months, declined 0.3 percentage points to 32.1%. The historical average is 31.0%.

The National Association of Active Investment Managers (NAAIM) Exposure Indexrepresents the average exposure to US Equity markets reported by NAAIM members. The blue bars depict a two-week moving average of the NAAIM managers’ responses. As the name indicates, the NAAIM Exposure Index provides insight into the actual adjustments active risk managers have made to client accounts over the past two weeks. The current survey result is for the week ending 04/05/2017. First-quarter NAAIM exposure index averaged 92.85%. Last week the NAAIM exposure index was 68.95 %, and the current week’s exposure is 67.47%. Money managers are holding on waiting for some strong economic data before bidding equity prices higher. The good news is the institutional investors are refusing a wholesale selloff despite opportunities to do so. Volatility is creeping higher, but strong quarterly earnings reports or perceived progress on some of the proposed tax cut related legislation out of Washington could ignite investors to rotate money back into equities driving the NAAIM Exposure Index higher.

Trading Strategy
A recent American Association of Individual Investor (AAII) survey how the potential impact that President Trump could have on the domestic and global economy continues to cause uncertainty or concern among some investors, while encouraging others. They indicated the prevailing level of valuations and the lack of downside volatility have increased concern about the potential for a forthcoming drop in stock prices. The AAII asked members to explain how the success or failure of the Trump administration’s proposed policies influence their outlook for stock prices. Responses were mixed. Nearly one out of four respondents (24%) think the president’s policies will have a positive impact, particularly those policies that go beyond health care (tax reform, deregulation, etc.). Conversely, nearly 22% think Washington politics could have a negative impact on the market either by allowing his proposals to move forward or by having the proposals snagged in gridlock or otherwise not passed. An additional 11% say President Trump is causing them to be more cautious, with some of these respondents describing him as being too unpredictable. About 19% say the president is not influencing or otherwise factoring into their outlook. Some of these respondents described his rhetoric as just being noise, while others say they are more focused on fundamental factors. Fewer than 8% say that it is still too early to tell what impact the administration’s policies will have on the market. And last week we mentioned how “…Much of the market momentum since Election Day has been due to hopes that a new administration would enact policies favorable to the corporate environment and spur economic growth…” Our recently analysis is still in play where we said “…uncertainty among traders – they are not willing to sell off equities, but not quite ready to commit to bidding prices higher. Also there is some sector rotation going which usually happens after a quarterly close and investors are waiting to see what earnings season looks like. In the current trading environment market neutral and short term directional trades have been profitable for us…”Of particular note in the current chart below is that S&P Financial sector stocks crashing over concerns about the timing of future rate cuts.


Alert originally sent to subscribers on April 10, 2017, 6:57 AM.
Briefly: In our opinion, speculative short positions are favored (with stop-loss at 2,410, and profit target at 2,200, S&P 500 index).
Our intraday outlook is bearish, and our short-term outlook is bearish. Our medium-term outlook remains neutral, following S&P 500 index breakout above last year’s all-time high:
Intraday outlook (next 24 hours): bearish
Short-term outlook (next 1-2 weeks): bearish
Medium-term outlook (next 1-3 months): neutral
Long-term outlook (next year): neutral
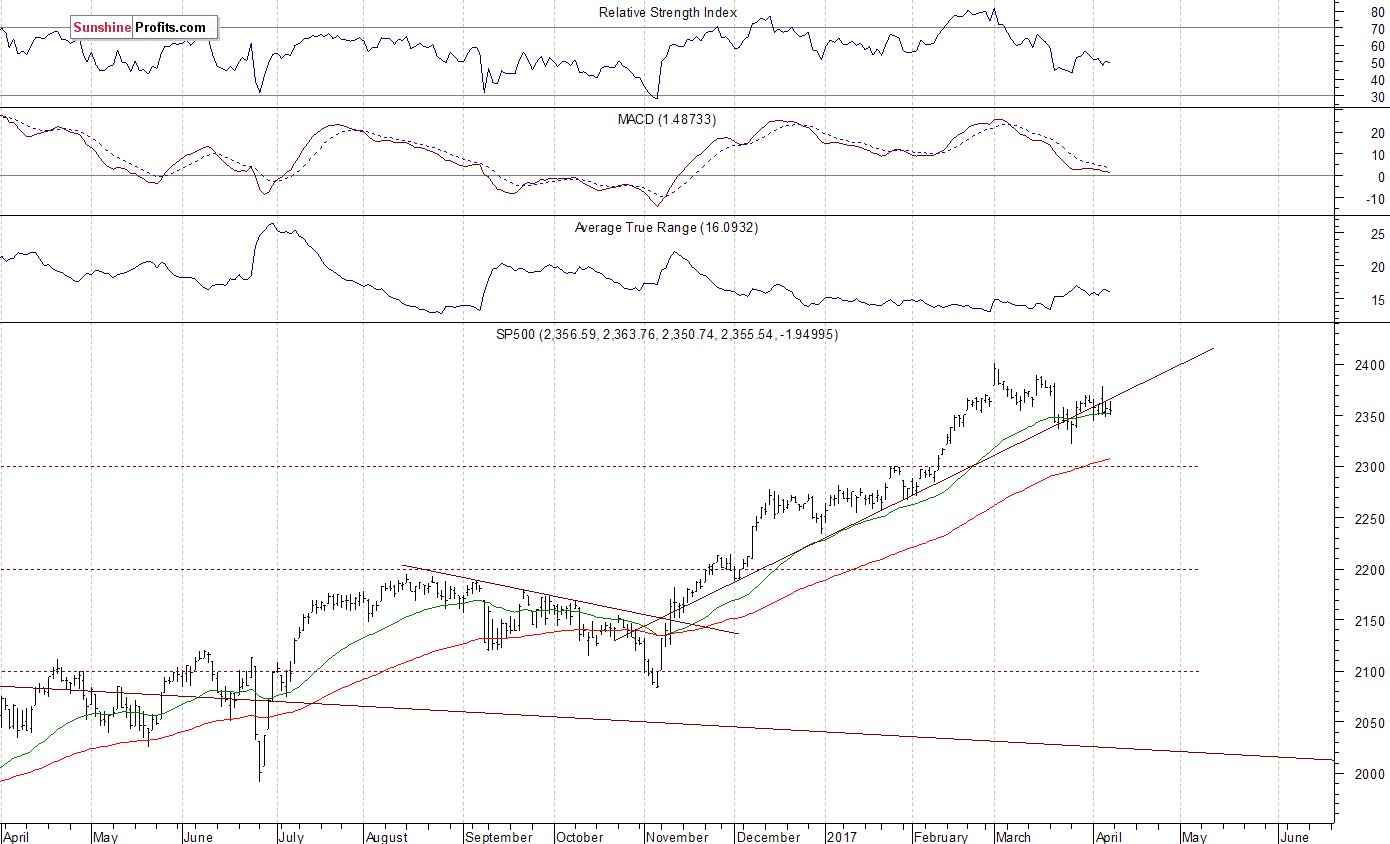
The U.S. stock market indexes were virtually flat on Friday, as they lost 0.02-0.08%, following worse-than-expected monthly jobs report release. The S&P 500 index continued to fluctuate within its two-week-long short-term consolidation along the level of 2,350. The index remained around 2% below March 1 all-time high of 2,400.98. Is this a new downtrend or just relatively shallow downward correction before another medium-term leg up? The Dow Jones Industrial Average closed below 20,700 mark again, and technology Nasdaq Composite index remained below 5,900, following its last week’s Wednesday’s move to new record high. The nearest important level of support of the S&P 500 index is at around 2,350, marked by local lows. The next support level is at 2,335-2,340, marked by some previous local lows. The support level is also at 2,320, marked by February 13 daily gap up of 2,319.23-2,321.42, among others. On the other hand, the nearest important level of resistance is now at 2,370, marked by short-term local highs. The next resistance level is at 2,380-2,400, marked by all-time high, among others. We can see some short-term volatility following five-month-long rally off last year’s November low at around 2,100. Is this a topping pattern before downward reversal? The uptrend accelerated on March 1 and it looked like a blow-off top pattern accompanied by some buying frenzy. The S&P 500 index continues to trade along its medium-term upward trend line, as we can see on the daily chart:
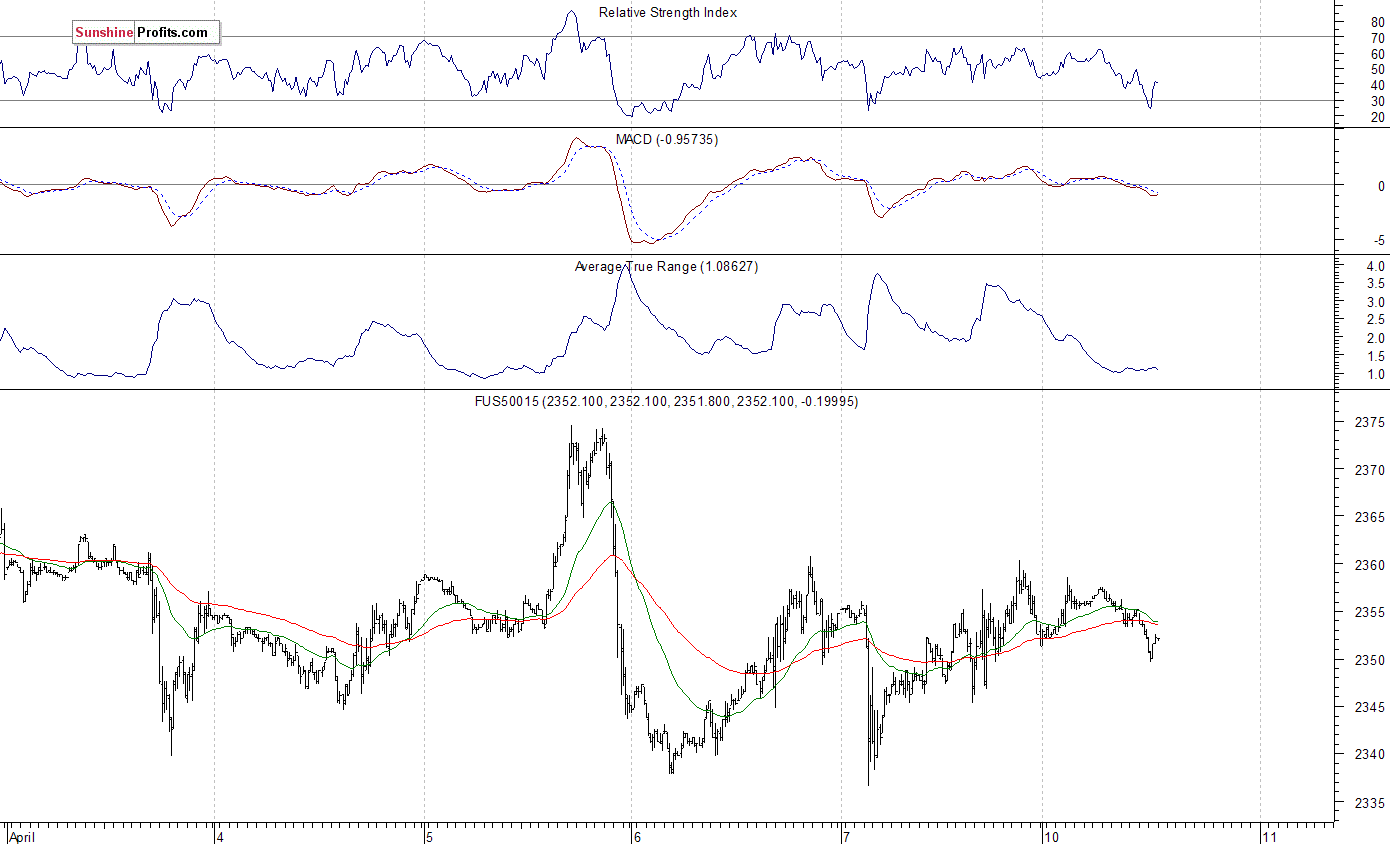
Expectations before the opening of today’s trading session are virtually flat, with index futures currently between -0.01% and +0.01%. The European stock market indexes have lost 0.2-0.6% so far. The S&P 500 futures contract trades within an intraday downtrend, as it retraces some of its Friday’s rebound off support level at 2,345-2,350. The next important level of support is at around 2,335-2,340, marked by recent local low. On the other hand, the nearest important level of resistance is at 2,360, marked by late last week’s local highs. The next resistance level is at 2,370-2,375, marked by last week’s local high. The resistance level is also at around 2,400, marked by the early March record high. The market continues to trade within a short-term consolidation. Is this some medium-term topping pattern or just flat correction before another leg higher?
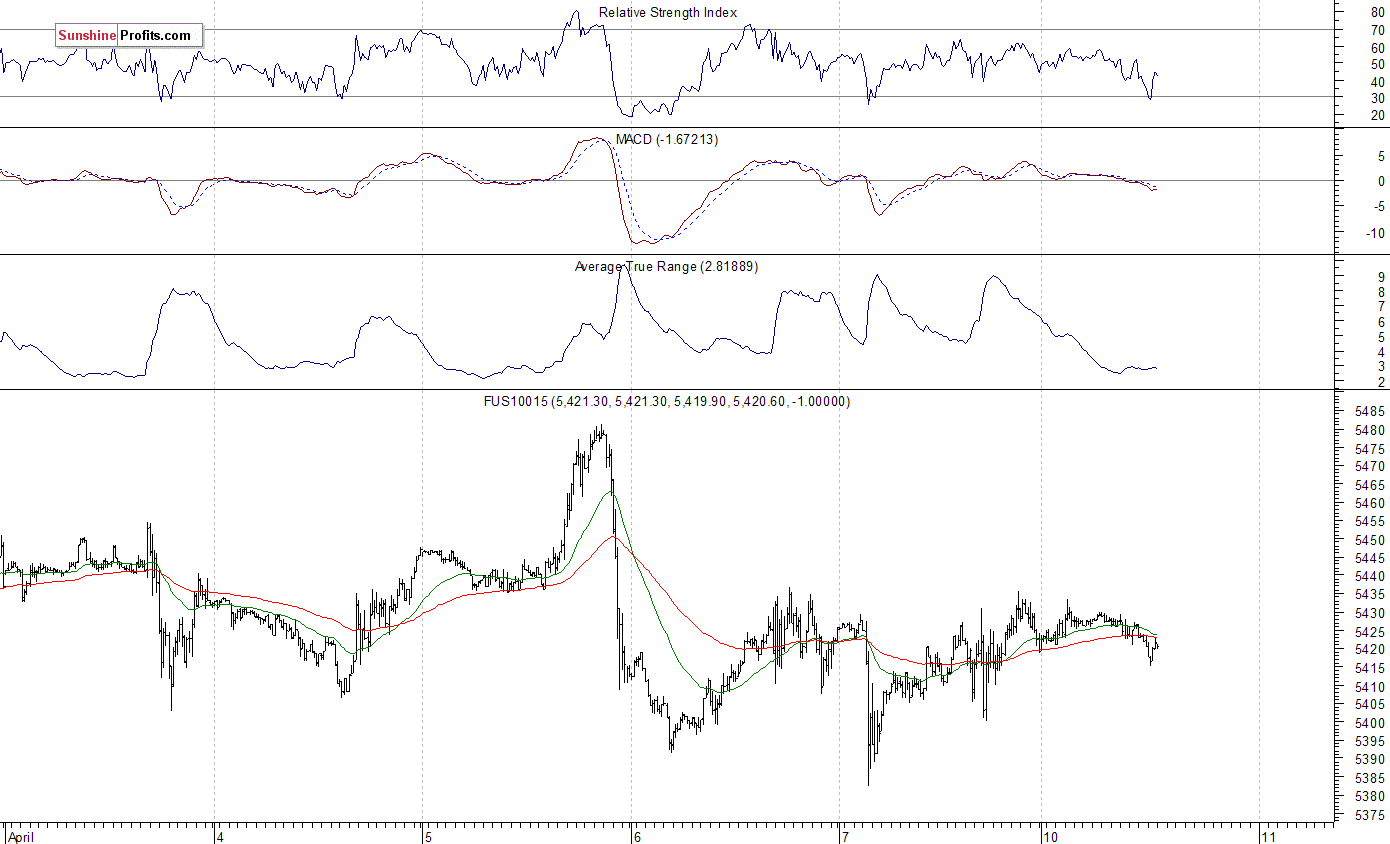
The technology Nasdaq 100 futures contract remains relatively stronger than the broad stock market, as it continues to trade above the level of 5,400. It has reached new all-time high above the level of 5,480 on last Wednesday. The nearest important level of resistance is at around 5,440-5,450, and the next resistance level is at 5,480-5,500. On the other hand, support level is at 5,380-5,400, marked by short-term local lows, as the 15-minute chart shows:
Concluding, the S&P 500 index extended its short-term consolidation on Friday, following the important monthly jobs report release. The market continues to fluctuate following late March rebound off support level. Is this a new uptrend or just upward correction within a downtrend off March 1 all-time high? The broad stock market remains close to its five-month-long medium-term upward trend line. There have been no confirmed short-term positive signals so far. However, we still can see medium-term overbought conditions along with negative technical divergences. Therefore, we continue to maintain our speculative short position (opened on February 15 at 2,335.58 – opening price of the S&P 500 index). Stop-loss level is at 2,410 and potential profit target is at 2,200 (S&P 500 index). You can trade S&P 500 index using futures contracts (S&P 500 futures contract – SP, E-mini S&P 500 futures contract – ES) or an ETF like the SPDR S&P 500 ETF – SPY. It is always important to set some exit price level in case some events cause the price to move in the unlikely direction. Having safety measures in place helps limit potential losses while letting the gains grow.
To summarize: short position in S&P 500 index is justified from the risk/reward perspective with the following entry prices, stop-loss orders and profit target price levels:
S&P 500 index – short position: profit target level: 2,200; stop-loss level: 2,410
S&P 500 futures contract (June) – short position: profit target level: 2,197; stop-loss level: 2,407
SPY ETF (SPDR S&P 500, not leveraged) – short position: profit target level: $220; stop-loss level: $241
SDS ETF (ProShares UltraShort S&P500, leveraged: -2x) – long position: profit target level: $15.47; stop-loss level: $12.98
Thank you.
Paul Rejczak
Stock Trading Strategist
Portfolio manager Dr. James Thorne has a unique ability to analyze the big macro global trends and then find specific stocks that will benefit. Michael asks James about his latest assessments.
…also Mike’s Weekend Editorial: A Stick in the Eye at Tax Time


 1. “You Won’t Believe What Our Top Oil Analyst Says Is Coming Next”
by Michael Campbell & Josef Schachter
Josef Schacter called oil decline from over $100. Then called the recovery and made our listeners and World Outlook Conference attendees big money. What til you hear what’s coming next.
2. Reassessing the Role of Precious Metals as Safe Havens
Last month, a new scientific paper about the precious metals was published. What can we learn from it?
3. Soaring Global Debt Sets Stage For ‘Unprecedented Private Deleveraging’
These numbers are astounding. Emerging market debt was $7.4 trillion in 1996, and today it’s $55 trillion. US and UK government debt has doubled – from already historically-high levels — since 2006.
And there’s no end in sight.


-
I know Mike is a very solid investor and respect his opinions very much. So if he says pay attention to this or that - I will.
~ Dale G.
-
I've started managing my own investments so view Michael's site as a one-stop shop from which to get information and perspectives.
~ Dave E.
-
Michael offers easy reading, honest, common sense information that anyone can use in a practical manner.
~ der_al.
-
A sane voice in a scrambled investment world.
~ Ed R.
Inside Edge Pro Contributors

Greg Weldon

Josef Schachter

Tyler Bollhorn

Ryan Irvine

Paul Beattie

Martin Straith

Patrick Ceresna

Mark Leibovit

James Thorne

Victor Adair