
Personal Finance
Key Points in Faber’s Worldwide Debt Bubble & Currency Collapse Interview:
– Ahead: a crisis worse than 2008 @ 0:54
– Young adults will earn less than their parents and die with less than their parents @ 2:56
– How to weather the hard times ahead @ 7:41
– How much gold is enough? @ 11:01
– What form of precious metals is best? @ 13:27
– Ed Note: This interview was done in 2016


Gold performed really well in the first quarter of 2017. As the chart below shows, the rally started at the end of December 2016. The yellow metal bottomed at $1,125.7 on December 20, just a few days after the FOMC meeting and the second interest rate hike for almost a decade. Since then, the shiny metal gained about 11 percent.
Chart 1: The price of gold in U.S. dollars in 2017 (London P.M. Fix).

As one can see below, the price of gold expressed in euros and British pounds developed in a similar way to the U.S. dollar-denominated price. However, on a relative basis, the price of gold gained more in the greenback than in these two currencies (the bullion gained about 7 percent in euros and almost 11 percent in the British pound since the December lows), which seems to reflect an appreciation of the common currency against the U.S. dollar.
Chart 2: The price of gold in the U.S. dollar (yellow line), the euro (red line) and the British pound (green line) in 2017 (London P.M. Fix).

Indeed, the greenback was one of the main drivers of the gold prices in the third quarter of 2017. As usual, there was a strong negative correlation between these two safe-haven assets, as the chart below shows.
Chart 3: The price of gold (yellow line, left axis, P.M. London Fix) and the U.S. dollar index (red line, right axis, Trade Weighted Broad U.S. Dollar Index) in 2017.

After the December Fed hike the U.S. dollar surged while the price of gold bottomed out. However, as investors called the Fed hawkishness into question, the greenback declined, while the yellow metal shined. Other important drivers of the gold rally and dollar weakness were uncertainty about Trump’s policies and comments from Treasury Secretary Steve Mnuchin that the American currency is too strong. In March, gold went south, while the greenback jumped, anticipating the next hike at the FOMC meeting. Indeed, we saw a classic “sell the rumor, buy the fact” scenario in the gold market (with a “buy the rumor, sell the fact” scenario in the U.S. dollar), as the expectations surrounding a rate hike were actually much worse than the actual hike.
Now, the key question is what’s next for the yellow metal. Given the strong relationship with the greenback, the issue boils down to the outlook for the U.S. currency. Well, we believe that the medium-term trend in the greenback is higher, despite the pullback in the first quarter of 2017. As one can see in the chart below, the U.S. dollar has been in an upward trend since 2014. We have also seen an uptick in the real interest rates since the mid-2016.
Chart 4: The U.S. real interest rates (red line, right axis, yields on 10-year Treasury Inflation-Indexed Security) and the U.S. dollar index (green line, left axis, Trade Weighted Major U.S. Dollar Index) over the last five years.

The dollar simply has stronger fundamentals than its major rivals. The U.S. economy should still develop faster than Europe’s (or Japan’s). And the Fed is likely to continue its much more hawkish policy than the ECB(or the BoJ). Consequently, the yield differential between the dollar and the euro should continue to widen, supporting the U.S. dollar. Hence, the greenback continues to be the prettiest of the ugly sisters, offering higher and growing yield.
It’s true that the euro gained after the Mario Draghi’s hawkish comments in March. However, the euro should remain in its long-term downward trend, at least until the ECB ends the quantitative easing and starts hiking interest rates. It would be a long road towards normalization of rates – as a reminder, the Fed started its hikes after the asset purchases were first tapered and finally completed. And the elections in France and Germany are big headwinds for the common currency, as investors are likely to sell the euro, preparing for the worst. Of course, there will be ups and downs, but the Euro area (and its currency) is simply more fragile and less resilient to negative shocks than the U.S.
To sum up, in 2017 the price of gold has risen about 9 percent. Although there was a pullback in the greenback and the real interest rates in the first quarter of the year, we believe that the dollar bull market will remain intact, at least until investors shift their focus from the U.S. towards the monetary policy in the Eurozone and Japan. By that time, the Fed interest rate hikes should only strengthen the greenback. The appreciation of the U.S. dollar is traditionally bearish for gold. On the other hand, the failure of introducing Trump’s pro-growth and the resulting end of the reflation trend could send the greenback down for a while, supporting the gold price.
Thank you.
Arkadiusz Sieron

Last week, I noted that as long as the S&P500 holds the 2320SPX level, it will begin a rally. On Monday, the market bottomed at 2322SPX, and began a 2% rally.
If one takes the time to become an open-minded market observer, one can learn a lot about the stock market, and how human beings react within the stock market.
We all know and love the phrase “buy low, and sell high.” While that is the ideal goal for investors, most investors are unable to attain their goals of buying the lows or selling the highs. Why is that? It is simply because we are emotional creatures, and we allow our emotions to drive our buying and selling decisions. For that reason, we are fearful to buy when all others around us are fearful as price drops, and we are exuberant and unable to sell when all others around us are euphoric at the highs. When you come to grips with this simple fact, and begin to understand the nature of the market, then you are on your way to becoming a much better investor.
So, back in February of 2016, when everyone was fearful of a stock market crash, we were turning quite bullish. And, we will not likely be turning bearish until the rest of the market turns bullish.
In fact, back in 2015 and going into 2016, I was warning my members at Elliottwavetrader.net that not only are we setting up for a rally which will take us to 2500+ on the SPX, but I was also expecting that the paradigms and correlations many follow would be breaking down.
And, since that time, as the evil emperor in Star Wars noted, “Everything is proceeding as I have foreseen.”
Moreover, it seems that Morgan Stanley has finally taken notice, stating this in early 2017:
“Regional correlations, cross-asset correlations and individual stock and FX correlations have fallen simultaneously. That’s unusual; we haven’t seen a shift this severe in over a decade . . .”
Before the election in November of 2016, I was again preparing the members in our trading room at Elliottwavetrader.net for the next phase of the strong rally I was expecting, which would take us into 2017. And, since that time, it seems the rally has not only taken most market participants by surprise, many still remain within their mindset of disbelief.
However, recently, I am witnessing something quite notable in the stock market. I am starting to see some former bears beginning to embrace this stock market rally. In fact, someone who was fighting this rally tooth and nail for quite some time noted this past week that “the traditional causes of recessions . . . are nowhere on the horizon.”
Those words were music to my ears. And, I am going to expect that more and more bears will be coming over to the dark side. Even Harry Dent, one of the biggest bears in the market for many years, turned bullish in early 2017. Yes, my friends, it seems the long-term topping process has begun. But, we still have a ways to go.
In fact, in Elliott Wave parlance, the point in time when former bears turn bullish begins once we move through the point of recognition, which is the heart of the 3rd wave within Elliott’s 5 wave structure. And, as you can see from the attached “before” and “after” charts, the heart of the 3rd wave, wave (III) of (3), is now done, which is likely why many former bears have begun to turn bullish.
See below two daily SPX charts by Avi, the top one from December 10, 2016 and the bottom from April 3, 2017, indicating how the S&P 500 closely followed his projected 3rd wave path. Click to expand charts


This is quite typical of how the market reacts. Remember, most people do not turn bullish at the lows, but rather, bullishness develops as the market rallies higher and higher, with the most extreme levels of bullishness being evident near major market tops. This is simply how human nature works within the herd, and being able to track market sentiment allows you to rise above it rather than become a part of it.
So, as we set up to head to 2500SPX to complete the 3rd wave in a few months, I certainly expect more bears will join the bullish party. By the time we have completed the 5th wave later this year, or early next year, the market will be proclaiming in unison that “the traditional causes of recessions . . . are nowhere on the horizon.” And, until the majority of the market becomes convinced of the bull market, there will be no correction of which to speak. So, for now, you can keep ignoring all those “crash” calls.
Remember the wise words of Professor Hernan Cortes:
“Financial markets never collapse when things look bad. In fact, quite the contrary is true. Before contractions begin, macroeconomic flows always look fine. That is why the vast majority of economists always proclaim the economy to be in excellent health just before it swoons.”
Along the lines of these “sentiments,” I remember reading this article quite some time ago which outlined the strongly bullish sentiments of market participants and officials right before the Great Depression. I think it is worth a read, as it is exactly what I am going to expect this time around. And, remember what George Santayana said:
“Those who cannot remember the past are condemned to repeat it.”
Price pattern sentiment indications and upcoming expectations
As I have been reiterating for years, the market will likely eclipse the 2500SPX level so that we are able to generate the bullishness needed to mark a long term market top. And, the way we are setting up right now, our first test of the 2500SPX region will likely occur by summer time.
However, it does not necessarily mean we will be taking a direct route. While the market may choose the direct route from here, I still think there is a high probability that we can rally to even a new all-time high before we test the 2300SPX region, and potentially even temporarily break it. That would then set up a strong 200 point rally to the 2500SPX region.
But, I would strongly suggest that you consider using any pullback in the market as a buying opportunity until we hit the 2500SPX region. Once we strike the 2500 region, long term investors can begin to reduce their risk, as we would be nearing the completion of the long-term trend. While there is still potential for another pullback going into the fall of 2017, which can set up one more rally over 2600SPX, I think the risks will have increased to levels not acceptable for most long-term investors once we do strike 2500SPX. And, when you consider that the top we will likely strike in 2017, or early 2018 will set us up to retest the 2100SPX region, it will not likely be worth the risk for most long-term investors.
See charts illustrating the wave counts on the S&P 500.
Avi Gilburt is a widely followed Elliott Wave technical analyst and author of ElliottWaveTrader.net (www.elliottwavetrader.net), a live Trading Room featuring his intraday market analysis (including emini S&P 500, metals, oil, USD & VXX), interactive member-analyst forum, and detailed library of Elliott Wave education.

The Canadian dollar will weaken over the coming months, pressured by an uncertain economic outlook and the prospect of higher interest rates in the United States even as the Bank of Canada stays on the sidelines, a Reuters poll showed.
While the loonie may gain a little in the short term on expectations of stronger first-quarter economic growth in Canada, the survey of close to 50 foreign exchange strategists showed it will weaken to C$1.35 per U.S. dollar in three months and close the year at the same level.
It is already 3 % lower than at this time last year.
Even as the U.S. Federal Reserve raised rates in March – its second hike in three months – and plans to hike twice more this year, the Canadian central bank is not expected to boost rates until 2018. It cut them twice in 2015.
“It is essentially a policy differential story,” said Shaun Osborne, chief currency strategist at Scotiabank.
“Some people have started … thinking that perhaps with the Federal Reserve now appearing a bit more fully committed to raising interest rates, that may mean something for Canada in the near- to medium-term … which I think is way too premature.”
Even though respondents expected the loonie to rise marginally in one month to C$1.34 from Wednesday’s close of C$1.3434, the forecast range remained wide, running from C$1.28 to C$1.39.
“We are possibly looking at the early stages of a renewed sell-off in the Canadian dollar in the next few weeks,” Osborne said. “There is just a lot of uncertainty here at the moment that rather suggests to me, anyway, that some of the strength we have seen in the Canadian data over the past few weeks is probably not sustainable.”
 Data from the Commodity Futures Trading Commission and Reuters calculations showed that speculators have increased bearish bets on the Canadian dollar to the most since March 2016.
Wells Fargo, the top forecaster in Reuters FX polls in 2016, expects the currency to weaken 5 % over the coming year to C$1.41.
Caution ahead
Despite a recent run of strong domestic data, Bank of Canada Governor Stephen Poloz has maintained a cautious stance on monetary policy, saying a premature rate hike could cause a recession in Canada as the economy has not yet fully recovered from the shock of weak oil prices.
The price of oil, one of Canada’s key exports, at around $55 a barrel, is still down over 50 % from its mid-2014 high. Commodity analysts polled by Reuters are still unsure if output curbs by OPEC members will be enough to offset the increase in U.S. production.
That does not support Canada’s highly indebted households that on an average owed C$1.67 for every dollar of disposable income in the fourth quarter, much of it because of cheap mortgage borrowing to chase ever-rising house prices.
The property market has turned into a key vulnerability for Canada’s financial system, posing a challenge to policymakers who can neither lower rates to stoke growth nor raise them to discourage further borrowing.
Another threat is rising anti-trade sentiment in the United States under President Donald Trump that has put the outlook for Canadian exports and the loonie under closer scrutiny.
Exports tumbled by the most in nearly a year in February, sending the loonie to a nearly three-week low of C$1.3455 on Tuesday, suggesting the monetary policy gap between the U.S. and Canada is unlikely to be plugged anytime soon.
“The policy divergence story will be in play until the end of this year. We don’t expect the Bank of Canada will raise rates until the first half of next year now,” said Royce Mendes, director and senior economist at CIBC Capital Markets in Toronto.
“We still see that there has been little evidence of a sustainable acceleration in underlying export growth or investment spending, and that’s a key component of the recovery we need to see for the Bank of Canada to really be comfortable with tightening policy.”
….also:

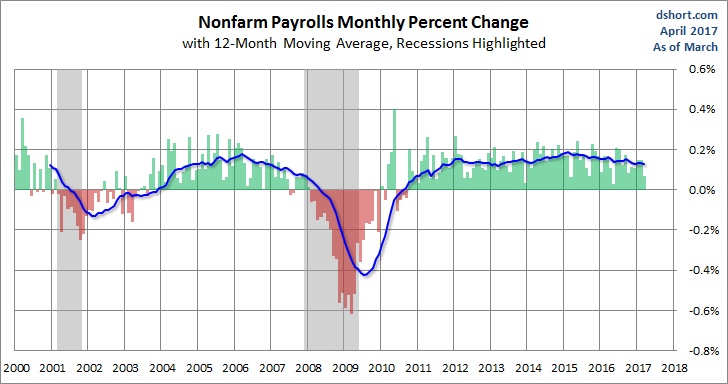
This morning’s employment report for March showed a 98K increase in total nonfarm payrolls. The unemployment rate ticked downward from 4.7% to 4.5%. The Investing.com consensus was for 180K new jobs and the unemployment rate to remain at 4.7%. January and February nonfarm payrolls were revised downward for a total loss of 38K.
Here is an excerpt from the Employment Situation Summary released this morning by the Bureau of Labor Statistics:
The unemployment rate declined to 4.5 percent in March, and total nonfarm payroll employment edged up by 98,000, the U.S. Bureau of Labor Statistics reported today. Employment increased in professional and business services and in mining, while retail trade lost jobs.
Here is a snapshot of the monthly percent change in Nonfarm Employment since 2000. We’ve added a 12-month moving average to highlight the long-term trend.
…continue reading this analysis complete with 8 more charts
…related:


-
I know Mike is a very solid investor and respect his opinions very much. So if he says pay attention to this or that - I will.
~ Dale G.
-
I've started managing my own investments so view Michael's site as a one-stop shop from which to get information and perspectives.
~ Dave E.
-
Michael offers easy reading, honest, common sense information that anyone can use in a practical manner.
~ der_al.
-
A sane voice in a scrambled investment world.
~ Ed R.
Inside Edge Pro Contributors

Greg Weldon

Josef Schachter

Tyler Bollhorn

Ryan Irvine

Paul Beattie

Martin Straith

Patrick Ceresna

Mark Leibovit

James Thorne

Victor Adair