
Stocks & Equities
Stock Trading Alert sent to subscribers on April 6, 2017, 6:58 AM.
Briefly: In our opinion, speculative short positions are favored (with stop-loss at 2,410, and profit target at 2,200, S&P 500 index).
Our intraday outlook is bearish, and our short-term outlook is bearish. Our medium-term outlook remains neutral, following S&P 500 index breakout above last year’s all-time high:
Intraday outlook (next 24 hours): bearish
Short-term outlook (next 1-2 weeks): bearish
Medium-term outlook (next 1-3 months): neutral
Long-term outlook (next year): neutral
The U.S. stock market indexes lost 0.2-0.6% on Wednesday, following relatively big move up, as investors reacted to the FOMC Minutes announcement. The S&P 500 index extended its short-term uptrend, before going closer to its recent local lows and support level of 2,350. The index remains around 2% below March 1 all-time high of 2,400.98. The Dow Jones Industrial Average closed below 20,700 mark, and technology Nasdaq Composite index reached new all-time high above the level of 5,900, before closing 0.6% lower. Is this a new uptrend or just upward correction within new medium-term downtrend? The nearest important level of support of the S&P 500 index is at around 2,350, marked by the above-mentioned recent local lows. The next support level is at 2,335-2,340, marked by local lows. The support level is also at 2,320, marked by February 13 daily gap up of 2,319.23-2,321.42 and last week’s Monday’s local low. On the other hand, the nearest important level of resistance is now at 2,370, marked by short-term local highs. The next resistance level is at 2,380-2,400, marked by all-time high, among others. We can see some short-term volatility following five-month-long rally off last year’s November low at around 2,100. Is this a topping pattern before downward reversal? The uptrend accelerated on March 1 and it looked like a blow-off top pattern accompanied by some buying frenzy. The S&P 500 index continues to trade along its medium-term upward trend line, as we can see on the daily chart:
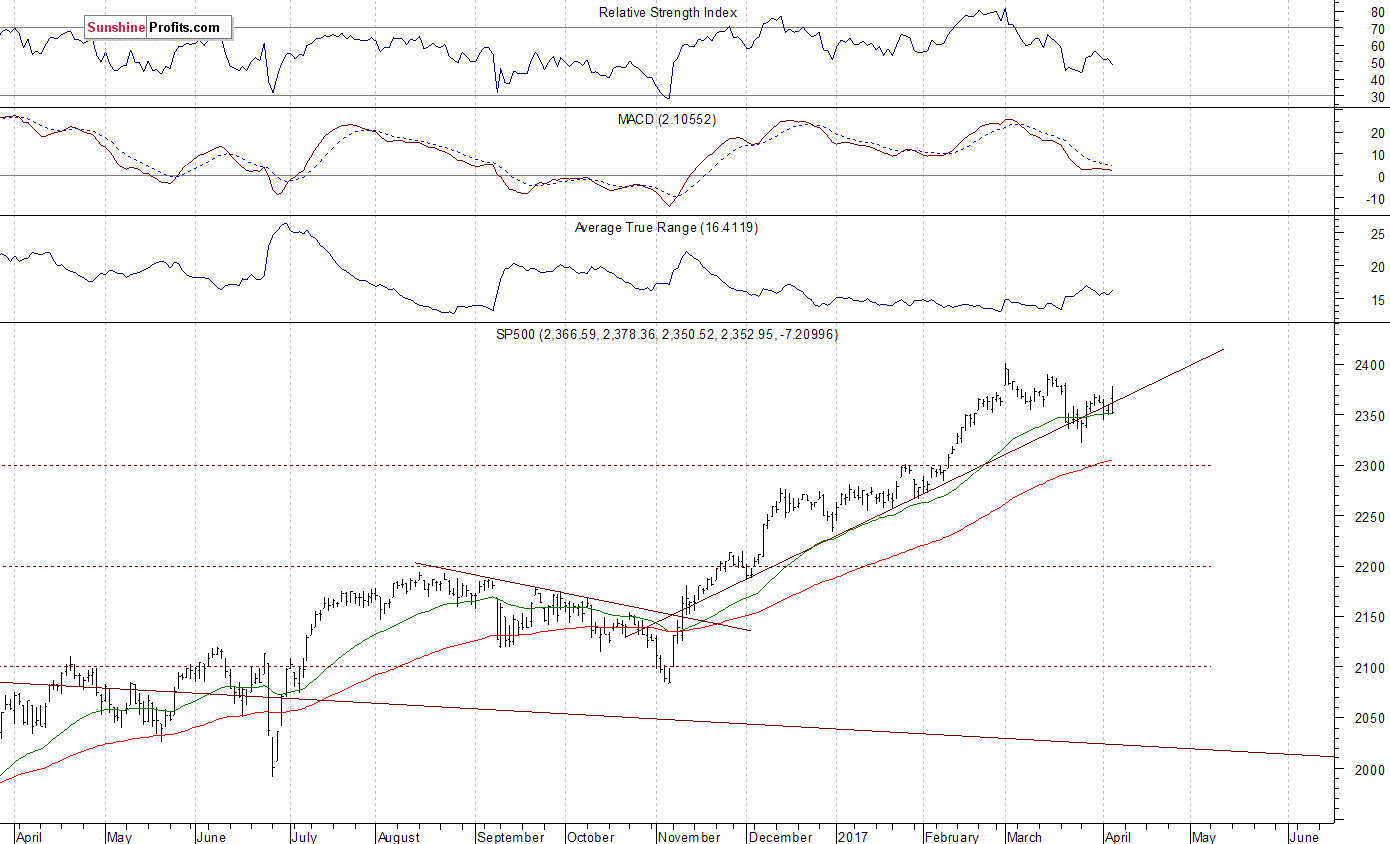
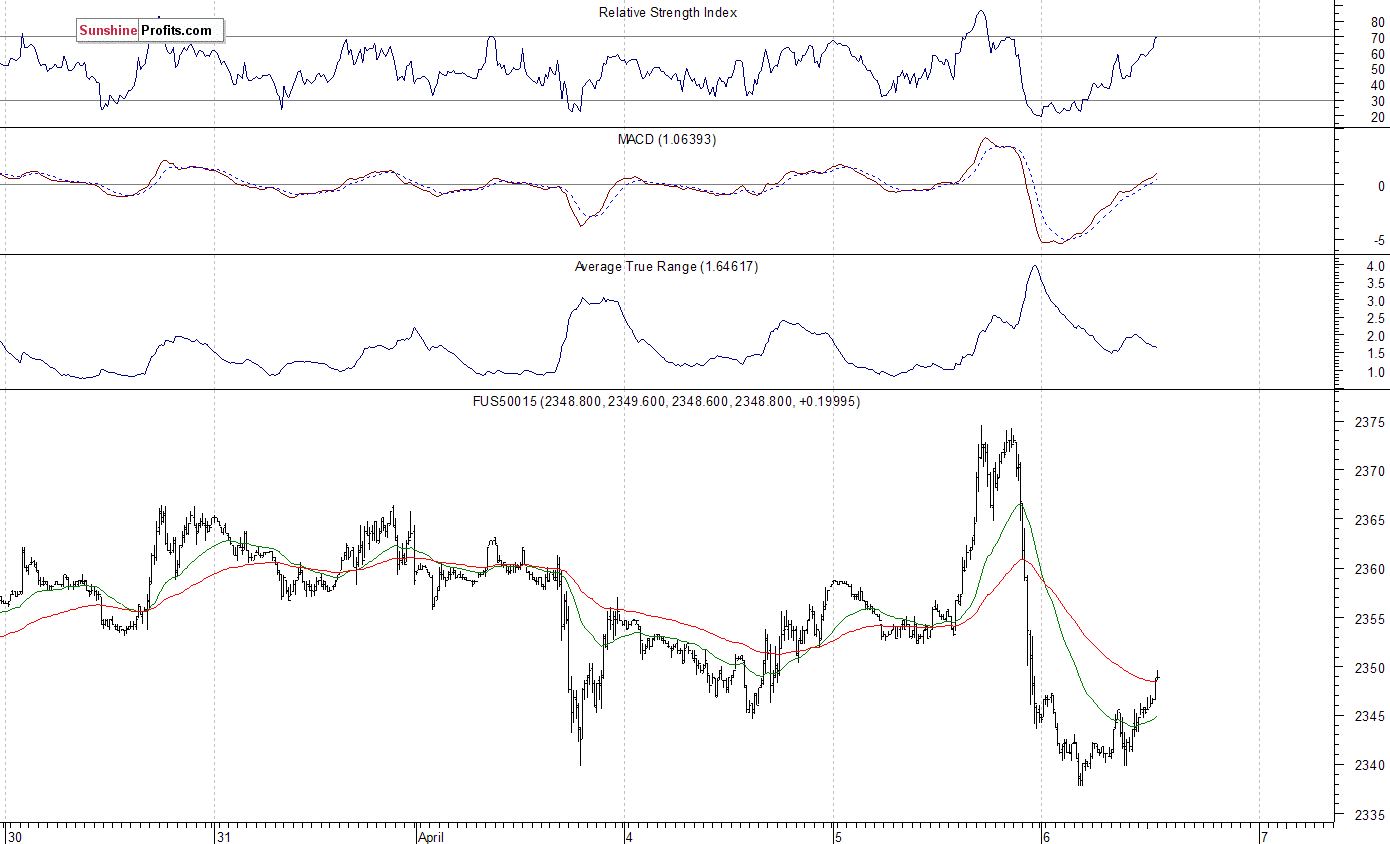
Expectations before the opening of today’s trading session are slightly positive, with index futures currently up 0.1%. The European stock market indexes have been mixed so far. Investors will now wait for the Initial Claims number release at 8:30 a.m. The market expects that the Initial Claims were 251,000 last week. The S&P 500 futures contract trades within an intraday consolidation, following yesterday’s move down. The nearest important level of resistance is at around 2,350-2,355, marked by previous level of support. The next resistance level is at 2,370-2,375, marked by yesterday’s local highs. The resistance level is also at 2,380-2,400, marked by topping consolidation along record high. On the other hand, support level is now at around 2,335-2,340, marked by short-term local low. The next support level is at 2,300-2,320, marked by some late March local lows. The market continues to trade within a short-term consolidation, following last week’s move up. Is this a topping pattern or just flat correction before another leg higher?
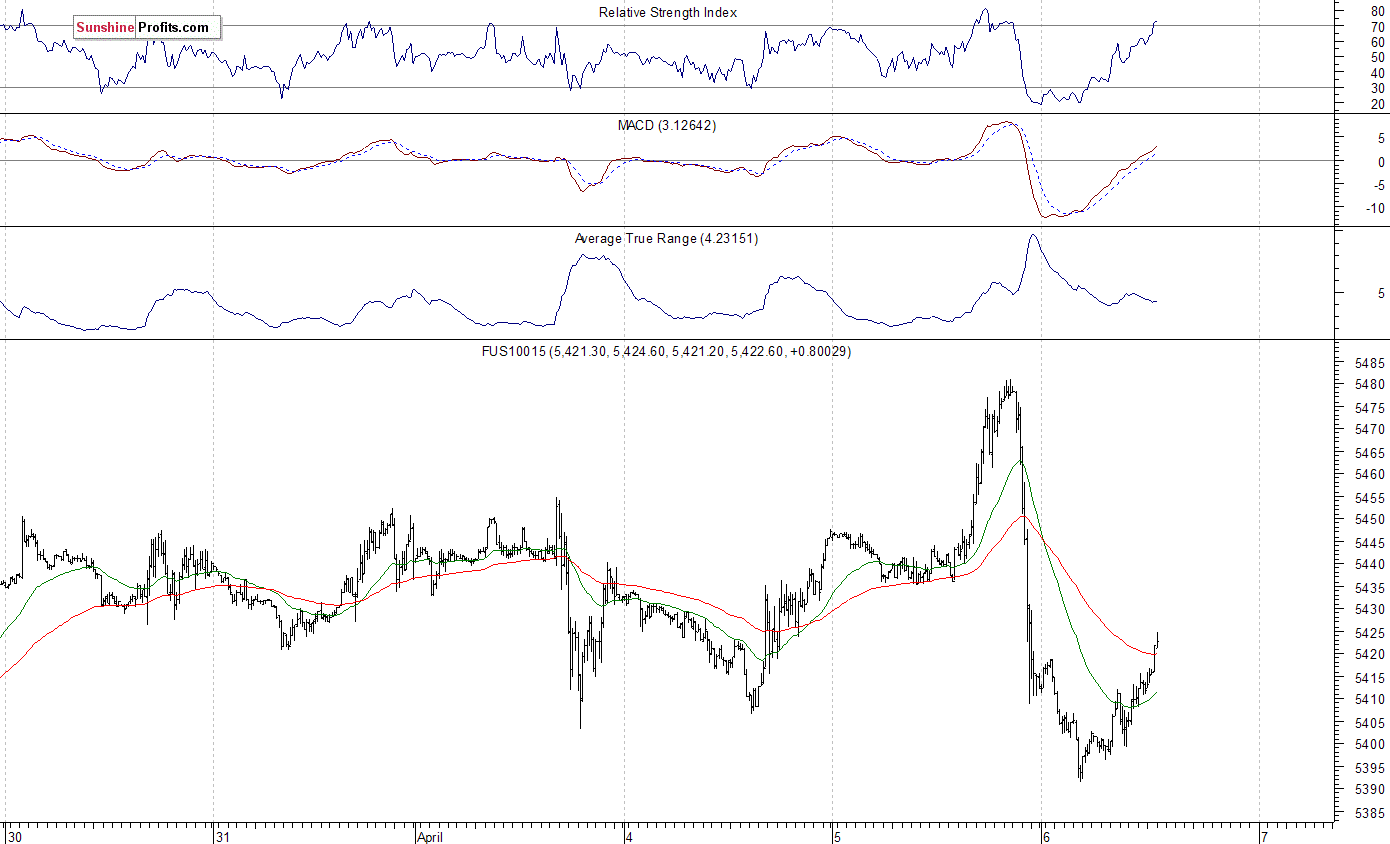
The technology Nasdaq 100 futures contract remains relatively stronger than the broad stock market, as it continues to trade above the level of 5,400. It has reached new all-time high above the level of 5,480 yesterday. The nearest important level of resistance is at around 5,440-5,450, and the next resistance level is at 5,480-5,500. On the other hand, support level is at 5,380-5,400, marked by short-term local lows, as the 15-minute chart shows:
Concluding, the S&P 500 index extended its short-term uptrend yesterday, before quickly reversing to the downside following FOMC Minutes report release. Will it continue lower or just extend five-week-long fluctuations? The broad stock market remains close to its five-month-long medium-term upward trend line. There have been no confirmed short-term positive signals so far. However, we still can see medium-term overbought conditions along with negative technical divergences. Therefore, we continue to maintain our speculative short position (opened on February 15 at 2,335.58 – opening price of the S&P 500 index). Stop-loss level is at 2,410 and potential profit target is at 2,200 (S&P 500 index). You can trade S&P 500 index using futures contracts (S&P 500 futures contract – SP, E-mini S&P 500 futures contract – ES) or an ETF like the SPDR S&P 500 ETF – SPY. It is always important to set some exit price level in case some events cause the price to move in the unlikely direction. Having safety measures in place helps limit potential losses while letting the gains grow.
To summarize: short position in S&P 500 index is justified from the risk/reward perspective with the following entry prices, stop-loss orders and profit target price levels:
S&P 500 index – short position: profit target level: 2,200; stop-loss level: 2,410
S&P 500 futures contract (June) – short position: profit target level: 2,197; stop-loss level: 2,407
SPY ETF (SPDR S&P 500, not leveraged) – short position: profit target level: $220; stop-loss level: $241
SDS ETF (ProShares UltraShort S&P500, leveraged: -2x) – long position: profit target level: $15.47; stop-loss level: $12.98
Thank you.
Paul Rejczak
Stock Trading Strategist

“A moment’s insight is sometimes worth a life’s experience.” ~ Oliver Wendell Holmes
This Bull started off as the most hated bull market in History, and it is now metamorphosing into the most insane of all Bull Markets. By any measure, this Market needs to let out some steam as it is trading in the extreme of the extremely overbought ranges. Historically, the crowd is almost always in the bullish camp at this stage of the game, but that does not appear to be the case. In fact, what stands out is that the masses are as anxious as ever, and yet the markets are trading close to their highs.
When you look at the sentiment data one thing becomes apparent; the masses are uncertain. They do not know whether they should embrace the bullish or bearish camp. Most of the actions seem to be limited to the Neutral camp; in other words, individuals keep moving from the bullish or bearish camps into the Neutral camp. ~ Market Update March 26, 2017
The masses are uncertain, and uncertainty is just a milder form of fear; they do not know what to expect, so they keep populating the neutral camp. The past five readings below starting from the 17th of March illustrate that the number of individuals in the bullish camp has never traded past the 48% mark; hardly something you would expect at this stage of the game
Sentiment data indicates that the Masses are still nervous
17th of March total number of neutral and bears: 74%
24th of March total number of neutral and bears: 67%
28th of March Total combined score of Neutral and bears: 64%
2nd of April total combined score of Neutrals and Bears: 70%
Emotions are driving this market to such a degree that traders would do well to pay close attention to the psychological state of the masses than to technical indicators. At this point, all we have is the technical factor, which means that a sharp correction (something that we would fully embrace) might not occur as the fear factor is already rising.
After all these years of looking at the markets, we cannot help but note that we have an extremely unusual situation developing. The markets are begging for a reason to correct, but the very reason they need is entirely lacking. Before a correction, the masses are usually optimistic and bullish, but this is not the case. From being the most hated it is moving into the most insane bull market as all the standard rules that apply to a Bull Market are being flung out of the window one at a time.
When markets are trading in record territory, the crowd is almost always bullish and complacent to some degree; all you are trying to do is measure the level of bullishness or complacency. However, as stated before this market is not following that guideline; it will be interesting to see what path the markets take; will the market’s pullback sharply even though the crowd is already anxious?
So is it time to Panic?
Fear in our books is a useless emotion that is abused by almost every media outlet, both financial and non-financial in nature. We believe in being aware of what is going so that we have the opportunity to act in a calm and collected manner. At this point, we favour a sharp correction, but our opinion is of little value; markets take the utmost delight in trying to punish those who have firms views. We have never witnessed a market pullback sharply no matter how overbought it is when the fear factor is high. However, there is always a first time or the possibility of something different occurring; hence, the need to always be ready and willing to adapt to change. If the market pulls back strongly while the crowd is still anxious, then we are moving into a new paradigm, and we will adjust accordingly. We are not going to think about it, or try to fight it; if the trend change occurs; there is only one option, accept and adapt to the new trend or resist and be run over.
Surprise, surprise, the crowd has become even more anxious this week as indicated by our proprietary “Anxiety Index.”

Even, we after looking at the markets for so many years have to shake our head and marvel and the huge dichotomy taking place in the markets right now. A few years ago, if someone told us we would be facing this situation we might have attempted to put up an argument as such a concept would seem almost incredulous, but today we should be ready and willing to deal with every possibility.
Conclusion
At this point, it is all about being patient and observant; the markets are trading in the extremely overbought ranges, and therefore prudence is warranted. Our plan is to wait for our indicators to pullback to the oversold ranges and in the interim to only open positions in stocks that are trading in the extremely oversold ranges to minimise our downside risk.
If you are a conservative trader, the suggested game plan would be to sit on the sidelines or scale back on your long positions and to tighten your stops. If you are not a conservative player then taking on some calculated risk is fine but aim for quality stocks that have pulled back or trading in the extremely oversold ranges and have your stops in place.
“Uncertainty and mystery are energies of life. Don’t let them scare you unduly, for they keep boredom at bay and spark creativity.” ~ R. I. Fitzhenry
If you prefer fake news, fake data, and a fake narrative about an improving economy and stock market headed to 30,000, don’t read this fact based, reality check article. The level of stupidity engulfing the country has reached epic proportions, as the mainstream fake news networks flog bullshit Russian conspiracy stories, knowing at least 50% of the non-thinking iGadget distracted public believes anything they hear on the boob tube.
This stupendous degree of utter stupidity goes to a new level of idiocy when it comes to the stock market. The rigged fleecing machine known as Wall Street has gone into hyper-drive since futures dropped by 700 points on the night of Trump’s election. An already extremely overvalued market, as measured by every historically accurate valuation metric, soared by 4,000 points from that futures low – over 20% – to an all-time high. Despite dozens of warning signs and the experience of two 40% to 50% crashes in the last fifteen years, lemming like investors are confident the future is so bright they gotta wear shades.
The current bull market is the 2nd longest in history at 8 years. In March of 2009, the S&P 500 bottomed at a fitting level for Wall Street of 666. In a shocking coincidence, it bottomed on the same day Bernanke & Geithner forced the FASB to rollover like mangy dogs and stop enforcing mark to market accounting. Amazingly, when Wall Street banks, along with Fannie and Freddie, could value their toxic assets at whatever they chose, profits surged. The market is now 240% higher.
You have the second longest bull market in history, while stock market valuations, as measured by the Shiller PE ratio and every other historically accurate valuation method, are higher than 1929 and 2007, but the Wall Street hype machine and the business network shills adamantly declare this bull has years to go and thousands of points of upside. Greybeards who haven’t been captured by the Wall Street machine honestly point out the market will deliver 0% returns over the next ten years at these valuations. Eric Peters’ words of wisdom will fall on deaf ears:
“The longer a market trends lower, or higher, the more confident people become that tomorrow will look like today. And what they forget is that the single most important consideration in investing is your starting point.”

There are plenty of things that can keep investors up at night worrying about what could derail the stock market. Rising interest rates should not be one of them.
I get a ton of mailbag questions these days asking whether the Fed will get too aggressive with hiking rates, eventually killing the eight-year bull market in stocks.
The implication is: When rates go up, stocks must go down.
Everyone’s heard this so often it’s accepted as truth. In fact, not a day goes by when I don’t overhear some talking head on CNBC touting this nonsense.
Don’t believe it, because it’s pure baloney.
Last week, I updated you about where we are right now in the big-picture cycle analysis that Larry Edelson pioneered and passed on to us as his legacy. As he correctly forewarned, all the major economic cycles point in unison: A supercycle convergence of historic proportions.
Besides his ardent study of cycles, Larry was also a keen student of history. And he constantly applied historical analysis to his market forecasts. Correctly identifying historical market patterns, sometimes long forgotten, but destined to repeat.
The upshot? During turbulent periods like this, markets could behave exactly the opposite of what you would expect. You simply can’t afford to rely on old myths about how the markets should behave.
The single biggest myth gaining traction right now is
about interest rates and stock prices.
Everyone seems to believe that when yields move up, stocks will tumble – but that’s total hogwash – nothing could be further from the truth.
Historically most bull markets in equities occur with rising interest rates, not falling rates. Conversely, most bear markets in stocks happen alongside declining interest rates. It is exactly the opposite of what you hear.
Just look at recent history: The Fed has raised interest rates three times since December 2015, and promises more to come, yet stocks are up nearly 15% since the first rate hike.
Want more proof? Let’s take a look at one of the greatest secular bull markets in history: The 1950s and ’60s! Take a look at the charts below and you’ll see what I mean.

The chart at left shows the Dow (top panel) and Treasury yields (bottom) from 1954 to 1962. Above right shows the Dow and yields from 1960 to 1965.
As you can clearly see, stocks and interest rates rose together, not always in lockstep to be sure, but the upward trend in both stocks and yields over the same period is unmistakable.
Treasury yields rose from less than 2.5% to more than 4% over this entire period. If that happened today, the doom-and-gloomers on CNBC would be pounding the table about an imminent stock market crash.
But historically, when this scenario actually played out in the ’50s and ’60s, the Dow soared 279%; stocks went up, up, and away, together with interest rates.
Bottom line: Don’t listen to myths in the financial media about higher rates hurting stocks, it’s simply untrue. Think for yourself, do your own homework, and if you analyze the markets from a historical perspective, you’ll see the hard evidence plain as day.
Interest rates are going up for many years to come, and that is the most bullish thing that can happen to stocks, not to mention commodities!
Good investing,
Mike Burnick

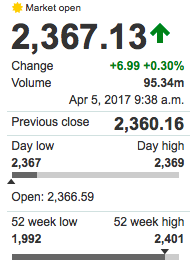 U.S. stocks opened higher on Wednesday as investors shrugged off reports of another North Korean missile launch, focusing instead on a blockbuster reading on private-sector employment. The S&P 500 SPX, +0.29% climbed 7 points, or 0.3%, to 2,368, while the Dow Jones Industrial Average DJIA, +0.40% advanced 91 points, or 0.5%, to 20,782. The Nasdaq Composite Index COMP, +0.23% gained 14 points, or 0.2%, to 5,911. Shares of Panera Bread Co. PNRA, +13.60% soared after the fast-casual restaurant chain reached a deal to be acquired by a private holding company for $7.5 billion. Monsanto Co. MON, +0.69% shares rose after the company’s latest quarterly results beat profit and sales expectations. U.S. employers added 263,000 private-sector jobs last month, according to payrolls processor ADP Inc., surpassing expectations for an increase of 170,000.


-
I know Mike is a very solid investor and respect his opinions very much. So if he says pay attention to this or that - I will.
~ Dale G.
-
I've started managing my own investments so view Michael's site as a one-stop shop from which to get information and perspectives.
~ Dave E.
-
Michael offers easy reading, honest, common sense information that anyone can use in a practical manner.
~ der_al.
-
A sane voice in a scrambled investment world.
~ Ed R.
Inside Edge Pro Contributors

Greg Weldon

Josef Schachter

Tyler Bollhorn

Ryan Irvine

Paul Beattie

Martin Straith

Patrick Ceresna

Mark Leibovit

James Thorne

Victor Adair