
Wealth Building Strategies
Show Highlights
-
The guest / host agree that the PMs sector found a firm bottom in 2015 making the buy and hold method ideal for most investors.
-
For more intrepid investors, David Morgan’s proprietary gold / silver ratio analysis strongly suggests higher prices to come.
- The silver Commitments of Traders reports adds insights into market sentiment.
- Buying silver bullion in quantity for the long-term remains the ideal hedge.
- Cuisine for cogitation includes a new reagent that promises to revolutionize gold / silver processing, via an environmental friendly, cyanide-free method.
-
Chris welcomes back a modern Jesse Livermore, Martin Armstrong ofArmstrong Economics, the subject of the documentary film, The Forecaster(2015).
-
Although central banks around the globe have lowered interest rates, taxation rates continue to climb.
-
Officials in the US and the EU have called on Martin Armstrong during periods of economic chaos over the past 30 years.
-
Our guest suggests they consult with actual traders who understand the market mechanics, not just economic theory.
-
Armstrong advises gold investors to ignore the inflation / deflation debate; focus instead on the the yellow metal as a hedge against governments.
-
He shares a witty quote by Milton Friedman: If you put economic policymakers in charge of the Sahara, there would be a shortage of sand in 3 years.
-
Given central bankers control the currency system, the inevitable collapse is destined to propel the PMs skyward.
-
A dollar rally will trigger the global reset – as rates increase, over $500 trillion in interest rate sensitive derivatives bets, CDOs, MDO, etc. will implode.
-
US equities will continue to soar, with the Dow climbing to perhaps as high as 40,000 or more, along with the PMs.
-
Our guest advises against purchasing government debt – the supposed risk-free rate is far more risky than blue-chip shares by comparison and rarely default.

Perspective
In the fateful month of May 2007, the Treasury curve reversed and in that fateful June, credit spreads reversed. Both forced the dramatic failure of Bear Stearns in early June, which marked the start of the worst contraction since the 1930s. Our presentation in early June included a slide of a crashed train. The caption was that “The Greatest Train Wreck in The History of Credit” had started.
Today, a Morgan Stanley researcher seems confident that central bankers can “keep the party going”. In 2007, the same boast would be accomplished through cutting the Fed rate. Short rates increase in a boom, and this has been a financial boom. Short rates decline in the contraction.
Stock Markets
Back in December, we had thought that the positive stuff would run into March. But some items became tired in late February – early March. As noted last week, base metals made it to March 1 and rolled over. Crude oil stayed firm until the end of February. Credit spreads narrowed until the middle of March and as of Tuesday, this has reversed. Essentially, there has been little change in the yield curve since December.
The action in December became sensational enough to suggest that a Big Rounding Top was possible. This was confirmed by even greater technical excesses being accomplished more recently. These were accompanied by very strong sentiment readings. Both only seen at or near cyclical peaks in the stock market.
To back up just a little; with the explosion in November we called the action “Rational Exuberance”. Rational because it was discounting the change from the most anti-business administration in history to what could be the most pro-business. A few weeks ago, we noted that the action had left “Rational” behind and was just “Exuberance”.
Which continued to this week when a setback from a speculative surge began a correction. It has been earned and fits with the ChartWorks “ABC” correction, which could have declined to a “Springboard Buy”. This is a distinctive break in a flat or rising market and it registered on Tuesday. So, we watch for the bounce and how far it goes.
Out there will be the first drop in expanding margin on the NYSE. The actual report is a month behind and is considering a lagging indicator. With this and a MACD Sell on the S&P would confirm that the Big Top was in.
As we await the full development of the big Rounding Top, we can review some critical items.
One is the discovery that when the action in HYG (High-Yield) soars enough to drive the Daily RSI to close to 77 an important top was set by the S&P some 3 weeks later. The high RSI was set on February 27 and the S&P set highs at 2400 on March 4 and 2390 on March 15.
It could take a number weeks to see if the pattern worked as it did in 2007 and at the lesser high in May 2008.
Another relation that Ross has been working on is the action in the Treasury curve. The 2’s to 20’s need to take out a key low. While not that far away, the take-out is uncertain.
Precious Metals
We find comfort in reviewing gold shares divided by the bullion price, which has been in a basing phase, essentially since November.
The first low on the ratio (HUI/Gold) was 142 in November and the next at 142 in December. The first rally was to 180 in early February which was overbought enough to conclude a decline for the sector.
The next low was 149 in early March, which was tested a couple of weeks later. At 161 now, it needs to get above the 50-Day to complete the bottoming process.
GDXJ slipped from 43 in early March to 33 a couple of weeks ago. At 36 now, getting above the 50-Day would be constructive.
The bottoming action in December 2015 set up what we have been calling a cyclical bull market.
The “Cyclical” call was based upon the bottoming of gold’s real price as deflated by the PPI.
The Cyclical Peak was set at 9.27 in 2011 and the bottom was a double bottom. The low in October 2014 was 5.63, which was tested at 5.63 in July 2015. The high was 7.36 in July last year. The next low was 6.02 set in January. The latest posting is for February at 6.39, which is constructive.
A rising real price is a sign of improving operating margins for gold miners. It also enhances exploration prospects.
China House Prices

Source: Zero Hedge
- Latest posting sets a new, but modest, low.
- That’s on the Tier 1 listings.
San Francisco House Prices

US Y/Y Loan Creation

- For a contraction to start, banks don’t have to call loans.
- All that is needed is that bankers become nervous and stop making them.
US Shale Oil is Killing OPEC

“At the peak of the 2014 boom, the break-even cost of U.S. shale oil was $60. Today, the figure is nearer to $30. In some places, the breakeven cost is just $15 a barrel.”
– The Times, March 20
The Round Trip

- The chart is of sales volume.
- Double Top with 2007 and 2014.
- At the tops, there must have been a lot of certainty.
Check out the following:

The art piece, “My Bed” was originally sold by the artist for £150,000 in 1999 to an art dealer, for display. In 2015 it was sold at auction for £2.5 million.
Small Business Optimism and Real Earnings

- Post Trump Optimism is in Red.
- Real Earnings are in Black.
Setting Up For a Classic Triple Top

- Our March 2nd Pivot noted that Lumber had accomplished an Upside Exhaustion followed by a correction.
- Also noted was that Lumber tended to set Triple Tops at important highs.
- This week’s action is working on the third Top, which could complete the Peak.


Source: Zero Hedge
Listen to the Bob Hoye Podcast every Friday afternoon at TalkDigitalNetwork.com

Josef Schacter called oil decline from over $100. Then called the recovery and made our listeners and World Outlook Conference attendees big money. What til you hear what he says is coming next.
….also from Michael: A New Definition of the Free Market
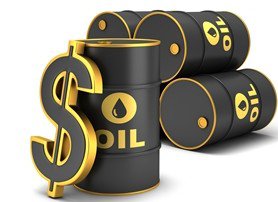

Precious metals closed the first quarter with solid gains. Gold gained almost 9% while Silver gained 14%. The miners (GDX and GDXJ) gained the same amounts (9% and 14%) but unlike the metals which closed at their highs of the quarter, ended up losing more than half their gains. Despite a strong quarter, the entire complex remains below the February highs and 200-day moving average (ex Silver) just days after the US Dollar index rebounded strongly from its own 200-day moving average. As the second quarter begins, the warning signs for precious metals are mounting.
It is never a good sign when Gold is the strongest part of the sector and especially while the sector trades below key moving averages. While Silver rests above its 200-day moving average and has recently outperformed Gold on a percentage basis, unlike Gold it has yet to reach its late February highs around $18.50. So in that respect Silver has lagged Gold. Meanwhile, the miners have not even come close to returning to their 200-day moving averages or February highs. They first reached their 200-day moving averages ahead of the metals and also began their correction first.
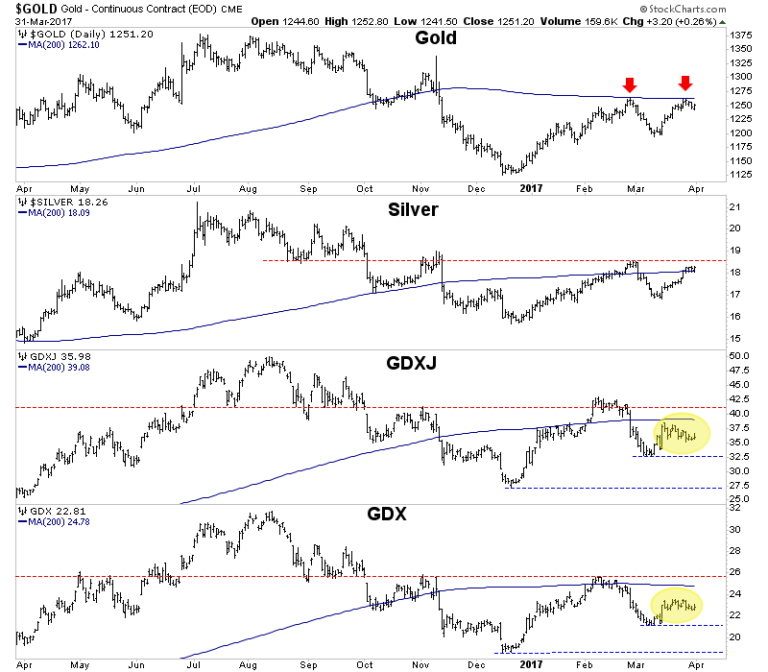
Gold is the strongest part of the sector but we see evidence it could weaken during the start of the second quarter. Gold has already failed twice at its 200-day moving average and now it must contend with a rebound in the US Dollar index. Last week the greenback enjoyed a strong rebound off its rising 200-day moving average. Furthermore, note that since December the greenback retraced only 38% of its advance from 92 to nearly 104. The strongest trends will retrace usually 38% or 50% of previous gains. Finally, while Gold against foreign currencies (Gold/FC) is quite strong from a bird’s eye view, it is currently showing a negative divergence to Gold as it is below its late February high. If Gold/FC is weaker than Gold it means that Gold is more vulnerable than usual to a rising US Dollar.
As the second quarter begins, there are critical warning signs for precious metals. The miners typically lead the metals and their recent failure to return to their 200-day moving averages and February highs is a bad omen for the metals. In addition, last week we covered the GDX advance decline line which is so weak it couldn’t even come close to its 50-day moving average. Meanwhile, the US Dollar’s strong rebound off its 200-day moving average will provide additional resistance to Gold. Given that Gold is currently the strongest part of the sector, that is not good for the entire sector. We expected 2017 to be a grind. Be patient and if precious metals turn lower, wait to buy bargains amid oversold conditions. We continue to look for high quality juniors that we can buy on weakness and hold into 2018. For professional guidance in riding this new bull market, consider learning more about our premium service including our current favorite junior miners.
Jordan Roy-Byrne, CMT, MFTA

 Late for work? Imagine skipping the subway and instead heading to your local “vertiport,” where you can hop into an aircraft the size of an SUV that runs on electricity and works pretty much like an elevator.
Get in, punch in your destination, and off you go. Alone.
It may sound like an episode of “The Jetsons,” but electric air taxis are a form of transportation that is coming to Dubai in just a few months. And investors hope American cities aren’t much far behind.

-
I know Mike is a very solid investor and respect his opinions very much. So if he says pay attention to this or that - I will.
~ Dale G.
-
I've started managing my own investments so view Michael's site as a one-stop shop from which to get information and perspectives.
~ Dave E.
-
Michael offers easy reading, honest, common sense information that anyone can use in a practical manner.
~ der_al.
-
A sane voice in a scrambled investment world.
~ Ed R.
Inside Edge Pro Contributors

Greg Weldon

Josef Schachter

Tyler Bollhorn

Ryan Irvine

Paul Beattie

Martin Straith

Patrick Ceresna

Mark Leibovit

James Thorne

Victor Adair