
Energy & Commodities
 Notwithstanding that oil demand has increased for over 150 years, it will eventually stop increasing. If oil demand were to reach an actual peak, then the top might be easier to predict. As it stands, the forecast models of demand are likely predicting peak demand far later than it will be.
The so-called balance of supply and demand has always been a moving target, a race to the top in which the two run neck and neck. Imbalances result from out-of-step growth rates and not from movements away from a stationary balance. Perversely, imbalances breed further imbalances as the supply and demand components are provoked in opposite directions but with different timing, magnitudes and inertias. Without sufficient damping, the market has often overcompensated. Of course, there are also exogenous events like political turmoil, policy shifts, technological innovations and demographic changes which can unexpectedly and significantly alter not just the immediate balance but fundamentally shift the way supply and demand curves respond to price movements. The trends are plagued by inherent and irreducible irregularities.
Such a structural change has recently occurred. High prices persisted long enough for the industry in the U.S. to build a larger fleet of modern rigs and to learn how effectively to hydraulically fracture shale wells. It also persisted long enough for new efficiencies to incubate towards maturity, and the Paris accords promised to further reduce carbon emissions through policy changes. By the time that Saudi Arabia finally acted to protect not only its place among suppliers but also, and more importantly, the role of oil in the world economy. The backbone of shale supply in the U.S. was strong, and the seeds of lesser use were established. After these fundamental shifts, the rest of the world realized what Saudi Oil Minister Al-Naimi argued long ago and what Shell Oil has more recently asserted, namely that peak demand will occur long before peak supply.
To understand the trajectory of demand growth, we turn to econometric models like those published by the EIA and IEA. The central problem with long term supply and demand models is that they require assumptions about the many and interrelated responses to today’s prices. Though modeled responses may be tuned with low precision to relatively recent events and new realities, the actual response curves are poorly constrained and continue to evolve, in some cases at an accelerating pace. As the aphorism goes, all models are wrong, but some are useful.
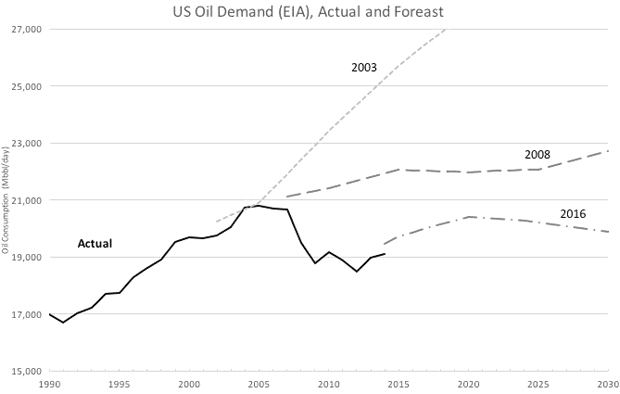
The EIA, IEA and other public econometric models call for global oil demand to continue growing through 2040, and the EIA even calls for renewed growth in the U.S. and OECD demand. The forecasts of growth in global demand rely upon increased use by developing countries, most importantly China and India. On the other hand, the United States has already seen demand decline for about 13 years. In fact it was the second to last of the world’s seven major developed countries to enter demand decline, and the entire OECD group of countries has, as a whole, seen shrinking demand since 2007. EIA data shows that 35 countries in all have already reached and descended from maximum oil demand. The experience of projected versus actual peak oil demand in the U.S. and OECD countries provides an empirical test and thus context to evaluate the current forecasts of growth and delayed maximum.
The following chart compares actual oil demand in the U.S. to several relevant demand forecasts of the EIA, all data coming from the EIA itself. U.S. demand reached a plateau for four years ending in 2007. Before, during, and even after the actual maximum demand, the models predicted decades of growth.
The next chart shows the same kind of comparison for the IEA’s models of OECD oil demand. Actual demand gently achieved its maximum in 2005. Even the alternative policy (lower demand) case in 2006 failed to capture the impending decline, but the reference cases adapted to the reality of declining demand much more quickly than did the EIA. Still the IEA over predicted the actual demand. Though not shown in charts, the EIA’s model of OECD demand growth and the IEA’s model of U.S. demand growth follow the same patterns. In short, these deeply technical and widely used referenced models missed badly the pivot point, the watershed of the object of analysis. For truly exculpatory reasons, the second and third order dynamics of reality were not captured by the models.

Rather than the theoretical calculation by such models, empirical observation of history is likely more informative when it comes to anticipating the timing of maximum demand. The graph below normalizes annual oil demand from the G7 countries with the U.S. shown in black, each normalized to its own year and volume of maximum demand. The scales show a 15 year window around the maximum annual consumption, and the pattern of the G7 is repeated in the OECD total and in most all of the 28 other countries.

The same data viewed on the scale of generations may resemble an alpine peak, but from the experience of living through it, demand does not peak. It sputters, surges and stalls as it rolls over from a slow incline into a slow decline. It is less a peak and more a crest of demand.
Sequential global demand forecasts over the last decade have projected slower growth, mostly now forecast at less than 1 percent, and sensitivity cases now allow for the possibility of substantial demand decline by 2040. Unfortunately, experience demonstrates that the crest will likely occur unexpectedly and sooner than predicted. And then our industry enters a whole new world as the moving balance of supply and demand turns into a race to the bottom.
By Dwayne Purvis for Oilprice.com

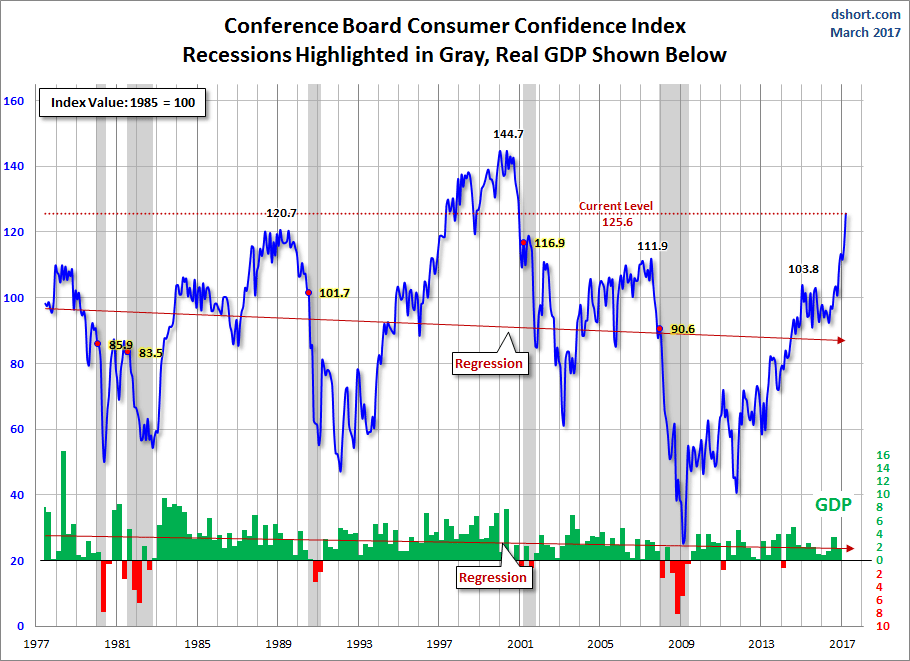 The latest Conference Board Consumer Confidence Index was released this morning based on data collected through March 16. The headline number of 125.6 was a sharp increase from the final reading of 116.1 for February, an upward revision from 114.8. Today’s number was above the Investing.com consensus of 114.0.
 Birds are not the only creatures migrating south. In the United States, more and more people are leaving the highest taxes state and moving to lower tax states. One of the states that has seen large scale migration outward has been Illinois, where taxes are going insane and the there is no end in sight. Florida seems to be the number one destination. Housing prices are rising because of the net migration leaving the higher taxed states in the North. Within Europe, the youth have been migrating from Greece and Spain northward in search of jobs.
Likewise, we are also starting to see a surge in real estate in some areas driven by the first upticks in interest rates. Contrary to what the pundits believe that higher interest rates would cause the economy to turn down along with the stock market, they are being proven wrong every time because people are not as stupid as the pundits. Why buy a house and rush to lock in a low interest rate when they keep moving lower? As soon as mortgage rates began to rise, that’s when people spend because they KNOW it will cost them more to now wait.
The same thing happened in Japan. The month before a big imposition of sales tax was to hit, everyone ran out and bought whatever they contemplated. The surge one month before the tax increase made people think the economy recovered overnight.
Plain an simple, the average person responds to what they see. They do not understand the financial news nor do they even bother to watch it. I remembered that lesson from the peak in interest rates in 1981. My mother and her sister ran out and bought 10 year CDs at the bank locking in 20%. They picked the high and never watched a single TV show on markets. They did not ask me. They just did it.
Gold and the stock market will take off when people realize that government is in trouble. When they lose confidence, that is when they will start to pour into tangible assets.
…also from Martin:

The following article is arranged in Question and Answer (Q & A) format. Through the Q & A approach, this article raises some important issues about price discovery in the gold markets and aims to explain the view that the gold price is being set by the paper gold markets.
BullionStar’s CEO Torgny Persson and precious metals analyst Ronan Manly are of the opinion that due to the structure of contemporary gold markets, it is primarily trading activity in the paper gold markets which sets the international price of gold.
Question: The international gold price is constantly quoted in the financial media alongside other major financial indicators. What is this international gold price, and how is it defined?
The international gold price usually refers to the price of gold quoted in US Dollars per troy ounce as traded on the 24-hour global wholesale gold market (XAU/USD). Gold is traded non-stop globally during the entire business week, creating a continuum of international gold price quotes from Sunday evening New York time all the way through to Friday evening New York time. Depending on the context, this international gold price sometimes refers to a spot gold market quote, such as spot gold traded in London, and at other times may refer to the front month of a gold futures contract price as traded on the US Commodity Exchange (COMEX). The front month contract is a nearby month which will usually exhibit the highest trading volume and activity.
The international gold price can also at times be referring to the LBMA Gold Price benchmark price as derived during the London daily gold price auctions (morning and afternoon auctions). LBMA is an abbreviation for London Bullion Market Association.
Therefore, this ‘international price’ could be referencing a spot gold price, a futures gold price, or a benchmark gold price, but all three would, at a comparable time, be roughly similar in magnitude.
Question: Where does this international gold price come from, where is it derived?
Recent empirical research has determined that gold price discovery is jointly driven by London Over-the-Counter (OTC) spot gold market trading and COMEX gold futures trading, and that the “international gold price” is derived from a combination of London OTC gold prices and COMEX gold futures prices. See “Who sets the price of gold? London or New York (2015)” by Hauptfleisch, Putniņš, and Lucey.
In general, the higher the trading volume and liquidity in a specific asset market, the more that market contributes to discovering prices for that asset. This is also true of the global gold market. Between them, the London OTC and New York trading venues account for the vast majority of global gold trading volume, and in 2015, the London OTC spot market represented approximately 78% of global gold market turnover while COMEX accounted for a further 8% (See Hauptfleisch, Putniņš, and Lucey (2015)).
Based on London gold clearing statistics for 2016, a quick calculation shows that total trading volume in the London OTC gold market is estimated to have been at least the equivalent of 1.5 million tonnes of gold in 2016, while trading volume of the 100 oz COMEX gold futures contract reached 57.5 million contracts during 2016, equivalent to 179,000 tonnes of gold. Gold trading volume on the London OTC gold market in 2016 was therefore about 8.4 times higher than trading volume in the COMEX 100 oz gold futures contract.
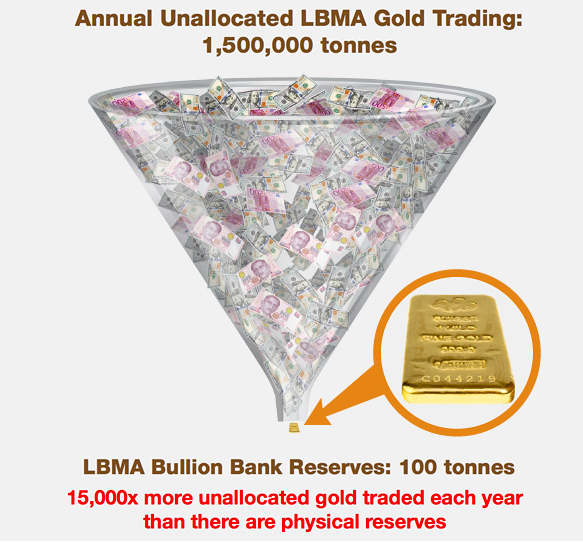
LBMA Unallocated Gold Trading, 1.5 million tonnes in 2016
However, COMEX has been found, by the above academic research, to have a larger influence on price discovery than London OTC, despite the lower trading volumes of COMEX. This is most likely due to a combination of factors such as COMEX’ accessibility and extended trading hours via use of the GLOBEX platform, the higher transparency of futures trading compared to OTC trading, and the lower transaction costs and ease of leverage in COMEX trading. In contrast, the London OTC gold market has limited trading hours (during London business hours), barriers to wider participation since it’s an opaque wholesale market without central clearing, and trading spreads which are dictated by a small number of LBMA bullion bank market-makers and a handful of London-based commodity brokerages.
The bottom line though is that both sets of trading statistics, London OTC and COMEX, are gigantic in comparison to the size of the underlying physical gold markets in London and New York.
Question: So, does the physical gold market or the paper gold market set this international price of gold?
The international gold price is purely set by paper gold markets, in other words it is set by non-physical gold markets. Based on their respective gold market structures, the London OTC gold market and COMEX are both paper gold markets. Supply of and demand for physical gold plays no role in setting the gold price in these markets. Physical gold transactions in all other gold markets just inherit the gold prices that are discovered in these paper gold markets.
The London OTC gold market predominantly involves the trading of synthetic unallocated gold, where trades are cash-settled and not physically delivered (i.e. no delivery of physical gold). These synthetic gold transactions have little connection to any underlying gold holding, hence they are de-facto gold derivative positions. By definition, unallocated gold positions are just a series of claims on bullion banks where the holder is an unsecured creditor of the bank, and the bank has a liability to that claim holder for an amount of gold. The holder, on its side, takes on credit risk towards the bullion bank. The London OTC gold market is therefore merely a venue for trading gold credits.
The London OTC gold market is also one in which the bullion banking participants employ fractional-reserve gold trading to create large amounts of paper gold out of thin air (analogous to commercial lending), where the trading is also leveraged and opaque, and where this paper gold is only fractionally backed by physical gold. This “gold” is essentially synthetic gold. See BullionStar Gold university article “Bullion banking Mechanics” for further details on fractional-reserve gold trading.
Since COMEX only trades exchange-based gold futures contracts, it is, by definition, a derivatives market. Cash-settlement is the norm. Only 1 in 2500 gold futures contracts traded on COMEX is delivered with a transfer of warrants representing metal. The rest of the contracts are cash-settled. This means that 99.96% of COMEX gold futures contracts are cash-settled. See BullionStar US Gold Market Infographic for details.
Given COMEX trading gold futures and London trading synthetic unallocated gold, both the London and COMEX gold markets essentially trade gold derivatives, or paper gold instruments, and by extension, the international gold price is being determined in these paper gold markets.
Beyond the London OTC gold market and COMEX, all other gold trading venues are predominantly price takers that take in and use the gold prices established by the paper gold markets in London and New York. These other markets include physical gold markets around the world which look to the international gold price as an input into their domestic gold price setting mechanisms and conventions.
Question: Explain a little more about the market structures of these London OTC and COMEX markets?
By definition, futures trading is trading of securities whose value is derived from an underlying asset but whose securities are distinct from those of the underlying asset, i.e. derivatives. COMEX gold futures contracts are derivatives on gold. COMEX registered gold stocks are relatively small, very little physical gold is ever delivered on COMEX, and even less physical gold is withdrawn from COMEX approved gold vaults. COMEX gold trading also employs significant leverage. Hauptfleisch, Putniņš, and Lucey (2015) state that “such trades [on COMEX] contribute disproportionately to price discovery”. Note that the COMEX gold futures market is actually a 24-hour market but its liquidity is highest during US trading hours.
Turning to the London OTC gold market, nearly the entire trading volume of the London OTC gold market represents trading in unallocated gold, which to reiterate, merely represents a claim by a position holder on a bullion bank for a certain amount of gold, a claim which is rarely exercised. London OTC gold trades also predominantly cash-settle. Traders, speculators and investors in unallocated gold positions virtually never take delivery of physical gold.
This is a fact confirmed by a UK HMRC / LBMA Memorandum of Understanding published in 2013 which states that in the London gold market “investors acquire an interest in the metals, although in most situations, physical delivery will not occur and in 95% of trades, trading in unallocated metals will be undertaken.” Additionally, in 2011, the then LBMA CEO Stuart Murray also confirmed that there were ‘very substantial amounts of unallocated gold’ held in London.
A 2015 legal opinion on unallocated gold drafted by respected global law firm Dentons describes unallocated gold as ‘synthetic’ gold and as a derivatives transaction.
Dentons states that “the reality of unallocated bullion trading is that buyers and sellers rarely intend for physical delivery to ever take place. Unallocated bullion is used as a means to have “synthetic” holdings of gold and so obtain exposure to the price of gold by reference to the London gold fixing.”
Although the LBMA does not publish gold trading volumes on a regular basis, it did publish a one-off gold trading survey covering Q1 2011 in which it was revealed that during the first quarter of 2011, 10.9 billion ozs of gold (340,000 tonnes) were traded in the London OTC gold market. During the same period, 1.18 billion ozs of gold (36,700 tonnes) were cleared in the London OTC gold market. This would suggest a trading turnover to clearing turnover ratio of 10:1. In the absence of live trading data from the London OTC gold market, this 10:1 proxy ratio can continue to be applied as a multiplier to the LBMA London Gold Market daily clearing statistics, which are published every month, and which are always phenomenally high.
For example, average daily clearing volumes in the London Gold Market during January 2017 totalled 20.5 million ounces. That’s the equivalent 638 tonnes of gold cleared per day in London. On a 10:1 trading to clearing multiple, that’s the equivalent of 6,380 tonnes of gold traded per day, or 1.6 million tonnes of gold traded per year.
Since there are only about 6,500 tonnes of gold stored in London, most of which represents static holdings of central banks, ETFs and other holders, the London OTC gold trading activities are totally disconnected from the underlying physical gold holdings. Furthermore, only about 190,000 tonnes of gold have ever been mined throughout history, half of which are estimated to be held in the form of jewellery. Therefore, the trading of nearly 6,500 tonnes of gold per day within the London OTC gold market has nothing to do with the physical gold market, yet perversely, this trading activity drives global gold price discovery and the pricing of physical bullion trades and transactions.
Revealingly, according to the LBMA bullion bankers who established the reporting of London gold clearing statistics, who specifically were the then LMPCL chairman, Peter Fava, and JP Morgan’s Peter Smith, these LBMA gold clearing statistics include trading activities such as “leveraged speculative forward bets on the gold price” and “investment fund spot price exposure via unallocated positions”, activities which are just side-bets on the gold price. See October 2003 article titled “Clearing the Air Discussing Trends and Influences on London Clearing Statistics“, from LBMA Alchemist Issue 32.
In essence, trading activity in the London gold market predominantly represents huge synthetic artificial gold supply, where paper gold trading is deriving the price of gold, not physical gold trading. Synthetic gold is just created out of thin air as a book-keeping entry and is executed as a cashflow transaction between the contracting parties. There is no purchase of physical gold in such a transaction, no marginal demand for gold. Synthetic paper gold therefore absorbs demand that would otherwise have flowed into the limited physical gold supply, and the gold price therefore fails to represent this demand because demand has been channelled away from physical gold transactions into synthetic gold.
Likewise, if an entity dumps gold futures contracts on the COMEX platform representing millions of ounces of gold, that entity does not need to have held any physical gold, but that transaction has an immediate effect on the international gold price. This has real world impact, because many physical gold transactions around the world take this international gold price as the basis of their transactions.
Although gold clearing volumes and the LBMA’s market survey provide some useful inputs into calculating London gold trading volumes, there is very little known publicly about how much physical gold actually trades in the London gold market. This is because the LBMA and its member banks choose not to reveal this information. There is no trade reporting in the London OTC gold market, no reporting of physical gold vault positions, no reporting of the unallocated gold liabilities of LBMA member bullion banks, and no reporting of how much physical gold in total these bullion banks retain to back up their fractional-reserve unallocated gold trading system. However, physical gold trading is by definition an extremely minuscule percentage of average daily trading volumes in the London OTC gold market. For details on the workings of the gold market in London, see BullionStar Infographic the “London Gold Market“.
While one of the three components that comprise the London gold clearing statistics is stated to be “physical transfers and shipments by LPMCL clearing members”, the LBMA doesn’t even see fit to publish a breakdown of these 3 components. This compounds the secrecy and is another example of where bullion banks and central banks keep the global gold market in the dark about how much gold is being physically transferred and shipped.
Question: How do local gold markets around the world use the international gold price?
Local gold markets all around the world look to the international gold price, and take in this gold price, usually quoting their local country gold prices in comparison to the international gold price.
In the physical gold market, product pricing of gold coins and bars is based on a combination of the spot gold price plus a premium. The premium is that part of the product price in excess of the value of the precious metal contained in the coin or bar. Given that the physical gold market is a price taker, physical gold market spot prices feed in from where the price is being discovered, i.e. the international gold price.
For example, the 2017 issue of the Royal Canadian Mint 1 troy ounce Gold Maple Leaf bullion coin is quoted on the BullionStar website at a US dollar price which reflects the US dollar spot price of gold plus a premium.

Gold coin and gold bar premiums are based on a number of factors. Part of the premium will reflect natural minting / refining costs such as fabrication, marketing, distribution and insurance costs. If the products have been distributed through a wholesaler, the premium will reflect a wholesaler mark-up. Another component of a premium is semi-variable and reflects physical market imbalances caused by supply and demand fluctuations. If demand for a gold coin or gold bar is high, its premium will increase. If supply of the product is abundant, the premium would tend to be lower than if in short supply.
In general, premiums on gold coins are higher than those on gold bars, while premiums on large gold coins and gold bars are lower than premiums on smaller gold coins and gold bars.
Question: What contribution does the Shanghai Gold Exchange make to gold price discovery and does the SGE, with its large physical trading, influence the international gold price?
The Shanghai Gold Exchange (SGE) is the world’s largest physical gold exchange and nearly all physical gold bars in China flow through the SGE. Gold trading volumes and gold withdrawal statistics for the SGE are certainly impressive. For the year 2016, total SGE gold trading volumes reached 24,338 tonnes, a 43% increase over the 2015 figure of 17,033 tonnes. SGE trading volumes include physical contracts, deferred contracts, OTC trades settled through the SGE, and also trading volumes on the Shanghai international Gold Exchange (SGEI). In 2016, physical gold withdrawals from the SGE totalled 1,970 tonnes, down 24% from 2015’s withdrawals of 2,596 tonnes, but still huge on an absolute basis because these withdrawals represent actual physical gold taken out of the SGE vaults.
By the end of 2016, the SGEI (International Bourse), which was launched in September 2014, had recorded cumulative trading of nearly 9,000 tonnes of gold. The Shanghai Gold Benchmark Price (a.k.a. Shanghai Gold Fix), which was launched on 19 April 2016, is a gold auction for 1 kilo gold bars of 99.99 purity quoted in RMB. Over the 8 months from launch to end of 2016, the Shanghai Gold Fix had traded 569 tonnes, which equates to over 1.5 tonnes per day on average.
All in all, the SGE has generated impressive physical gold trading volumes (24,338 tonnes for 2016) and withdrawals (1970 tonnes for 2016). For the sake of comparison, compare these annual SGE physical gold trading volumes to the bloated London OTC gold market where trading volumes of approximately the equivalent of 6,500 tonnes of gold per day are the norm. Such a comparison reveals the fractional-reserve nature of the London gold market and the fact that physical transactions can only be a minuscule fraction of the London market.
But does SGE trading affect the international gold price as derived in the London OTC and COMEX markets, or is the SGE a price taker?
The short answer is that the SGE does not influence the international price and the SGE is a price taker. There may be some lagged influence by the SGE on the international price but this would require further study. The Chinese gold market is still a closed gold market with market frictions and distortions. Gold can be imported into China but cannot in general be exported out of China. There is therefore no freedom of movement of gold out of China. Gold imports into China are strictly controlled via import licenses and these licenses are only issued to a small number of Chinese and foreign banks.
But it’s worth looking at SGE premiums to see if changes in SGE premiums ever provide any signalling ability for subsequent changes in the international gold price. SGE premiums arise when the Shanghai gold price trades above the international gold price. SGE premiums are a possible gauge to determine whether SGE trading affects the international gold price. In November and December 2016, SGE premiums rose sharply from less than 0.5% to over 3% which was a period in which gold imports into China surged. However, during that same period, the international gold price fell. So in this case, the expanding SGE premiums had no effect on the international gold price.
That example was just eyeballing, but a recent study by Metals Focus (MF) consultancy, titled “Links Between the Chinese and International Gold Prices” also found that the correlations between changes in the LBMA Gold Price (AM) and SGE premiums are not significant and were in some cases even found to be negative, which in summary means that SGE trading was not affecting the international gold price. MF also calculated some lagged correlations to see if SGE premiums influence subsequent changes in the LBMA Gold Price, due to, for example, “increased shipments of bullion to China over subsequent days”. MF claims that “SGE premiums have a modest but positive and statistically significant impact on future gold price [LBMA Gold Price] moves” however, correlation is not causation. Properly functioning financial markets are supposed to instantaneously reflect pricing information in other markets, not take days to reflect it. There are also too many other variables which could also be responsible for explaining why the LBMA Gold Price moved higher after SGE premiums had previously moved higher.
However, unlike the OTC and COMEX, the Shanghai Gold Exchange is structured around physical gold price discovery. The establishment of a gold exchange in Shanghai was first referenced in China’s 10th Five Year plan in 2001 as an integral part of the nation’s gold liberalisation strategy. Following its launch in 2002, the SGE was quick to promote physical gold ownership and by 2004 was allowing private citizens in China to transact on the Exchange and purchase gold bullion. On the SGE, physical delivery of gold is the norm, not the exception. The SGE has a network of 61 gold vaults in 35 citiesacross China.
This makes the SGE a nature candidate to take the lead in pricing real physical gold and acting as a physical gold price discovery centre if and when the physical gold markets detach from the paper gold markets, and physical gold demand and supply becomes the natural determinant of the international gold price.

Question: What is the significance of the LBMA Gold Price?
The LBMA Gold Price is a twice daily auction for unallocated gold controlled by the LBMA. The final output of the auction is a benchmark gold price. The auction is conducted in US Dollars, however the derived price is also published in 11 other currencies. This auction is the successor to the London Gold Fixing and the benchmark is now a ‘Regulated Benchmark’ under UK financial regulations and is administered by ICE benchmark Administration (IBA), part of the ICE exchange group. But the new auction mechanics are fundamentally similar to the older London Gold Fixing mechanics. The auction opening prices are based on COMEX and London OTC price quotations as well as trading prices at auction opening times, i.e. at 10:30 am and 3:00 pm respectively.
Structurally, the LBMA Gold Price auction has very narrow direct participation, with only a handful of LBMA member bullion banks being authorised by the LBMA to take part. These are the same bullion banks which are the market makers and largest traders in both London OTC gold market trading and in COMEX futures gold trading. The LBMA Gold Price auctions therefore lack broad market participation and is not representative of the broader gold market. The LBMA and ICE Benchmark Administration also refuse to reveal the identities of the auction chairpersons, a refusal which suggests that those now involved have connections to the former scandal tainted London Gold Fixing auction. They also refuse to reveal how the chairperson chooses the opening price for the auctions. See “Six months on ICE – The LBMA Gold Price” for more details.
Not surprisingly, the LBMA gold auctions also settle in unallocated gold, so trading and settlement in the auction is also detached from physical gold markets. Trading volumes in the daily gold auctions usually only reach the equivalent of 1-2 tonnes of unallocated gold transfers, and rarely exceed 3 tonnes. So not only do the LBMA gold auctions not offer wide participation to the thousands of gold trading entities around the world, the volumes traded in the auctions are not representative of the global gold market and the benchmark is therefore not a reliable representation of the global gold market.
Perversely however, the LBMA Gold Price benchmark price is very influential in the gold world in that it is a widely-used valuation source for gold-backed Exchange Traded Funds (ETFs) such as the SPDR Gold Trust and the iShares Gold Trust. Furthermore, it is often used ad a transaction reference price by physical bullion dealers when purchasing physical gold from refineries and suppliers. The LBMA Gold Price is also widely used as a benchmark for valuing financial products such as ISDA gold interest rate swaps, gold options and other gold derivatives, and is even used by other futures exchanges as a reference point on their gold futures contracts, for example the gold futures contract (FGLD) of the Malaysia Derivatives Exchange.
Therefore, this reference price and auction, which is controlled by a handful of bullion banks under the banner of the LBMA, is based on trading synthetic gold, but is referenced widely around the world in countless gold contracts and in countless physical gold markets and retail gold outlets.
Even very large central bank physical gold transactions take this gold fixing reference price derived in London and then use it as a price with which to execute their own independent bi-lateral transactions. For example, when the Swiss National Bank used the Bank for International Settlements (BIS) gold trading desk as its agent to sell hundreds of tonnes of physical gold in the early 2000s, the transaction prices used for the transfers were based on taking the London Gold Fixing price as a reference price. As another example, in 2010, the IMF’s so-called ‘on-market’ gold sales were conducted by a selling agent who also based the sales transfer prices on the London Gold Fixing price. This is the same London Gold Fixing that is currently under investigation in an ongoing New York court class action suit.
Of concern here is that a benchmark that was controlled by a cartel of London-based bullion banks, that was opaque in its operation, and that is currently the subject of a gold price manipulation class action suit, was being used to value very large physical gold transactions. The question must be asked, was this benchmark fit for purpose and to what extent was it representative of the underlying worldwide physical gold market?
Question: So what about outside London and US / NY trading hours. Do other markets contribute more during these other times, for example TOCOM in Japan and MCX in India?
In general, higher trading volumes mean more liquidity to drive price discovery. But since financial markets are integrated, price information rapidly flows between markets due to simultaneously and overlapping trading. Futures markets such as TOCOM in Japan and MCX in India do contribute to gold price discovery, especially at times when the larger markets are not trading, but because these other venues are less liquid, COMEX tends to lead in the lead-lag analysis of futures prices. This finding is according to a study by financial academics from Bangkok University led by Rapeesorn Fuangkasem.
Question: How does gold lending affect the gold price?
The Gold Lending Market is centred in London at the Bank of England. It is here that central banks and commercial bullion banks interact in the execution of ultra-secretive gold lending and gold swaps transactions that increase the available supply of gold. Bullion banks euphemistically refer to this as liquidity provision but these transactions act as a supply overhang on the gold market. Few if any transactional details about the gold lending market are ever made public. If gold lending trade details were market-wide knowledge, their impact would be immediately reflected in the gold price. But they are not. Secrecy about central bank gold lending transactions therefore makes this market informationally inefficient. And when a market is informationally inefficient, the prices in that market do not necessarily reflect the non-public information in that market.
Likewise gold lending and gold swaps are not reported distinct from central bank gold holdings. In the perverse world of central bank accounting policies, gold held and gold lend/swapped is merely reported as one line item of ‘Gold and Gold Receivables’ on central banks’ balance sheets. Therefore, the real state of central bank gold holdings is obscured for any central bank engaged in gold lending or gold swaps.
Gold Lending also provides borrowed physical gold for bullion banks to engage in leveraged fractional-reserve bullion banking and trading, mostly in London where the international spot gold price is predominantly determined. Therefore, gold lending, the leveraged and fractional-reserve nature of gold trading, and the lack of reporting of real central bank gold holdings, all align to have a potentially depressing effect on the gold price as discovered in the London Gold Market.

Question: Given that paper gold markets determine the gold price, then when or how could physical markets begin determining the gold price?”
There are two sets of gold markets – on the one side, the COMEX gold futures and London OTC unallocated gold spot markets which are both ultra leveraged and which both create gold supply out of thin air, and on the other side, the physical gold markets which inherit the gold prices derived in these paper gold markets. Currently the physical gold markets have no effect on the international gold price.
Any shift away from the dominance of gold price discovery in the paper markets to a dominance of gold price discovery in the physical gold markets could only occur via a disconnect between physical gold prices and paper gold prices. The conditions for such a disconnect to occur would only be possible in an environment in which trading behaviour in the paper markets changed and/or the supply-demand balance in the physical gold market became acutely stressed and out of balance.
A shift in trading behaviour in the paper gold markets refers to an increased preference for converting paper gold claims (unallocated positions or gold futures positions) into physical holdings either directly by exercising conversion rights, or indirectly by selling paper gold and then using the proceeds to buy physical gold. Many of these paper claims are held by institutional and wholesale market clients. An increase at the margin in paper gold holders demanding direct conversion of their paper claims into physical gold would probably make such conversion impossible as cash-settlement of futures and unallocated positions would be introduced and made obligatory by regulators and exchange / marketplace providers.
The indirect option would be to sell paper gold and then buy physical bullion on the physical gold market from bullion dealers such as BullionStar. This move into physical gold would raise physical gold demand to such an extent that it could overwhelm available gold supply. At the same time the international gold price would fall because of selling pressure in the paper gold markets, thereby creating a disconnect between the price of paper gold and the price of physical gold, and would make the continued holding of paper gold claims ever riskier.
One trigger that could prompt a shift in sentiment from paper gold to physical gold would be a realization by a critical mass of paper gold holders that physical gold stocks are finite, while paper gold claims are at best fractionally-backed. The acceptance of this reality would be a self-fulfilling prophesy, prompting more and more paper gold claim holders to attempt to rotate into physical gold.
The contemporary physical gold markets have already witnessed sustained flows of physical gold from West to East over the last number of years driven by huge physical gold demand emanating from China, India and much of the rest of Asia. While physical gold flows are dynamic and while gold flows can and sometimes do reverse out of normal recipient destinations such as Hong Kong, Turkey, Dubai and Thailand, this is not true of China and to a large extent is not true of India either, where gold that gets imported does not come back out again. India has imported over 11,000 tonnes of gold since 2001. China has imported 7,200 tonnes of gold since 2001.
As more and more gold goes into destinations such as China and India in quantities which exceed annual gold mine supply, there is less gold available in above ground stockpiles to meet supply deficits. This is akin to a slow bank run on gold. There is also very little gold stored in the London gold market that is not already accounted for by central bank gold holdings or ETF gold holdings. Coupled with this, if in the future the paper gold holders shift to a preference for converting their paper claims into physical gold, this could also be a catalyst for tipping the physical gold market even further into a situation of excess demand and acute supply stress.
In a scenario of a destructing paper gold market, ownership of physical allocated and segregated gold is paramount. This means physical gold that is unencumbered, free from competing claims and titles, and that cannot be lent out or swapped. The paper gold market is already a gigantic bubble which has expanded to an unsustainable size and whose huge fractionally-backed claims are supported by very small physical gold foundations. The unsustainable nature of such a bubble dictates that it’s a matter of when and not if the paper gold bubble bursts. In such a scenario, physical gold ownership is the only thing that can protect against a systemic collapse of the financial system and protect against the destruction of the fractionally-reserved gold banking system.
Footnote:
BullionStar’s ideological belief promotes freedom of speech and liberty. Likewise, we believe that open debate produces improved analysis and research. Indeed, the BullionStar blog platform encourages varied opinions and well-researched ideas. Debate is particularly important when applied to the gold market, a market which is often opaque and deliberately shrouded in secrecy by its influential bullion bank and central bank participants.
BullionStar’s precious metals analyst Koos Jansen has a different view and believes that while paper markets might have some short-term impact on price, the physical gold market is more dominant in gold price formation over the long-term. Due to having taken some time off recently for health reasons, Koos did not contribute to the following article. But he recently summarized his view as follows:
“Due to my research in recent years my opinion has shifted from ‘the gold price is purely set in the paper markets’ to ‘the physical market is more dominant in the long-term whereas the paper market has more impact in the short term’. That’s where I stand now. If central banks suppress the price over years/decades they need to supply physical gold or the paper and physical price would diverge. Potentially there is a combination of paper and physical schemes at work.”
Koos Jansen will, at a later point in time, present his view by answering and publishing the same or similar questions on the BullionStar website.
BullionStar
E-mail BullionStar on: support@bullionstar.com

Stock Trading Alert originally sent to subscribers on March 30, 2017, 6:58 AM.
Briefly: In our opinion, speculative short positions are favored (with stop-loss at 2,410, and profit target at 2,200, S&P 500 index).
Our intraday outlook is bearish, and our short-term outlook is bearish. Our medium-term outlook remains neutral, following S&P 500 index breakout above last year’s all-time high:
Intraday outlook (next 24 hours): bearish
Short-term outlook (next 1-2 weeks): bearish
Medium-term outlook (next 1-3 months): neutral
Long-term outlook (next year): neutral
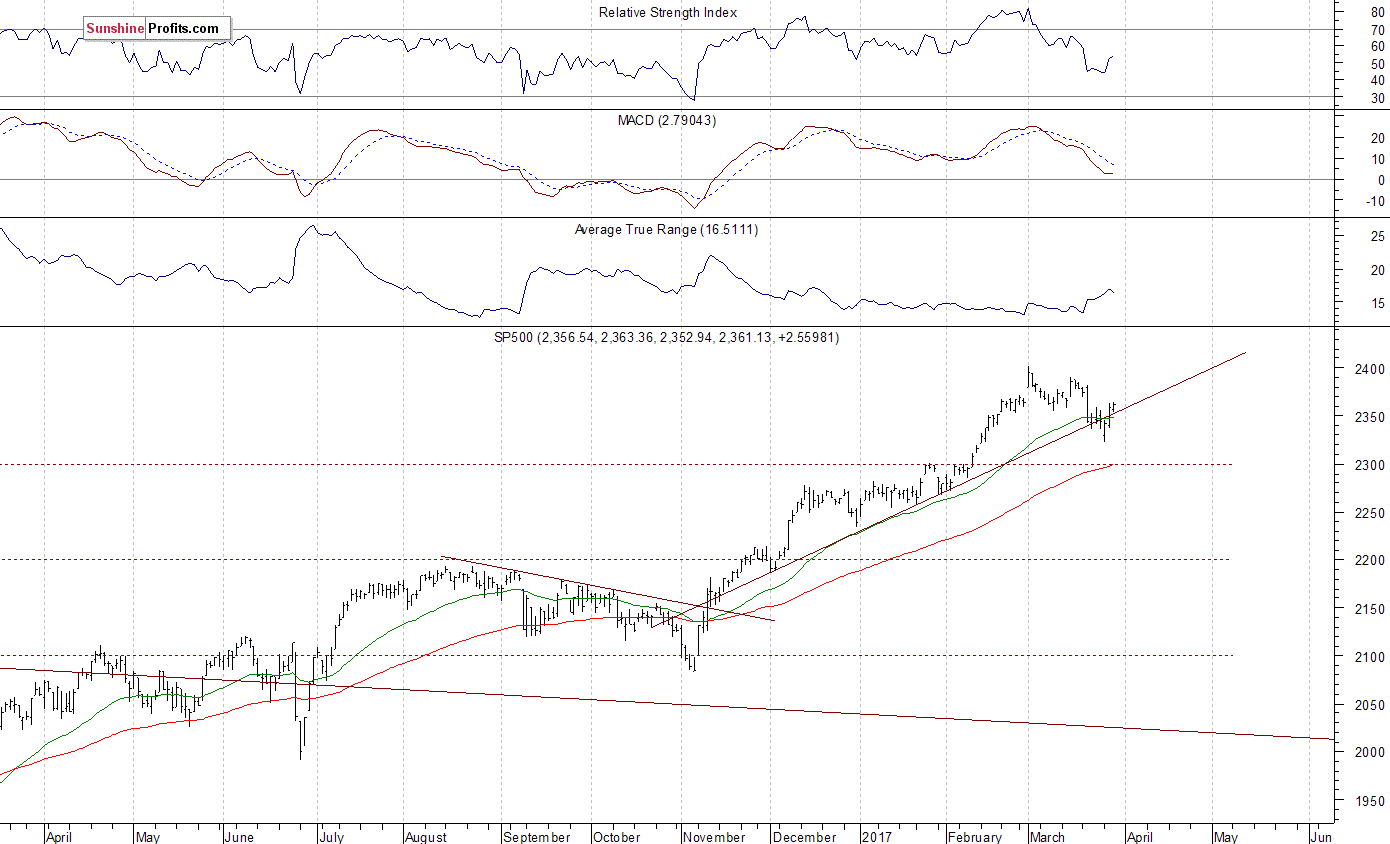
The main U.S. stock market indexes were mixed between -0.2% and +0.4% on Wednesday, as investors continued to hesitate following last week’s move down. The S&P 500 index broke above its recent local highs on Tuesday, as it retraced some of the decline. It is currently less than 2% below March 1 all-time high of 2,400.98. The Dow Jones Industrial Average broke below 20,700 again, and relatively stronger technology Nasdaq Composite index got closer to the level of 5,900. Overall, stocks retraced some of their recent move down off new record highs recently. Is this a new uptrend or just upward correction within new medium-term downtrend? The nearest important level of support of the S&P 500 index remains at around 2,335-2,340, marked by some previous local lows. The next support level is at 2,320, marked by February 13 daily gap up of 2,319.23-2,321.42 and Monday’s local low. The support level is also at around 2,300, marked by December – January local highs. On the other hand, the nearest important level of resistance is now at around 2,360-2,365, marked by previous level of support. The next resistance level is at 2,390-2,400, marked by all-time high. We can see some short-term volatility following four-month-long rally off last year’s November low at around 2,100. Is this a topping pattern before downward reversal? The uptrend accelerated on March 1 and it looked like a blow-off top pattern accompanied by some buying frenzy. The S&P 500 index continues to trade along its medium-term upward trend line, as we can see on the daily chart:
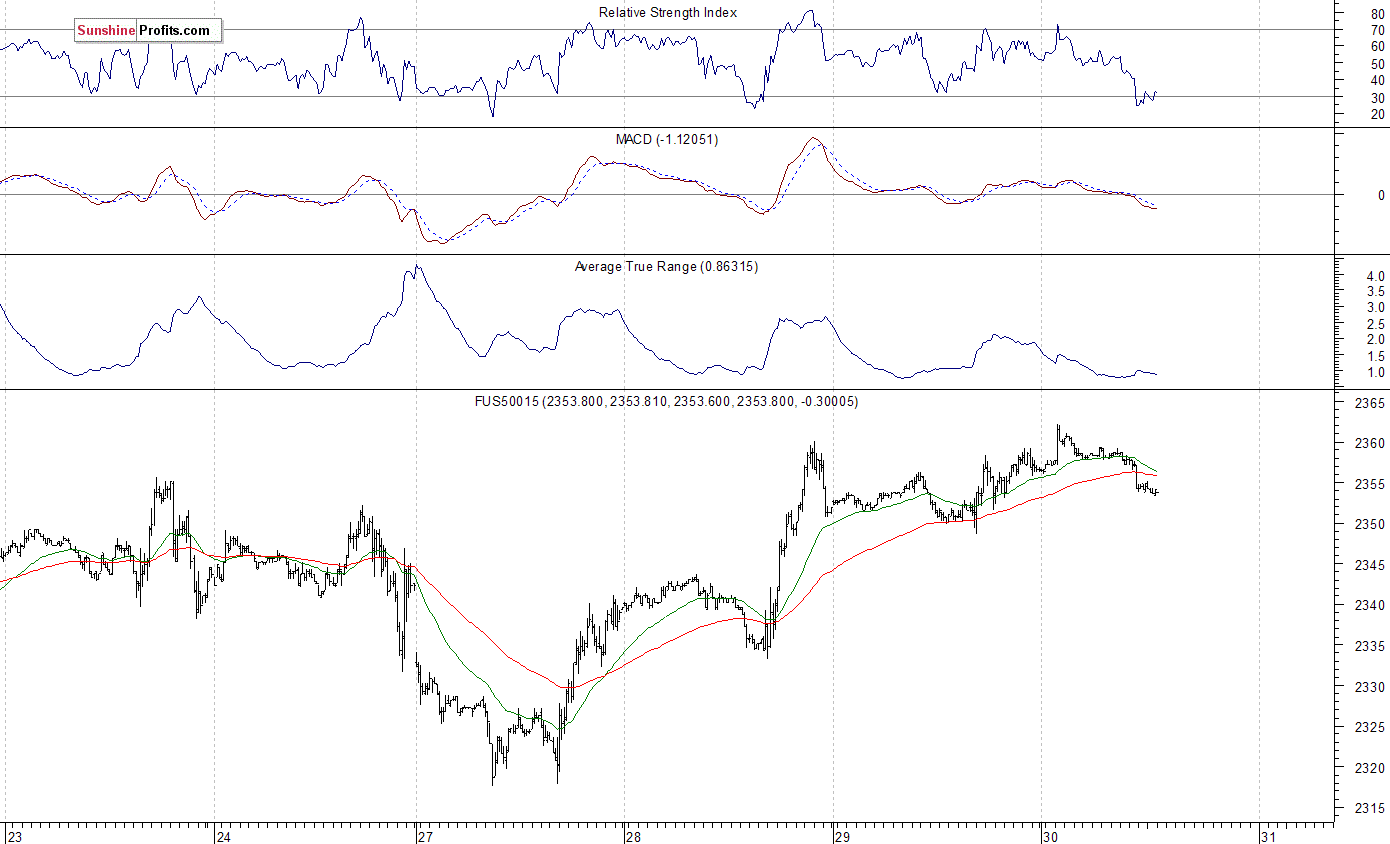
Expectations before the opening of today’s trading session are virtually flat, with index futures currently down 0.1%. The European stock market indexes have been mixed so far. Investors will now wait for some economic data announcements: GDP – Third Estimate number, Initial Claims at 8:30 a.m. The market expects that the U.S. Gross Domestic Product grew 2.0% in the fourth quarter of 2016. The S&P 500 futures contract trades within an intraday downtrend, as it retraces some of its recent move up. The nearest important level of resistance is at around 2,360-2,365, marked by local high and some previous short-term consolidation. The resistance level is also at 2,380-2,400, marked by topping consolidation along new record high. On the other hand, support level is at 2,340, marked by previous level of resistance. The next support level is at 2,300-2,320, marked by previous local high, Monday’s local lows. The market trades within a short-term consolidation, following last week’s move down. Will it continue lower, or is this just a quick downward correction before another medium-term leg higher?
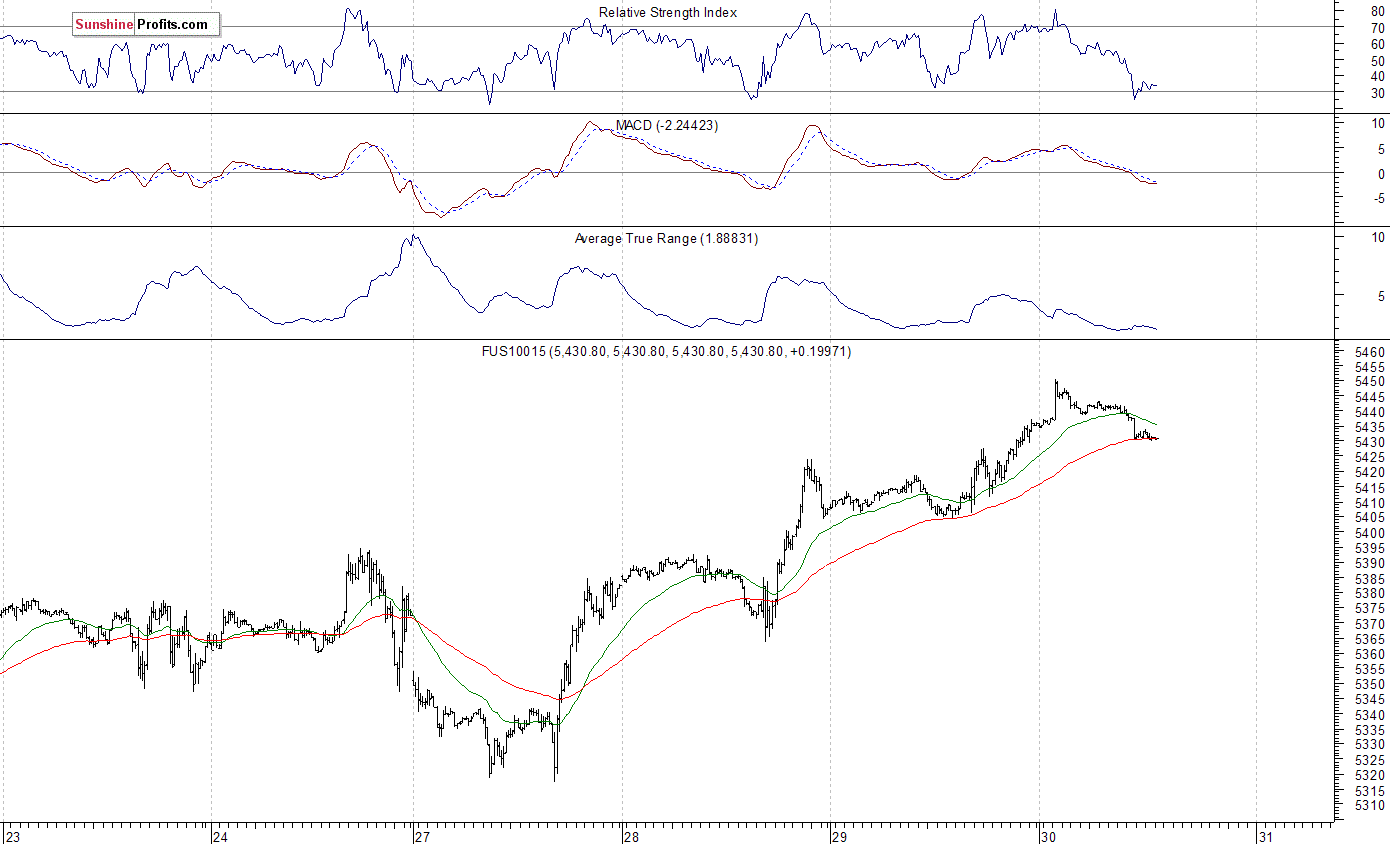
The technology Nasdaq 100 futures contract is relatively stronger than the broad stock market, as it currently trades above 5,400 mark. It has reached new record high slightly above the level of 5,450. The nearest important level of resistance is at around 5,440-5,450, marked by all-time high. On the other hand, support level is at 5,370-5,400, marked by previous level of resistance. The next important level of support is at 5,300-5,320, marked by Monday’s local lows, as the 15-minute chart shows:
Concluding, the broad stock market continued to fluctuate on Wednesday, as the S&P 500 remained slightly below its Tuesday’s daily high. Is this a new uptrend or just upward correction within an almost month-long downtrend? There have been no confirmed short-term positive signals so far. We still can see medium-term overbought conditions along with negative technical divergences. Therefore, we continue to maintain our speculative short position (opened on February 15 at 2,335.58 – opening price of the S&P 500 index). Stop-loss level is at 2,410 and potential profit target is at 2,200 (S&P 500 index). You can trade S&P 500 index using futures contracts (S&P 500 futures contract – SP, E-mini S&P 500 futures contract – ES) or an ETF like the SPDR S&P 500 ETF – SPY. It is always important to set some exit price level in case some events cause the price to move in the unlikely direction. Having safety measures in place helps limit potential losses while letting the gains grow.
To summarize: short position in S&P 500 index is justified from the risk/reward perspective with the following entry prices, stop-loss orders and profit target price levels:
S&P 500 index – short position: profit target level: 2,200; stop-loss level: 2,410
S&P 500 futures contract (June) – short position: profit target level: 2,197; stop-loss level: 2,407
SPY ETF (SPDR S&P 500, not leveraged) – short position: profit target level: $220; stop-loss level: $241
SDS ETF (ProShares UltraShort S&P500, leveraged: -2x) – long position: profit target level: $15.47; stop-loss level: $12.98
Thank you.
Paul Rejczak
Stock Trading Strategist
Stock Trading Alerts


-
I know Mike is a very solid investor and respect his opinions very much. So if he says pay attention to this or that - I will.
~ Dale G.
-
I've started managing my own investments so view Michael's site as a one-stop shop from which to get information and perspectives.
~ Dave E.
-
Michael offers easy reading, honest, common sense information that anyone can use in a practical manner.
~ der_al.
-
A sane voice in a scrambled investment world.
~ Ed R.
Inside Edge Pro Contributors

Greg Weldon

Josef Schachter

Tyler Bollhorn

Ryan Irvine

Paul Beattie

Martin Straith

Patrick Ceresna

Mark Leibovit

James Thorne

Victor Adair