
Stocks & Equities
“Pull” is a term used in shooting sporting clays, which are supposed to represent real birds and sharpen the shooter’s ability to actually hunt live birds. The term is yelled by the shooter to tell the person operating the trap to launch a sporting clay. “Pull” comes from an era long gone by when they actually had real birds in cages and the shooter would say “pull” to have the cage cord pulled and release the bird. The term “pull,” however, took on a whole new meaning last Friday when Speaker Ryan “pulled” the Republican healthcare bill (H.R. 1628) from consideration. I had literally said on CNBC earlier that day (as paraphrased): I lived in Washington D.C., and still have a pretty good network on Capitol Hill and typically what happens, if they don’t think a bill will pass, they pull it (read: withdraw it). But, there is NOTHING typical going on in D.C. these days! I also opined on the same show that – I was hearing that H.R.1628 was a few votes short of the ability to pass. Even if it had passed there would have been major revisions to it in the Senate. I guess it was once again the Russians that influenced the death of H.R. 1628 since they are being blamed for just about everything else. The question now becomes, “How will the various markets view Friday’s Foil?”
Speaking to many media types late Friday afternoon I suggested that a lot of technical damage has been done to the charts during the week. The S&P 500 (SPX/2343.98) broke down from its trading range of 2350 – 2400 that has existed since mid-February. The SPX has also closed decisively below its 20-day moving average (DMA) that has served as a support level since last December (Chart 1). Clearly, the gap in the price chart created by the Fed Fling (March 15, 2017) on the rate ratchet has now been filled raising the question, “Will the upside gap that occurred on February 10, 2017, to February 13, 2017, between 2311.08 and 2311.10 be filled?” Moreover, will the Trump agenda disappointments lead to a 0.328 Fibonacci retracement of the recent rally toward a downside target price of 2278? To be sure, the smart money is “betting” that way given the divergence between the CBOE SKEW Index and the Volatility Index’s (VIX) SKEW (Chart 2). As defined by the CBOE:
The CBOE SKEW Index (“SKEW”) is an index derived from the price of S&P 500 tail risk. Similar to VIX®, the price of S&P 500 tail risk is calculated from the prices of S&P 500 out-of-the-money options. SKEW typically ranges from 100 to 150. A SKEW value of 100 means that the perceived distribution of S&P 500 log-returns is normal and the probability of outlier returns is therefore, negligible. As SKEW rises above 100, the left tail of the S&P 500 distribution acquires more weight, and the probabilities of outlier returns become more significant. One can estimate these probabilities from the value of SKEW. Since an increase in perceived tail risk increases the relative demand for low strike puts, increases in SKEW also correspond to an overall steepening of the curve of implied volatilities, familiar to option traders as the “SKEW”.
Ladies and gentlemen, the current CBOE SKEW is around 145, and well above what the CBOE website describes as, “As SKEW rises above 100, the left tail of the S&P 500 distribution acquires more weight, and the probabilities of outlier returns become more significant.” Further, the VIX SKEW has diverged with the CBOE SKEW suggesting something BIG is getting ready to happen in the equity markets. Additionally, there is still plenty of “internal energy” to foster such a move, but unfortunately, our internal energy indicator does not tell us if that energy is going to be released on the upside or the downside. Our hunch remains that it will be released on the downside for the aforementioned reasons.
…related from Financial Sense:

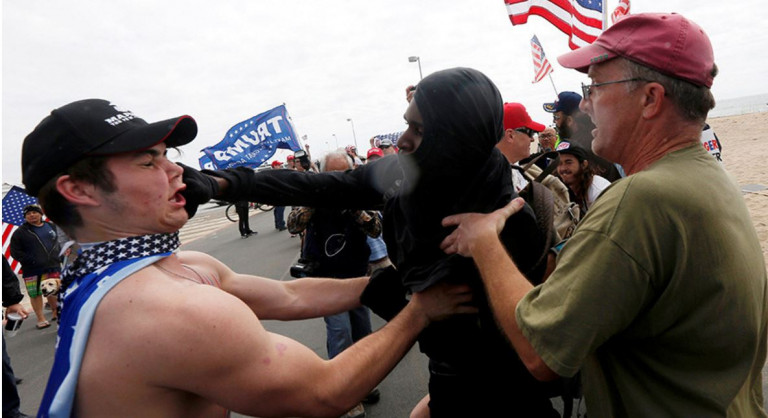 Civil Unrest is rising around the world. In the USA, demonstrations have been organized to support Donald Trump in a counter-demonstration move against the Obama/Soros uprising. In Los Angeles, Trump supporters were confronted by opponents of Trump and the two groups ended in violence. The Obama/Soros supporters were partially traditionally masked.
The Trump supporters were trying to organize marches in about 40 US cities for Sunday. However, many cities were denying the Trump supporters the right to even assemble. In Philadelphia, the police stopped such an event they alleged for safety, as the news page Philly.com reported.
…also from Martin:

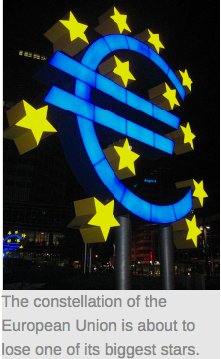 It’s been nine months since Britain stunned the world by voting to leave the European Union.
After decades of accepting the European Union’s burdensome regulations – one after another – the British people finally said enough is enough.
Now, the EU’s days of stifling the economic growth of Britain – and other countries that joined the union but not the currency – are finally coming to an end.
Last week, Britain moved one step closer to taking back its sovereignty, and escaping the burdensome regulations of the EU, when it was announced that Prime Minister Theresa May plans to invoke Article 50 of the Lisbon Treaty on Wednesday, March 29.
Article 50 is the mechanism for quitting the European Union, thus launching a chess match: Pitting the U.K.’s desire for a trade deal – while regaining power over immigration and lawmaking – against the EU’s view that Britain must not benefit from Brexit.
Britain is the world’s sixth-largest economy, and it’s been more than 40 years since the U.K. joined the European Union. So this separation won’t be a piece of cake.
In fact, the U.K. will have to pay a bill of about $62 billion when it leaves the European Union, warned Jean-Claude Juncker, the president of the European Commission, the EU’s executive branch. While Britain prepares to start Brexit negotiations, the EU has already been tallying the U.K.’s share of liabilities such as pensions for EU officials, infrastructure projects, and the bailout of Ireland.
I don’t know about you, but $62 billion is a heck of a divorce settlement!
Once Article 50 is invoked, the two sides have two years to come to terms on a trade deal.
And a lot can happen in two years.
In fact, if the negotiations collapse, May says she’ll walk away without a new commercial framework in place rather than accept a bad deal. All this makes the likelihood of a disruptive breakup “troublingly high.”
Brexit is just the beginning
The EU is already on borrowed time, same goes for the euro.
And the U.K.’s exit is just the beginning. There are still plenty more disruptions looming …
==> The elections in France – along with right-winged political rhetoric gaining strength in other countries across the eurozone – has the EU on life support.
==> And don’t forget about the debt problems: Once again, the Greek government is set to run out of money. In a few months, it will need a fresh bailout from the EU and the International Monetary Fund. After nine years of trying to fix Greece, the situation has only gotten worse. Even if the Greeks do end up with another bailout, it will only be another stay of execution.
==> The EU also has an identity crisis – and it’s not just the refugee crisis causing the divide. There is also a political bias between the Northern and Southern European countries. Dutch Finance Minister Jeroen Dijsselbloem recently inflamed the hostilities by making insulting remarks about Southern European culture. The remarks provoked former Italian Prime Minister Matteo Renzi to demand Dijsselbloem’s resignation as president of the Eurogroup, a coalition of eurozone finance ministers.
Bottom Line: The Brexit fiasco is finally coming home to roost. And that’s going to continue to wreak havoc on the European Union. Mark my words: There will be pitfalls ahead for investors who don’t know what they’re doing. Do you?
Good investing,
Mike Burnick
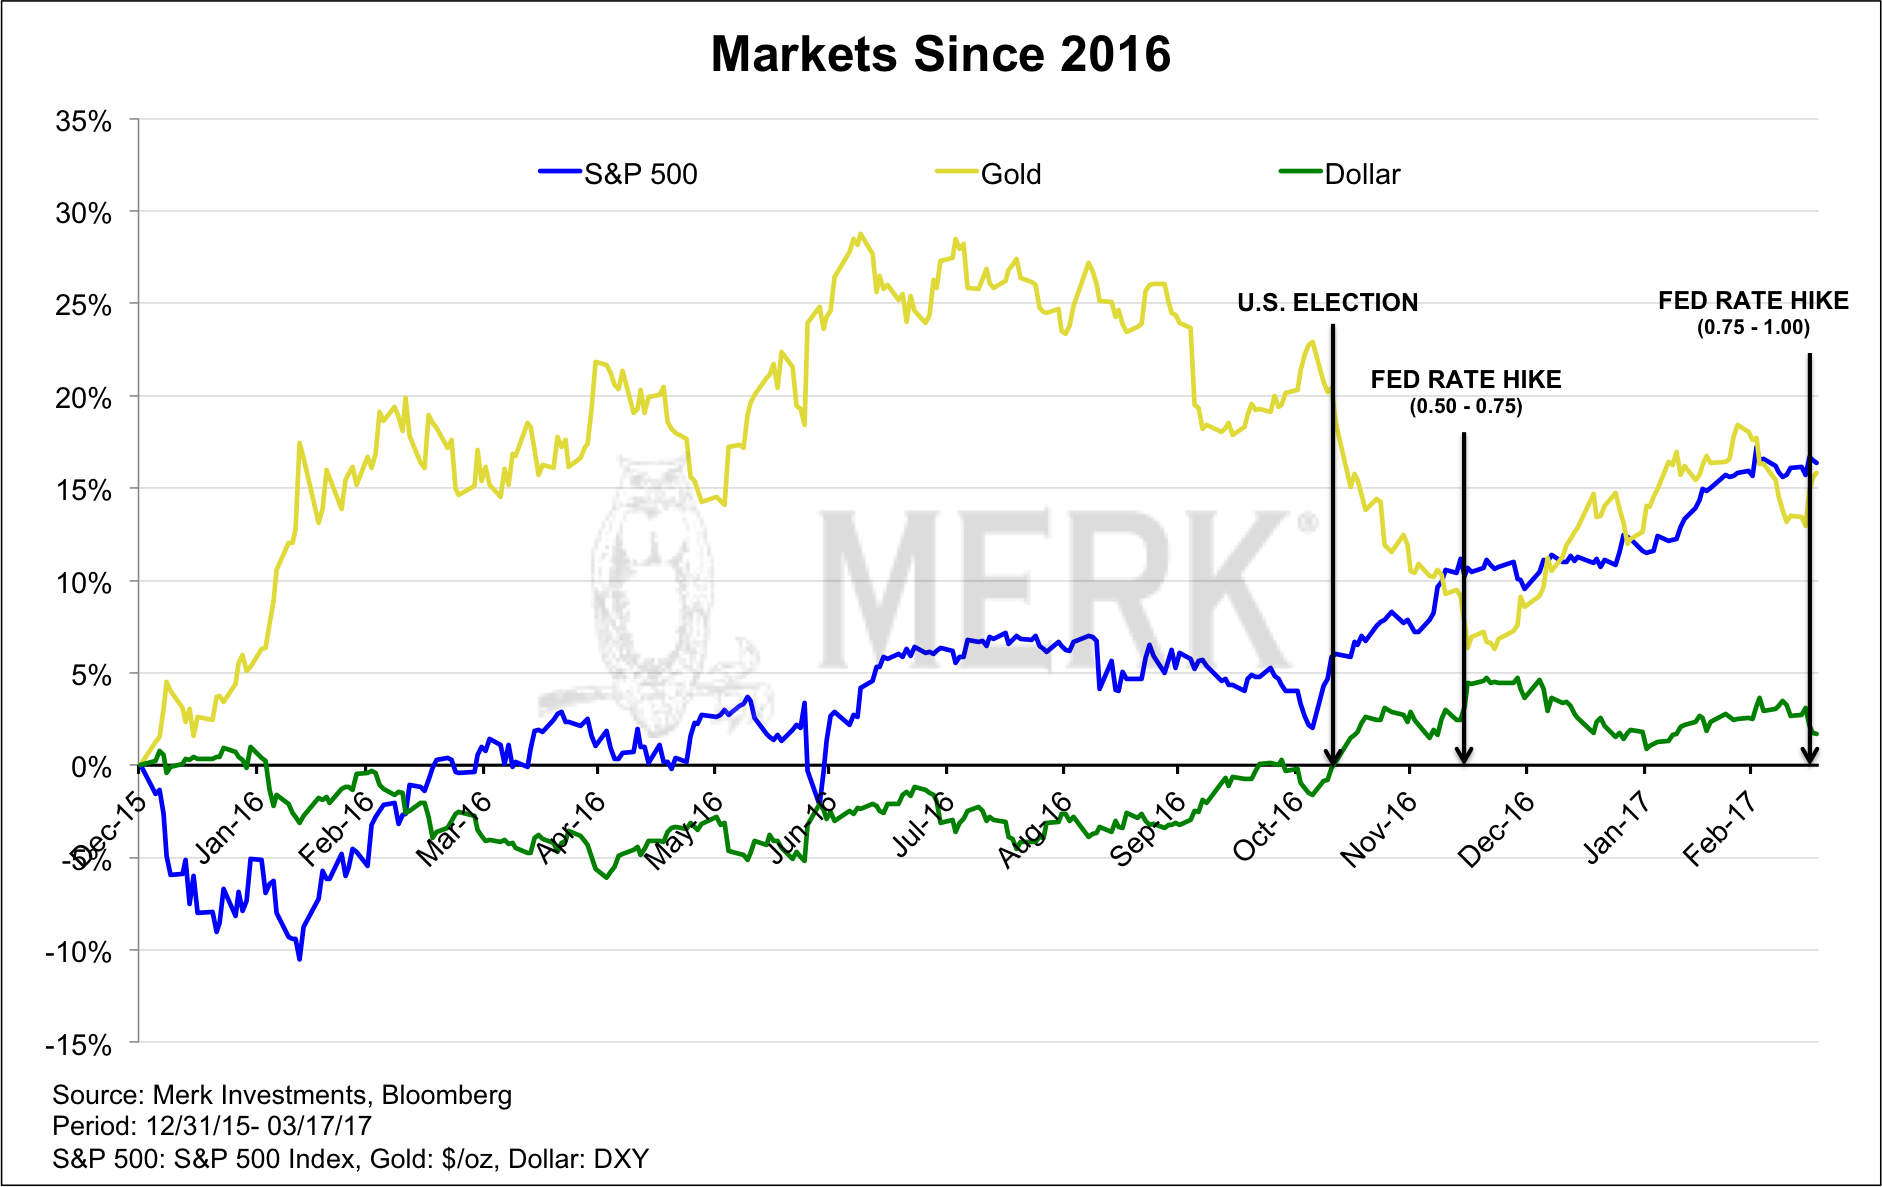
Two rate hikes since last year have weakened the dollar. Why is that, and what’s ahead for dollar, currencies & gold? And while we are at it, we’ll chime in on what may be in store for the stock market…
Stocks…
The chart above shows the S&P 500, the price of gold and the U.S. dollar index since the beginning of 2016. The year 2016 started with a rout in the equity markets which was soon forgotten, allowing the multi-year bull market to continue. After last November’s election we have had the onset of what some refer to as the Trump rally. Volatility in the stock market has come down to what may be historic lows. Of late, many trading days appear to start on a down note, although late day rallies (possibly due to retail money flowing into index funds) are quite common.
Where do stocks go from here?..
….continue reading about Stocks, Bonds, Currencies & Gold HERE
..also:


-
I know Mike is a very solid investor and respect his opinions very much. So if he says pay attention to this or that - I will.
~ Dale G.
-
I've started managing my own investments so view Michael's site as a one-stop shop from which to get information and perspectives.
~ Dave E.
-
Michael offers easy reading, honest, common sense information that anyone can use in a practical manner.
~ der_al.
-
A sane voice in a scrambled investment world.
~ Ed R.
Inside Edge Pro Contributors

Greg Weldon

Josef Schachter

Tyler Bollhorn

Ryan Irvine

Paul Beattie

Martin Straith

Patrick Ceresna

Mark Leibovit

James Thorne

Victor Adair