
Currency
 Summary
Here is a new list ranking currencies based on relative purchasing power. Overvalued and the least undervalued currencies are at the top. The most undervalued currencies are at the bottom.
This list is combined with a list of currencies ranked on differences in interest rate with the US. Based on these numbers, I discuss some carry trades.
Finally, I will discuss developments and opinions for a number of currencies with relative purchasing power in mind.
….related:
Some Thoughts About The Recent Price Action
Summary
Dollar losses appear to be part of a larger adjustment in the capital market.
Yellen, Dudley, a reversal higher in the price of oil, and the passage of healthcare reform by the US House of Representatives could help underpin the dollar.
The dollar bloc has lagged in recent days.
The gains the US dollar scored last month have been largely unwound against the major currencies. The dollar’s losses against the yen are a bit greater, and it returned to levels not seen late last November.
The downdraft in the dollar appears part of a larger development in the capital markets that has also seen the US 10-year yield slide 25 bp in less than two weeks.

Sent to subscribers on March 23, 2017, 6:56 AM
Briefly: In our opinion, speculative short positions are favored (with stop-loss at 2,410, and profit target at 2,200, S&P 500 index).
Our intraday outlook is bearish, and our short-term outlook is bearish. Our medium-term outlook remains neutral, following S&P 500 index breakout above last year’s all-time high:
Intraday outlook (next 24 hours): bearish
Short-term outlook (next 1-2 weeks): bearish
Medium-term outlook (next 1-3 months): neutral
Long-term outlook (next year): neutral
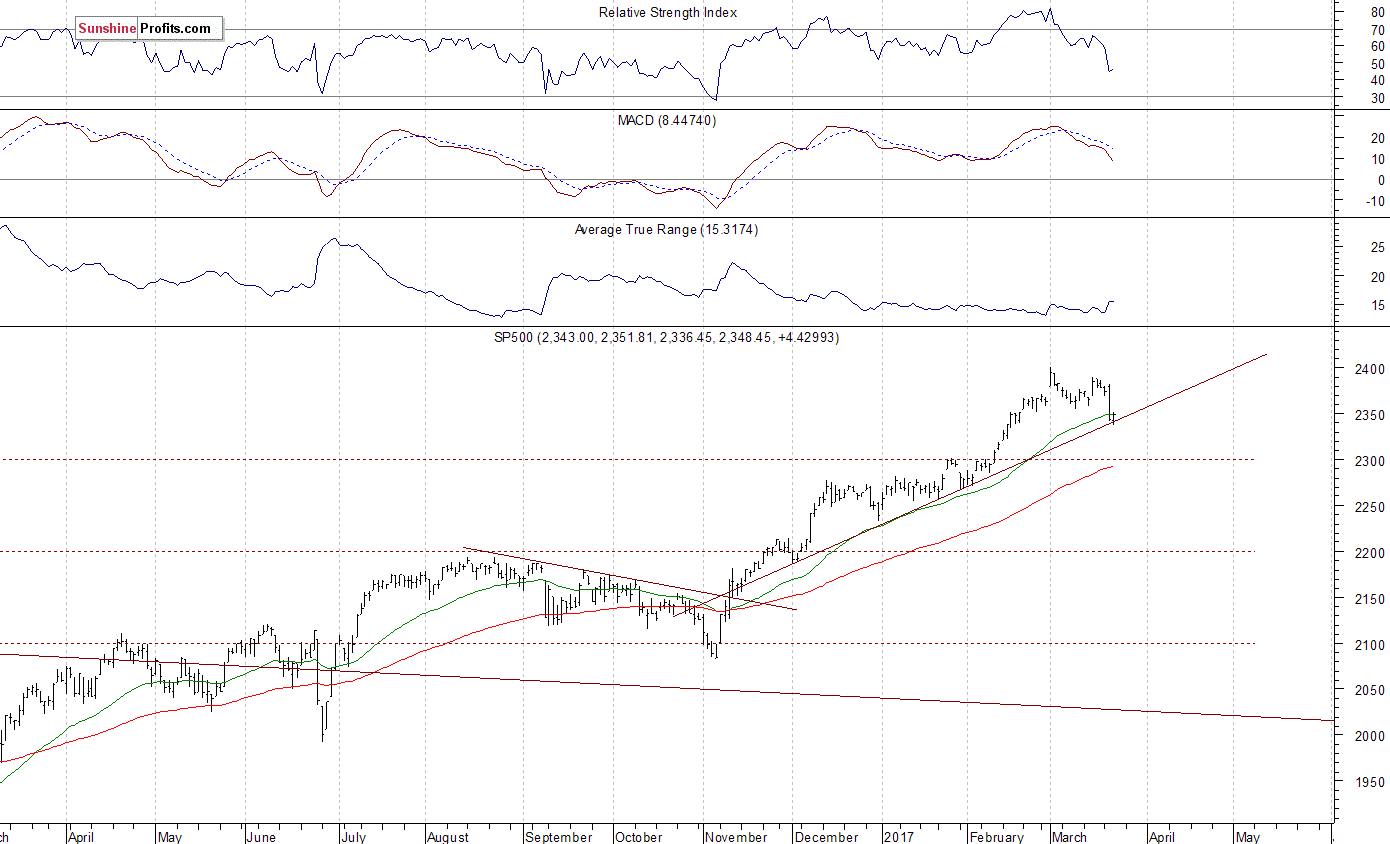
The U.S. stock market indexes were mixed between 0.0% and +0.7% on Wednesday, as investors hesitated following Tuesday’s relatively big move down. Traders took profits off the table after last week’s interest rates increase, among others. The S&P 500 index remained more than 2% below its March 1 all-time high of 2,400.98. The Dow Jones Industrial Average continued to trade below 20,700 mark, and the technology Nasdaq Composite index bounced by 0.5%, as it broke above the level of 5,800 again. Overall, stocks continued to trade below their almost month-long consolidation along new record highs. Is this just correction or a new downtrend? For now, it looks like a downward correction within medium-term uptrend. The nearest important level of support of the S&P 500 index is at around 2,335-2,340, marked by some previous local lows. The next support level remains at 2,320, marked by February 13 daily gap up of 2,319.23-2,321.42, among others. The support level is also at around 2,300, marked by December – January local highs. On the other hand, the nearest important level of resistance is now at around 2,350-2,360, marked previous level of support. The next resistance level is at 2,390-2,400, marked by all-time high. We can see some short-term volatility following four-month-long rally off last year’s November low at around 2,100. Is this a topping pattern before downward reversal? The uptrend accelerated on March 1 and it looked like a blow-off top pattern accompanied by some buying frenzy. The S&P 500 index trades at its five-month-long upward trend line, as we can see on the daily chart:
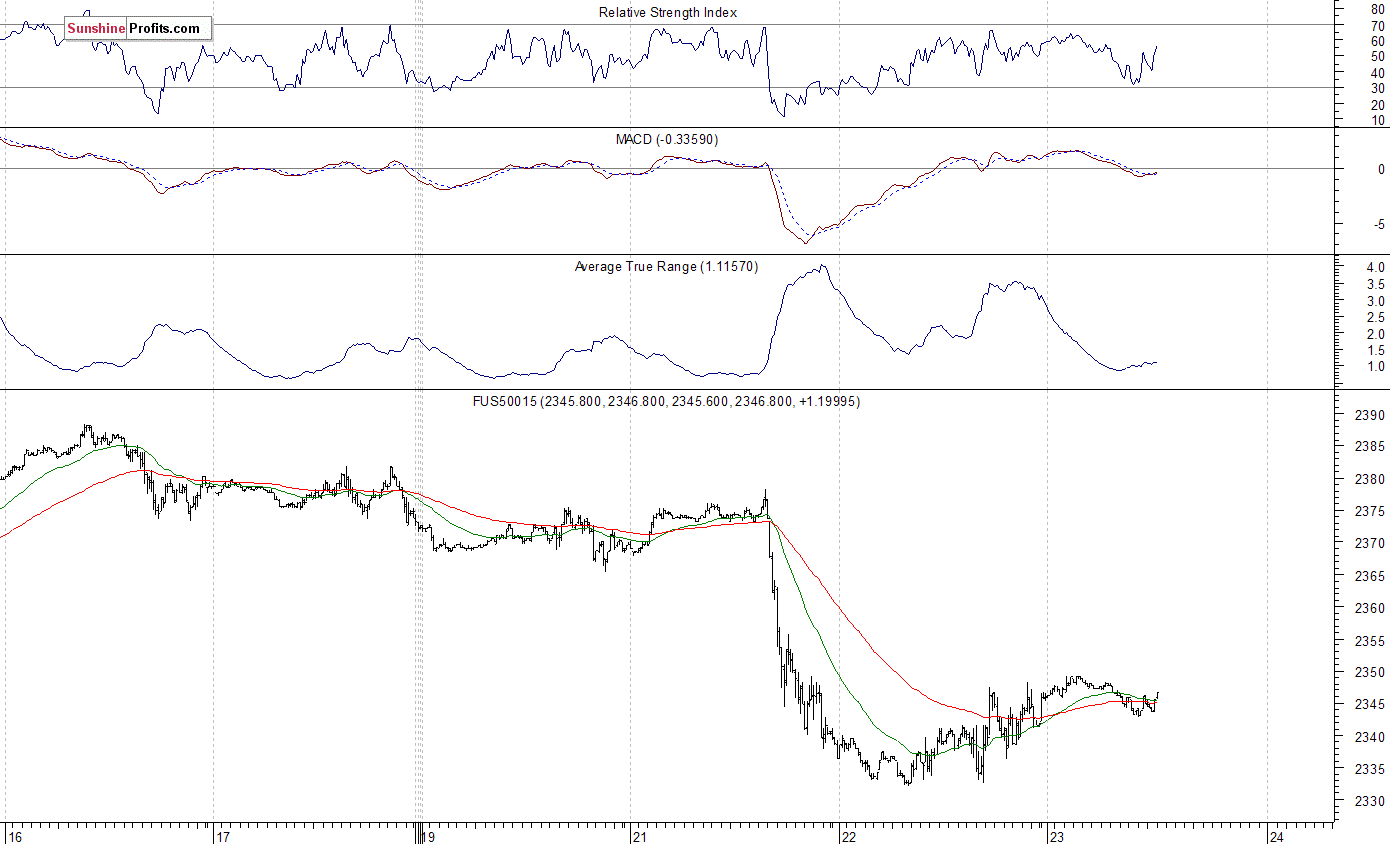
Expectations before the opening of today’s trading session are slightly positive, with index futures currently between 0.0% and +0.2% vs. their yesterday’s closing prices. The European stock market indexes have been mixed so far. Investors will now wait for some economic data announcements: Initial Claims at 8:30 a.m., New Home Sales at 10:00 a.m. The market expects that New Home Sales were 560,000 in February, slightly up from last month’s number of 555,000. The S&P 500 futures contract trades within an intraday consolidation, following overnight move down. It has retraced some of its yesterday’s rebound off support level at 2,330-2,335. The nearest important level of resistance is at around 2,350, marked by short-term local high. The next resistance level is at 2,360-2,365, marked by previous consolidation. On the other hand, support level is at 2,330, and the next support level remains at 2,300-2,320, among others. The market trades within a short-term downtrend, following breakdown below recent trading range. Will it continue lower, or is this just a quick downward correction within five-month-long rally off November low?
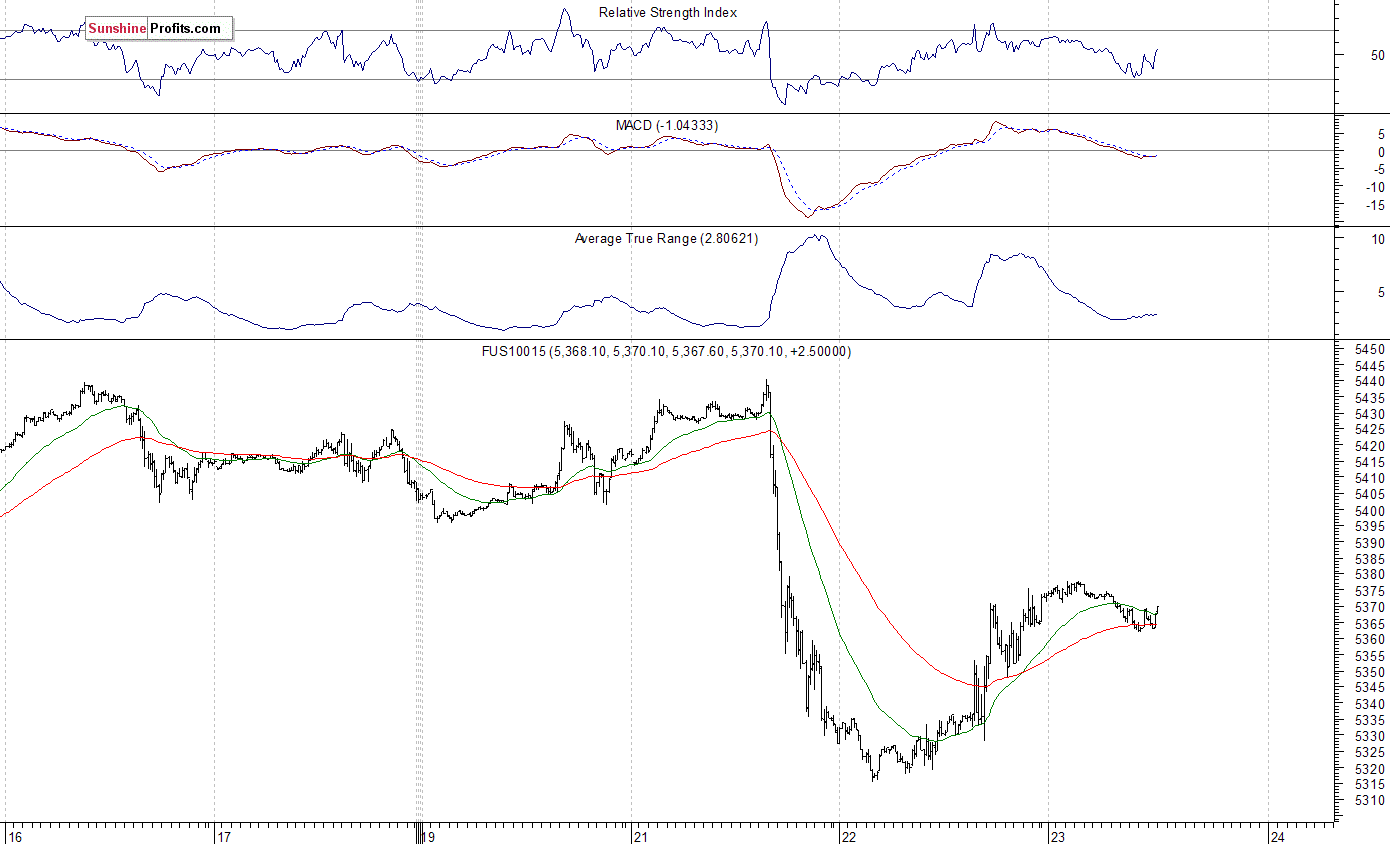
The technology Nasdaq 100 futures contract was relatively weaker than the broad stock market on Wednesday. However, it has retraced some of its weakness yesterday. The market has reached the resistance level of 5,380-5,400. The nearest important level of support is now at around 5,350, marked by some short-term fluctuations. The next support level remains at 5,300-5,320, as the 15-minute chart shows:
Concluding, the broad stock market retraced some of its Tuesday’s decline yesterday, as the S&P 500 index gained 0.2%. Is this just a quick rebound before another leg down or upward reversal? There have been no confirmed short-term positive signals so far. We still can see medium-term overbought conditions along with negative technical divergences. Therefore, we continue to maintain our speculative short position (opened on February 15 at 2,335.58 – opening price of the S&P 500 index). Stop-loss level is at 2,410 and potential profit target is at 2,200 (S&P 500 index). You can trade S&P 500 index using futures contracts (S&P 500 futures contract – SP, E-mini S&P 500 futures contract – ES) or an ETF like the SPDR S&P 500 ETF – SPY. It is always important to set some exit price level in case some events cause the price to move in the unlikely direction. Having safety measures in place helps limit potential losses while letting the gains grow.
To summarize: short position in S&P 500 index is justified from the risk/reward perspective with the following entry prices, stop-loss orders and profit target price levels:
S&P 500 index – short position: profit target level: 2,200; stop-loss level: 2,410
S&P 500 futures contract (March) – short position: profit target level: 2,197; stop-loss level: 2,407
SPY ETF (SPDR S&P 500, not leveraged) – short position: profit target level: $220; stop-loss level: $241
SDS ETF (ProShares UltraShort S&P500, leveraged: -2x) – long position: profit target level: $15.47; stop-loss level: $12.98
Thank you.
Paul Rejczak
Stock Trading Strategist
Stock Trading Alerts
….also: Waning Trump’s Rally and Gold

Headlines are a buzz with this week’s French presidential debate where candidate Emmanuel Macron came out on top.
Market sentiment improved, evidenced by gains in the Euro currency and a narrowing yield differential between French and German government bonds.
This also follows last week’s election in the Netherlands where voters denied far-right populist candidate Geert Wilders in favor of liberal conservative Prime Minister Mark Rutte.
Because of these events, current European leadership hopes to avoid another Brexit or U.S. election outcome.
But, the European train wreck is not over by any stretch. Take a look …
 How’d we get here?
Years of aggressive financial risk-taking, overspending and burgeoning debts led to financial panic, bailouts and rising social unrest.
Between 2014 and 2016, the euro sank fast, taking much of Europe down with it. The trillion-dollar bailouts and money-printing operations engineered by Europe’s strongest economies only made the situation worse.
And volatile political conditions are fueling extreme right-wing movements that pushed the political landscape further to the right.
Consider recent headlines …
-
Energized populist movement fueling fascism, with some going as far as “embracing World War II era policies.”
-
Neo-fascists winning regional offices in Slovakia.
-
Turkish President Erdogan referring to European leaders as Nazi’s.
With several political elections across Europe in the coming months, many strongmen choose to ramp up nationalist rhetoric.
This too will not end well.
Consider the French election, where Marine Le Pen broadens her appeal and puts a presidential victory in reach.
While support for far-right populist candidate Le Pen may be ticking lower, so was Donald Trump’s going into the November 2016 election.
It’s too early to say if the populist tide may turn away from the Brexit movement. But it doesn’t matter.
Reforms across the euro zone are needed right now to restore confidence. But that’s going to be a tough row to hoe, especially with so many deep-rooted beliefs over what should be done. Here are just a few:
-
Common market underpinned by substantial subsidies for poorer countries.
-
Direction on immigration.
-
Managing very different growth rates across the European Union.
And don’t forget the lingering debt load that has Europe drifting closer to a sovereign debt crisis.
The fact is, Europe is splintering and going bust.
And as the final shoe drops, there will be massive capital flight into safe-havens such as U.S. stocks and AAA Corporate debt.
Like Larry said: Prepare for a five-year roller coaster ride through hell.
The best way to do this is to buy blue-chip U.S. stocks on pullbacks and buy gold when the signal comes — I’ll tell you when.
Good Investing,
Mike Burnick
….also:
Fanaticism, Stock Market Crash 2017 or Continuation of Bull Market
“Technically Speaking” is a regular Tuesday commentary updating current market trends and highlighting shorter-term investment strategies, risks, and potential opportunities.
In last week’s post, I did a complete sector and major market review. Not much has changed in the past week given the very quiet activity that has persisted. This lack of volatility, while not unprecedented, is extremely long in duration as noted in past weekend’s newsletter, “An Unexpected Outcome:”
“Speaking of low volatility, the market has now gone 108-trading days without a drop of 1% for both the Dow and the S&P 500. This is the longest stretch since September of 1993 for the Dow and December of 1995 for the S&P 500.”
The issue becomes, of course, which way the market breaks when volatility returns to the market. Over the course of the last three years, in particular, those breaks have been to the downside as shown below.
…also, Michael’s Interview with Lance Roberts March 18th:

 QUESTION: Many people argue it is capitalism which is collapsing not socialism. How would your respond?
ANSWER: Those people who say this is a failure of capitalism and not socialism simply are trying to come up with an excuse as to why their dreams are not coming true. Democrats champion the poor and middle class but run to the rich for money. Why would bankers and hedge funds as well as Hollywood support Democrats if they are really hated so much? The answer is rather simple. They can bribe them for loopholes and favors.
…also:
 Why Obamacare is the Biggest Fraud in American History & Was Designed to Be Exactly That!
When we look at the markets and try to ascertain the long-term direction, we must look at politics closely, for this holds the key. First, this is a Private Wave and that means the confidence in government is collapsing. Hence, the question for the direction of stocks, gold, interest rates, and the world economy, all hinges on how fast the perception of government collapsed on a global scale. Both sides of the aisle are corrupt and rotten to the core. Republican or Democrat, they are all in this for what they personally can grab and they are incapable of doing anything right for society because power corrupts.
It was the Democrats who came up with the Social Security scheme and designed it to be exactly as a fraud that anyone in the private sector would do to jail for. They used the Ponzi Scheme model where you take money from one person and pay another so they think they have a profit and more and more people come to invest. Here they would impose a tax upon the younger generation to pay for the older generation while telling people they were paying into a retirement fund. Of course, Congress used the money to fund spending for other things and stuffed the fund with government bonds preventing it from ever investing.


-
I know Mike is a very solid investor and respect his opinions very much. So if he says pay attention to this or that - I will.
~ Dale G.
-
I've started managing my own investments so view Michael's site as a one-stop shop from which to get information and perspectives.
~ Dave E.
-
Michael offers easy reading, honest, common sense information that anyone can use in a practical manner.
~ der_al.
-
A sane voice in a scrambled investment world.
~ Ed R.
Inside Edge Pro Contributors

Greg Weldon

Josef Schachter

Tyler Bollhorn

Ryan Irvine

Paul Beattie

Martin Straith

Patrick Ceresna

Mark Leibovit

James Thorne

Victor Adair