
Timing & trends
Hopefully the stock market is going to be allowed to continue correcting. This will clear out bullish sentiment and allow the stock market to complete both an intermediate and yearly cycle low. Coinciding with this, the dollar is poised to continue lower and complete a failed daily cycle.
https://blog.smartmoneytrackerpremium.com


Last week, several U.S. economic reports were released. What do they imply for the gold market?
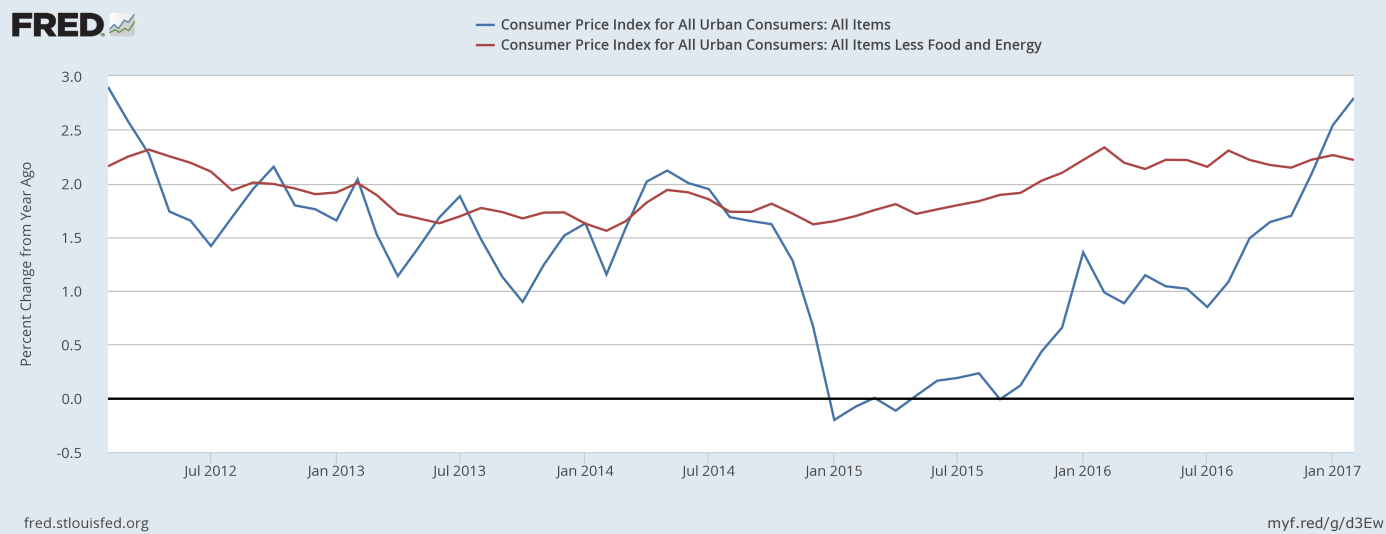
The FOMC meeting and parliamentary election in the Netherlands prevented us from covering recent economic data coming out from the U.S. Let’s catch up. First of all, inflation continued to strengthen. Consumer prices increased 0.1 percent last month, according to the Bureau of Labor Statistics. It was the smallest rise since last summer and much below a 0.6 percent surge in January. Core CPI, which excludes the volatile energy and food categories, increased 0.2 percent, only slightly faster. However, overall CPI rose 2.7 percent on an annual basis, the highest level since early 2012. Core CPI jumped 2.2 percent over the last 12 months.
As one can see in the chart below, the overall consumer inflation rate significantly accelerated over the last several months. The inflation rate rose from 0 percent in September 2015 to almost 3 percent currently. It strengthens the hawks’ camp in the U.S. central bank, which is generally bad news for gold bulls. However, until the Fed remains behind the curve, gold may gain due to lower real interest rates.
Chart 1: CPI (blue line) and core CPI (red line) year-over-year from February 2012 to February 2017.
When it comes to other data, retail sales rose just 0.1 percent in February, following a 0.6 percent jump in January. Weak sales – despite unseasonably warm weather, are a negative surprise, which does not bode well for economic growth. As a reminder, the Atlanta Fed’s GDPNow model forecasts real GDP growth in the first quarter of 2017 at only 0.9 percent.
National industrial production was flat in February, but regional manufacturing indices, such as Philly Fed and Empire State remained at high levels in March (although they corrected a bit). Permits to build new homes dropped 6.2 percent, but housing starts climbed 3 percent in February. And the sentiment among home builders also surged, as the National Association of Home Builders’ confidence index jumped 6 points to 71 in March, the highest level since June 2005.
The bottom line is that retail sales were weak in February, but inflation accelerated on an annual basis. However, given a big drop in oil prices, inflation may soften in the months ahead. Anyway, the recent data on inflation does not affect significantly the prospects of the Fed hikes. A hawkish Fed is rather negative for the yellow metal, although two more hikes in 2017 have been probably already priced in. Stay tuned!
If you enjoyed the above analysis, we invite you to check out our other services. We focus on fundamental analysis in our monthly Market Overview reports and we provide daily Gold & Silver Trading Alerts with clear buy and sell signals. If you’re not ready to subscribe yet and are not on our mailing list yet, we urge you to join our gold newsletter today. It’s free and if you don’t like it, you can easily unsubscribe.
Disclaimer: Please note that the aim of the above analysis is to discuss the likely long-term impact of the featured phenomenon on the price of gold and this analysis does not indicate (nor does it aim to do so) whether gold is likely to move higher or lower in the short- or medium term. In order to determine the latter, many additional factors need to be considered (i.e. sentiment, chart patterns, cycles, indicators, ratios, self-similar patterns and more) and we are taking them into account (and discussing the short- and medium-term outlook) in our trading alerts.
Thank you.
Arkadiusz Sieron
Sunshine Profits‘ Gold News Monitor and Market Overview Editor

 On the way up in price it was easy. Make an offer higher than list price with few conditions if any and provide the vendor with everything they wanted and voilà, you own the asset if you managed to out-guess the competitive bidders lined up on their phones.
 Liabilities were an unimportant consideration because in a few days, a similar property would sell for even more and your balance sheet then became even more credit worthy; check and check.
On the way down, guessing the price that a vendor will agree to is still a requirement; is the vendor holding a property with too little of his own equity and perhaps reluctant to take a loss at this time, or is the property being offered for the first time in let’s say the last decade? A single family detached house in Vancouver has increased in price by over 120% in the last 10 years (over 160% in Toronto). The vendor’s equity position is an important clue in the guessing game.
Is the vendor attempting to sell in order to repurchase in the same market? That would suggest an end price is required CLICK IMAGE TO ENLARGE
similar to the current snapshot of market comparable sales if trading sideways is the objective. Is the vendor an estate looking to settle accounts for multiple
parties? That implies that the end price is not as “sticky” because VALUE can be defined outside the parameters of “comps”.
At some point definitions of value might again include an appraiser’s use of the “income” approach. Investment real estate cap rates in a city like Vancouver are among the lowest in Canada and so a buyer must determine if there is value in the price. Potential investment capital can dry up and move very rapidly out of a declining market and seek out better (lower risk) returns elsewhere. Low cap rates are tolerated in a rising market but not so much when price momentum shifts to the down side. Vancouver prices peaked July 2016
A declining market requires more work on the buy side and exposes the potential purchaser with risk not seen on the way up.
The CBRE in their 2016 Report list cap rates for “A” class apartment buildings in Vancouver at 2.5-3% (in Toronto 3.25-3.75%, in Calgary 4.5-5%). This week the Bank of Canada benchmark 10 year yield is 1.76% similar to the full month of February plot on my yield curvechart.
What we don’t see in the CBRE report is what expense items are used in the developing a theoretical cap rate (Net Income / Asset Purchase Price). I suspect that only the minimum data of property tax, insurance, maintenance and actual expenses paid out are used for a given year in these surveys. Is a vacancy allowance included? Not all tenancies are reliable. Is a management fee included? Someone has to spend time taking care of the asset. Is the asset subject to sudden strata fee spikes or revelations of past due maintenance? These are important questions that any real estate investor who has been playing the game for at least one cycle trend change will ask.
In my 2013 case study, I had to lower the purchase price by 25% to get a return that piqued my interest because I included vacancy and management.
With a 25% drop in sale price, the GRM has dropped nearly 6 points (lower is better) and the CAP Rate has gone up 40 basis points (higher is better) which not a huge move but the yield on investment (ROI) has increased to more than twice the 10 year bond return and that provides an investor the incentive in a ZIRP environment to buy and hold and allow other people’s money (the tenant’s) to turn debt into equity.
(2013 Case Study)
An investment timing genius with an amazing stock track record is returning to the Weiss Research team of experts!
His name is Tony Sagami, and with the market still climbing a wall of worry, the timing couldn’t be better.
I first met Tony in the 1990s, and we’ve been very good friends ever since. Here’s a transcript of our latest conversation …
Martin Weiss: Welcome back, Tony! I suspect many of the people reading this already know who you are; we started working together so many years ago …
Tony Sagami: More than 20, actually! When we both had black hair and black beards.
Martin: Haha. That’s what you remember. What I remember best is the day the Nasdaq Composite Index was trading below 1,000, you told me it could double or triple from there, and I said you were nuts.
Tony: I was nuts, I agree. But the Nasdaq was nuttier. It didn’t double. It didn’t triple. It surged by over five times — to 5,132. And by that time, I was turning so bearish I couldn’t see straight.
Martin: You told our subscribers to dump all their tech stocks. Every single one. That was gutsy. But then you took it one step further. You told them to buy put options on the Nasdaq index to directly profit from the decline. So while nearly all other investors were losing their shirts in the biggest tech stock disaster of all time, our subscribers were making some of the biggest profits of all time. It was one of the boldest and most accurate market calls I’ve seen in my life.
Of course, it’s easy today to look back and say the signs of the dot-com bubble were obvious. But for the thousands of so-called “pros” caught up in the frenzy, it wasn’t so obvious, was it?
Tony: No. But it was crystal clear to us in early 2000. The Wall Street crowd, the mainstream media, individual investors. They all had collectively lost their minds. They had driven stock prices — including pieces of pie-in-the-sky companies with scant sales and no profits — to ridiculously high prices. The risk hugely outweighed the reward. It wasn’t a sandbox I was willing to play in anymore.
Martin: You nailed it that time. Then you did it again. After riding the market up from 2003, you took your profits and ran, avoiding the excruciating pain of the worst Debt Crisis of modern times.
Tony: Thanks, but investors don’t need a history lesson right now. What they need now is solid, reasoned, no-nonsense direction for the future, which is what I’m here for.
Martin: A perfect segue to my main question: Is the stock market now poised for another tumble?
Tony: A tumble? Yes. A crash like the dot-com bust or the Debt Crisis? No. Sure, this current bull market is getting old in the tooth. Through last Thursday, the S&P 500 went 102 straight days without a 1% downward move. Just since Trump’s election, the S&P 500 has added $3 trillion of market value.
And sure, that type of enthusiasm is unsustainable. But unlike in 2000, the stock market is NOT grossly overvalued. It’s at 18.4 times forward earnings. That’s not cheap by any means, but we’re not talking about nosebleed territory either.
Here’s the key. This is a very timely conversation because I’m starting to see some cracks in the stock market’s armor.
Martin: What cracks?
Tony: Here are three that worry me.
Crack number one is the default rate on sub-prime auto loans. It hit 9.1% in January (the most recent data available). That was the highest level since the Debt Crisis, a first warning sign of consumer distress.
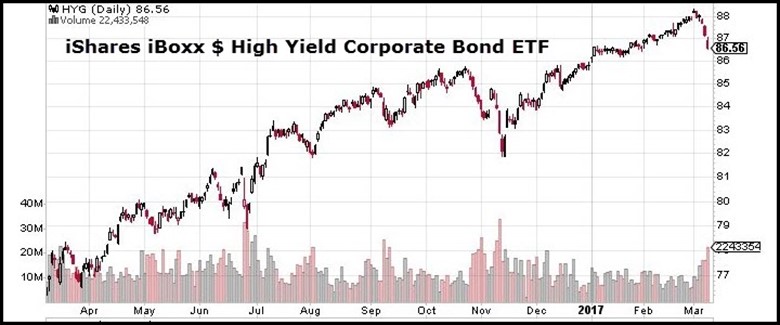
Crack number two is in the junk bond market. Last week’s decline alone was enough to wipe out all the interest investors could have made in the last year. The junk bond market has historically been a reliable risk-on/risk-off indicator. I watch it like a hawk.
Bull markets never die or correct for one reason alone. But one of the most common bear market triggers is an overzealous Federal Reserve. That could be crack number three in the market’s armor.
The Fed is slated to announce three rate hikes in 2017, a scenario that the Wall Street crowd seems oblivious to. Never forget: The Fed can kill a party faster than the police at a high school kegger.
Martin: Are you saying it’s time to run for the hills?
Tony: Not at all, Martin. What I am saying is that you need a plan — a defensive strategy to protect yourself for the day when the rally runs out of steam. It was your father who told me “buy, hold, and pray is not a strategy.”
Martin: What strategy do you recommend, then?
Tony: One of the easiest is to monitor the major stock market indices for a drop below a long-term moving average. On the Dow, for example, as long as the index is above its 200-day moving average, hold. As soon as it falls below, start selling.
Martin: Some people might think that’s cliché. But I’ve seen it work. Back in 1987, for example, my father and I saw the Dow fall below its 200-day moving average. It was Thursday, October 15, and that evening, we recorded a hotline alerting our subscribers to an imminent crash. Sure enough, October 19 was Black Monday, the worst single-day crash in Dow history.
Tony: I knew your father well and learned a lot from him. But the key is not to over-anticipate a crash, not to run for the hills too soon, which leads me to another defensive strategy.
This strategy recognizes that bull markets can greatly exceed valuations, that the Trump rally could last even longer, and it still has the potential to make investors richer than they’re inclined to think.
You have the best example right here and now: Anybody sitting on the sidelines since the election missed out on a mountain of profits.

This strategy also recognizes the explosion in Exchange Traded Funds (ETFs). There are hundreds of low-cost, effective ways to profit from falling stock and bond prices.
Martin:And you’ve been very successful at making money from ETFs, on the upside and the downside. Why?
Tony: Because after predicting markets for as long as I have, I find that the strong bullish and bearish trends are easier to identify than ever.
Martin: How so?
Tony: When you and I first entered the investment business, the focus was on corporate profits. All the big Wall Street firms had dozens of accountants and finance majors squirreled away in back rooms, poring over balance sheets, financial statements, annual reports. Good old fundamental analysis. But it was hard to make money with it because nearly all the news, whether good or bad, was almost invariably old news.
Martin: Are you saying corporate profits don’t matter anymore?
Tony: No. They still matter, but the focus has shifted to economic and political news as the main drivers of asset prices.
Let me give you two current examples:
 Whenever the Federal Reserve releases a policy statement or Janet Yellen gives a speech, the numbskulls on Wall Street pore over every word, every syllable that comes out of her mouth. Heck, a degree in linguistics may be more valuable than a degree in finance these days.
Meanwhile, the real action is what I call “Revenge of the Nerds II.”
I’m talking about high-frequency trading based on computerized models. They’re dominating the stock markets. They’re used by large investment banks, hedge funds, and institutional investors. They’re using computers to transact a massive number of orders at extremely high speeds. And all this is totally unrelated to the fundamentals of a company.
Martin: So what else is new?
Tony: What’s new is that now more than 70% of equity trading is done by high-frequency traders. And as I said, what’s even newer is that the factors driving some of the biggest momentum in the market (which their computers pick up on) are often major geo-political events. Like Brexit. Like the Trump election. And most important, like the Great Money Tsunami that Larry talked about.
Martin: I’m glad you brought up the Revenge of the Nerds. Because I remember that you were one of the first “nerds” to apply computerized trading to mutual fund and ETF investing.
Tony: I did. Back in the 1990s, I pioneered the use of complex computerized algorithms to analyze markets. I created software that helped thousands of sophisticated individuals and investment advisers.
Martin: You called it “computerized investing,” and you were one of the early pioneers. But the big question now is, how do you combine everything into a single, integrated investment strategy that’s exactly right for this time frame?
Tony: First, I determine what news events — both political and economic — really drive the markets. For example, Federal Reserve releases have more impact than Durable Goods orders. So I have figured out the 10 key economic/political events that affect stock market prices the most.
Second, I have created a rating system that quantifies the strength of any current trend. I call that the “Trend Persistency” rating.
Third, I buy into trends with the highest bullish trend persistency rating, and I sell into trends with the highest bearish persistency rating. Or, when there’s no strong signal either way, I sit on the sidelines. That way I take full advantage of the high-frequency trading crowd.
The profit opportunities are as regular as clockwork because the scheduled release dates of the 10 key economic/political events that drive the markets are known months in advance. You know exactly when they’re going to come out.

For example, I know that the next Dallas Federal Reserve Manufacturing Index numbers will be released on March 27, 2017. I know that the index has shown a consistent renewed strength over the last four months. (See chart above.) I know it’s one of the top ten events that will drive markets. And I know how it ranks in pure firepower compared to the other nine.
It’s a market-moving event with a strong trend persistency… and a strong opportunity to make money.
We call this kind of trading calendar profits, and it works. Of course, nothing is guaranteed in this crazy world. But never underestimate the power of the calendar to time the market, especially when you use the trading tools I just told you about.
Martin: Thanks, Tony. We look forward to hearing a lot more about this.

Mar 21, 2017
- Gold looks technically superb, and the fundamentals look even better.
- Inflation is rising in China and the West, the dollar looks shaky against key fiat competitors, and a reversal in American money velocity is imminent.
- Please click here now. Double-click to enlarge this hourly bars gold chart.
- The next COMEX options expiry day is March 28. Gold has a rough general tendency to trade a bit sluggishly ahead of option expiry days, and that appears to be happening now.
- Please click here now. Double-click to enlarge this daily bars chart for gold.
- I call this technical picture the “uptrend of champions”.
- For a closer look at the price action within the uptrend channel, please click here now. Double-click to enlarge. There’s an inverse H&S bottom pattern in play on this four-hour bars chart.
- For gold, all my technical lights are green, and once this option expiry day is out of the way, the “Queen of Assets” should make a beeline towards the $1265 area highs!
- Please click here now. Double-click to enlarge. Against the yen, the dollar looks horrible. Note the action of the 50DMA and 100DMA moving averages. A sell signal seems imminent. That’s good news for higher gold price enthusiasts.
- Please click here now. Double-click to enlarge. Against the Swiss franc, the dollar looks like a train wreck. The moving averages are flashing a sell signal, and that comes after a meltdown from an H&S top pattern.
- Please click here now. Double-click to enlarge. The euro is rallying strongly against the dollar, and it looks set to stage an upside breakout from both a triangle and inverse H&S bottom pattern.
- In regards to global stock markets, please click here now. It’s clear that for their stock market action, the Western gold community should be selling America at a profit and buying Asia.
- American bank stocks are the one exceptions to that “rule”; banks will prosper as rates rise. They will do a lot of lending to Europe and to Asia, because that’s where the higher growth is going to take place.
- Please click here now. Double-click to enlarge. That’s the INDA stock market ETF, and the price action is superb.
- From an emotional perspective, Western gold bugs (including myself) tend to get very nervous about US stock market sell-offs. We tend to wonder… “Is this the big one?”
- Having a tremendous floor of positive fundamentals can help to alleviate those concerns. Those fundamentals exist in China and even more so in India.
- Please click here now. Double-click to enlarge. That’s another look at the Indian stock market ETF, this time against the American SP500 index.
- I expect this massive outperformance of India versus America to continue not just for months or years, but for decades, and perhaps for the next 100 – 200 years.
- Please click here now. Double-click to enlarge this fabulous short term GDX chart.
- It’s very important that all gold stock investors do not get overly carried away with price action that is mildly disappointing.
- The bottom line is that gold stocks soared on Janet’s third rate hike, and are now treading water ahead of options expiry day for gold.
- There’s a flag-like pattern in play for GDX and many key senior gold stocks. The volume pattern is excellent; volume is rising on upside price action, and declining on downside price action.
- If most gold stock investors are honest with themselves, I don’t think they expected to see QE tapered to zero, rate hikes in play, with gold and gold stocks doing well!
- Please click here now. Double-click to enlarge. On this daily bars chart, GDX looks great. There’s now a buy signal in play on the 5,15 series of moving averages, volume is superb, and my 14,7,7 Stochastics oscillator is roaring higher. All lights are green for the world’s ultimate asset, and for the great mining companies that dig it out of the ground!
Thanks!
Cheers
st
Mar 21, 2017
Stewart Thomson
Graceland Updates
website: www.gracelandupdates.com
Graceland Updates Subscription Service: Note we are privacy oriented. We accept cheques. And credit cards thru PayPal only on our website. For your protection we don’t see your credit card information. Only PayPal does.
Stewart Thomson is a retired Merrill Lynch broker. Stewart writes the Graceland Updates daily between 4am-7am. They are sent out around 8am. The newsletter is attractively priced and the format is a unique numbered point form; giving clarity to each point and saving valuable reading time.
Risks, Disclaimers, Legal
Stewart Thomson is no longer an investment advisor. The information provided by Stewart and Graceland Updates is for general information purposes only. Before taking any action on any investment, it is imperative that you consult with multiple properly licensed, experienced and qualifed investment advisors and get numerous opinions before taking any action. Your minimum risk on any investment in the world is 100% loss of all your money. You may be taking or preparing to take leveraged positions in investments and not know it, exposing yourself to unlimited risks. This is highly concerning if you are an investor in any derivatives products. There is an approx $700 trillion OTC Derivatives Iceberg with a tiny portion written off officially. The bottom line:

-
I know Mike is a very solid investor and respect his opinions very much. So if he says pay attention to this or that - I will.
~ Dale G.
-
I've started managing my own investments so view Michael's site as a one-stop shop from which to get information and perspectives.
~ Dave E.
-
Michael offers easy reading, honest, common sense information that anyone can use in a practical manner.
~ der_al.
-
A sane voice in a scrambled investment world.
~ Ed R.
Inside Edge Pro Contributors

Greg Weldon

Josef Schachter

Tyler Bollhorn

Ryan Irvine

Paul Beattie

Martin Straith

Patrick Ceresna

Mark Leibovit

James Thorne

Victor Adair