
Energy & Commodities
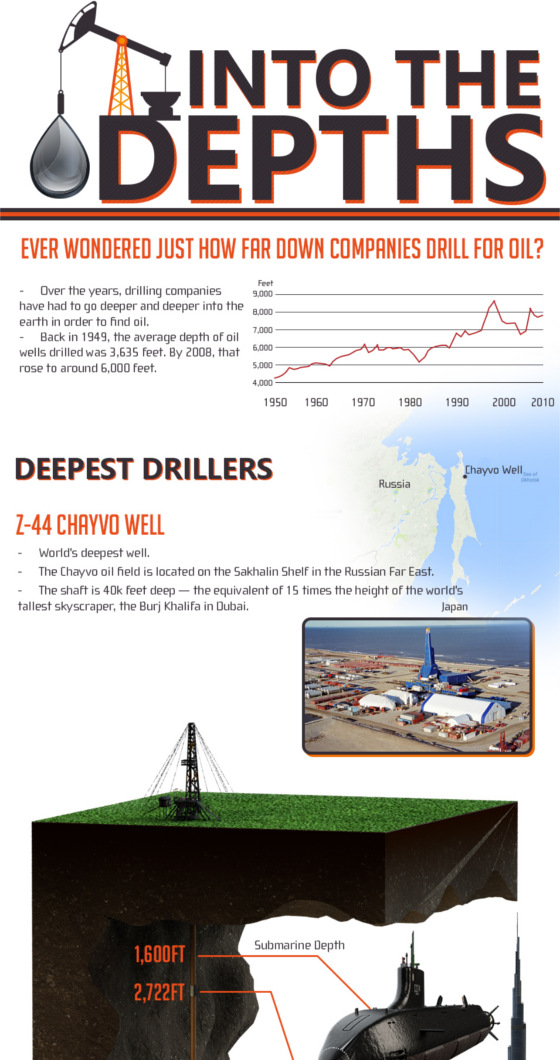
In a remote part of eastern Russia, the world’s deepest oil well has been drilled to incredible depths.
Operated by Exxon Neftegas Ltd, it helps to unlock a shelf that is expected to yield 2.3 billion barrels of oil.
But even more fascinating is the old Soviet well that previously held the record for drill depth, in which drillers thought they reached “hell” itself in 1992.
Click on the image for full image and full story:


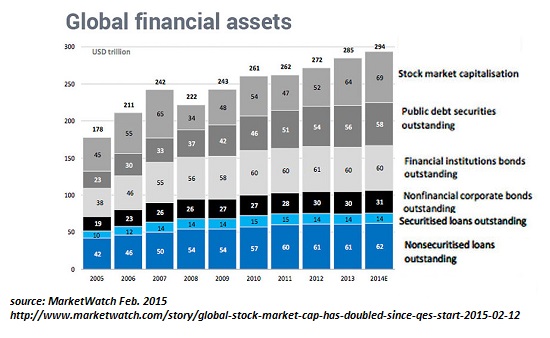 If we had to summarize what’s happened in eight years of “recovery,” we could start with this: everyone’s been pushed into risky assets while being told risk has been transformed from something to avoid (by buying risk-off assets) to something you chase to score essentially guaranteed gains (by buying risk-on assets).
The successful strategy for eight years has been buy the dips because risk-on assets always recover and hit new highs: housing, stocks, bonds, bat guano futures–you name it.
Those who bought the dip in hot housing markets have seen spectacular gains since 2011. Those who bought every dip in the stock market have been richly rewarded, and those buying bonds expecting declining yields have until recently logged reliable gains.
The only asset class that’s lower than it was in 2011 is the classic risk-off asset: precious metals.
Investors who avoided risk-on assets–stocks, bonds, REITs (real estate investment trusts) and housing in hot markets–have been clubbed, while those who piled on the leverage to buy every dip have been richly rewarded.

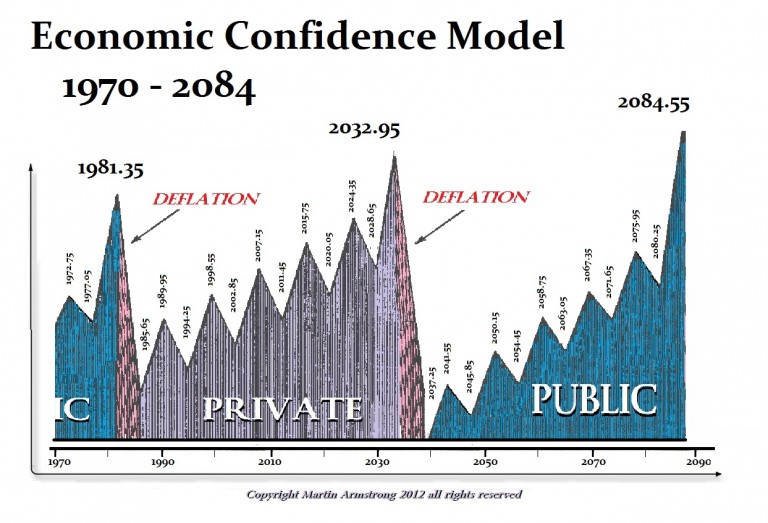
“There are times when the private sector cannot stand and everyone runs to bonds/cash. Likewise, there are times when government can no longer stand and the only thing that survives is private assets. This took place during the collapse of the Weimar Republic (German Hyperinflation) and it has been the case throughout history even at the birth of the USA and the collapse of the Continental Currency.”
….also from Martin: The Crash & Burn
– what will the “Crash and Burn” look like? Will it be worldwide or specific to a few countries like the US? Will it be in the form of a financial crash, food shortages, violence in the streets, all the above or in some other form? ….read Martin’s Crash & Burn response HERE

Stock Trading Alert originally sent to subscribers on March 20, 2017, 6:57 AM.
Briefly: In our opinion, speculative short positions are favored (with stop-loss at 2,410, and profit target at 2,200, S&P 500 index).
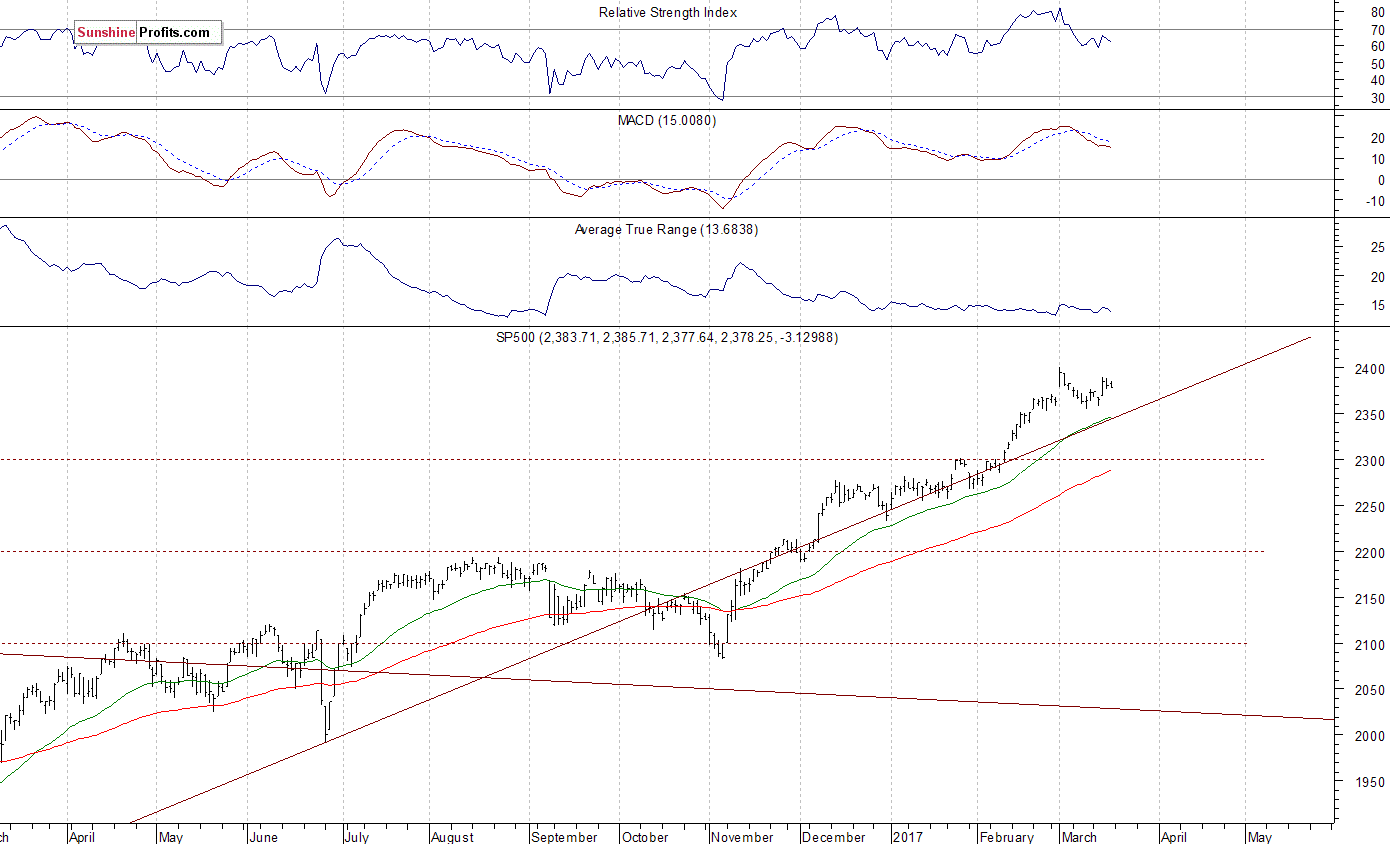
Our intraday outlook is bearish, and our short-term outlook is bearish. Our medium-term outlook remains neutral, following S&P 500 index breakout above last year’s all-time high:
Intraday outlook (next 24 hours): bearish
Short-term outlook (next 1-2 weeks): bearish
Medium-term outlook (next 1-3 months): neutral
Long-term outlook (next year): neutral
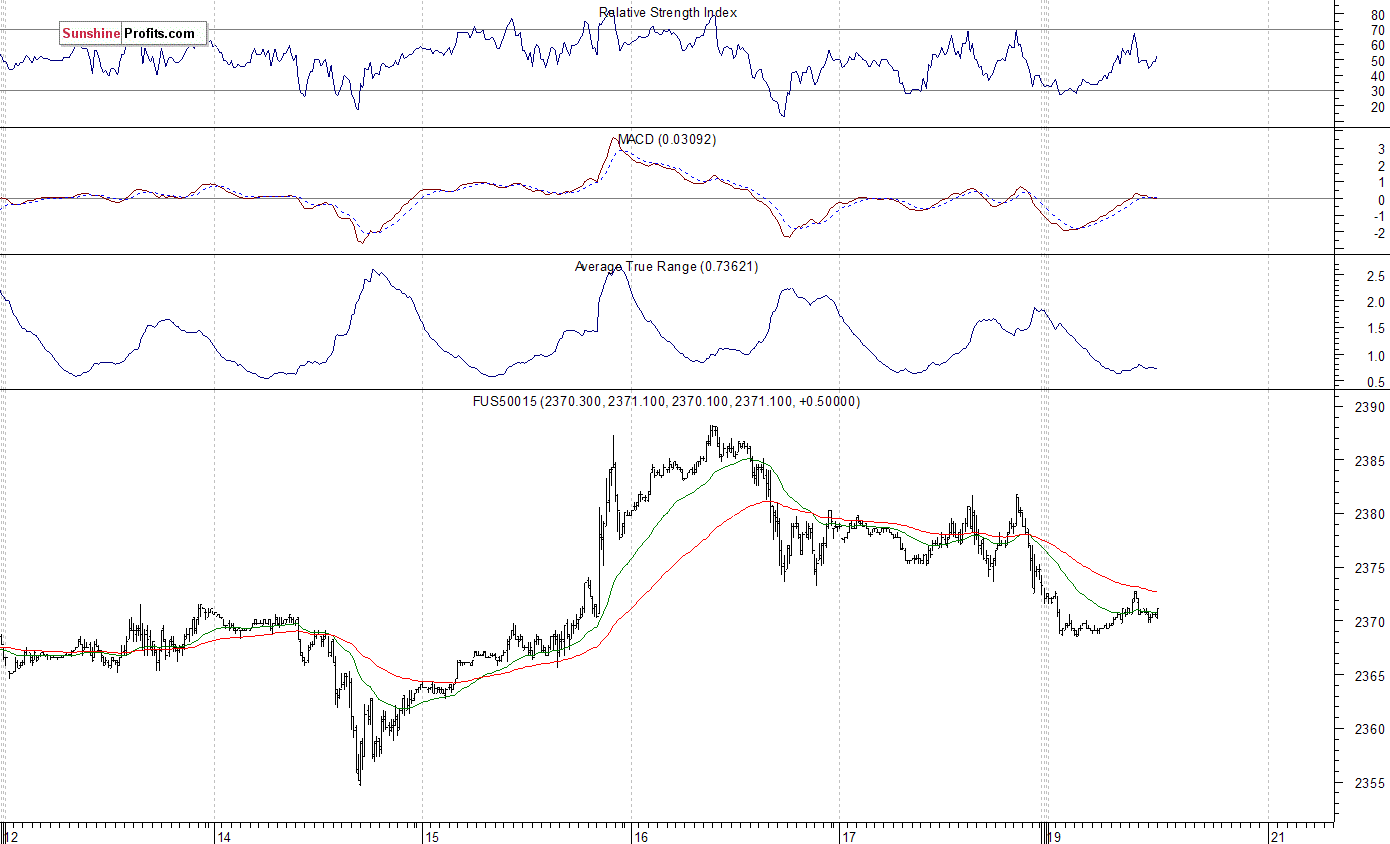
The U.S. stock market indexes lost 0.1% on Friday, extending their short-term consolidation following Wednesday’s FOMC Rate Decision release rally. The S&P 500 index remains relatively close to its March 1 all-time high of 2,400.98. The Dow Jones Industrial Average continued to trade above 20,900 mark, and the technology Nasdaq Composite index remained above the level of 5,900. All three major stock market indexes remain relatively close to their early March new record highs. For now, it looks like a flat correction within medium-term uptrend. Will stocks break above their few-week-long trading range? The nearest important level of support of the S&P 500 index is at around 2,370-2,375, marked by recent local highs. The next support level remains at 2,350-2,360, marked by local lows and the February 21 daily gap up of 2,351.16-2,354.91. The support level is also at around 2,320. On the other hand, the nearest important level of resistance is at around 2,390-2,400, marked by all-time high. Will the market extend its year-long medium-term uptrend even further before some more meaningful downward correction? We can see some short-term volatility following four-month-long rally off last year’s November low at around 2,100. Is this a topping pattern before downward reversal? The uptrend accelerated on March 1 and it looked like a blow-off top pattern accompanied by some buying frenzy. The S&P 500 index continues to trade above its over year-long medium-term upward trend line, as we can see on the daily chart:
Expectations before the opening of today’s trading session are slightly negative, with index futures currently down 0.1-0.2%. The European stock market indexes have lost 0.2-0.4% so far. There will be no new economic data announcements today. Investors will wait for Wednesday’s Existing Home Sales and Crude Inventories releases, among others. The S&P 500 futures contract trades within an intraday consolidation, as it fluctuates following an overnight move down. It currently trades along the level of 2,370. The nearest important level of resistance is at around 2,375-2,380, marked by short-term consolidation. The next resistance level is at 2,395-2,400, marked by all-time high. On the other hand, support level is at 2,365-2,370, marked by previous local highs, among others. The next support level remains at 2,355-2,360, marked by short-term consolidation. The market continues to trade within a consolidation following late April – early March rally. There have been no confirmed negative signals so far. But will it break above its early March record high?
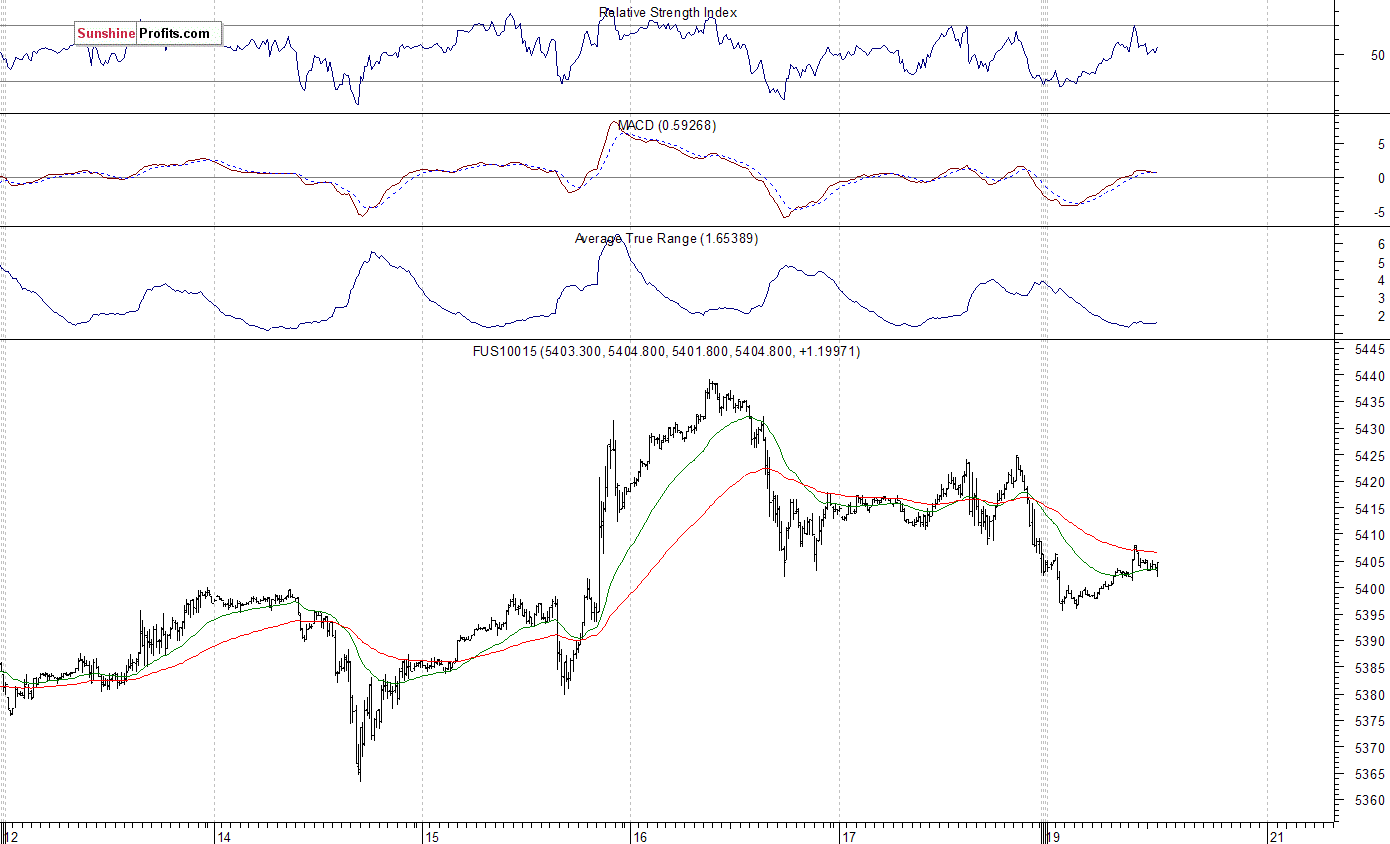
The technology Nasdaq 100 futures contract remains relatively stronger than the broad stock market, as it continues to trade above 5,400 mark. The market extends its eight-year-long bull-run. It trades relatively close to new record high. The resistance level is at around 5,440, marked by last week’s new all-time high. The nearest important level of support is at 5,400, marked by previous level of resistance. The next support level remains at 5,370, marked by some local lows, as the 15-minute chart shows:
Concluding, the broad stock market continued to fluctuate on Friday, as investors remained uncertain following Wednesday’s Fed’s interest rate hike announcement. The S&P 500 index remains relatively close to its early March record high. Will the market resume its medium-term uptrend? There have been no confirmed negative signals so far. However, we still can see medium-term overbought conditions accompanied by negative technical divergences. Stocks may retrace some of their almost five-month-long rally at some point in time. Therefore, we continue to maintain our speculative short position (opened on February 15 at 2,335.58 – opening price of the S&P 500 index). Stop-loss level is at 2,410 and potential profit target is at 2,200 (S&P 500 index). You can trade S&P 500 index using futures contracts (S&P 500 futures contract – SP, E-mini S&P 500 futures contract – ES) or an ETF like the SPDR S&P 500 ETF – SPY. It is always important to set some exit price level in case some events cause the price to move in the unlikely direction. Having safety measures in place helps limit potential losses while letting the gains grow.
To summarize: short position in S&P 500 index is justified from the risk/reward perspective with the following entry prices, stop-loss orders and profit target price levels:
S&P 500 index – short position: profit target level: 2,200; stop-loss level: 2,410
S&P 500 futures contract (March) – short position: profit target level: 2,197; stop-loss level: 2,407
SPY ETF (SPDR S&P 500, not leveraged) – short position: profit target level: $220; stop-loss level: $241
SDS ETF (ProShares UltraShort S&P500, leveraged: -2x) – long position: profit target level: $15.47; stop-loss level: $12.98
Thank you.
Paul Rejczak
Stock Trading Strategist
Stock Trading Alerts
The precious metals complex enjoyed a strong week mostly due to a post-Fed explosion on Wednesday. Although gold stocks sold off to end the week, they finished up almost 5% for the week. Gold gained 2.4% on the week while Silver gained 2.9%. The miners enjoyed massive gains following the previous two rate hikes and that has some optimistic about a repeat scenario. However, the miners and metals need to prove they can recapture their 200-day moving averages before we become optimistic.
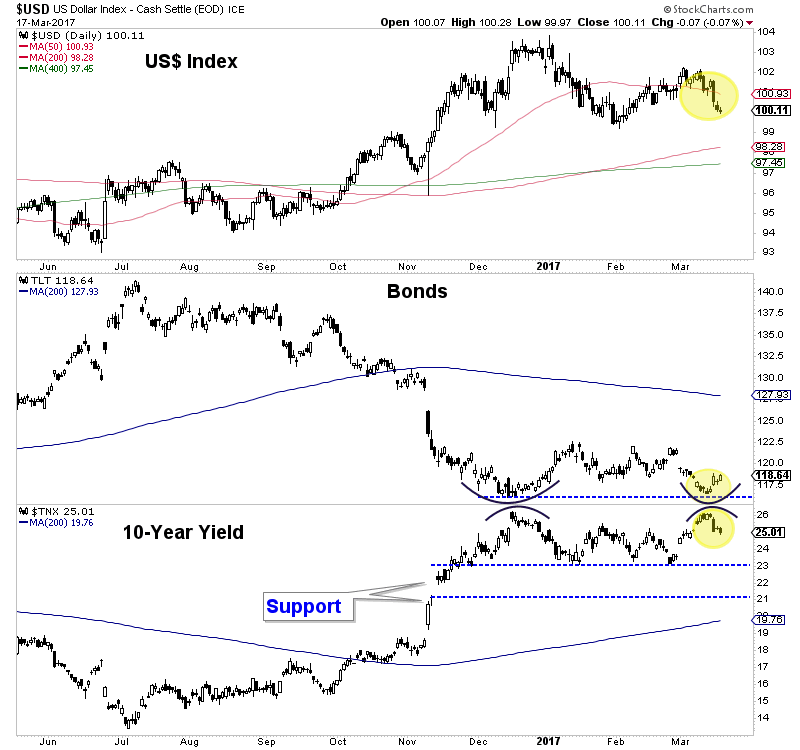
Precious metals should trend higher in the short-term if the current macro technical landscape does not change. The US Dollar index has fallen below its 50-day moving average and could fall another 2% to moving average support. Also, despite the Fed rate hike, the 10-year yield did not make a new high. Bonds could rebound and the huge speculative short position, if unwound could add to the rebound. A rally in Bonds coupled with a weak US Dollar would help precious metals.
Precious metals could rebound farther but resistance in the form of the 200-day moving average looms large. In the chart below we plot Gold, Silver, GDXJ and GDX along with their 200-day moving averages. In addition to the 200-day moving average, the February highs will also provide resistance. We should note, while the metals remained above their late January lows, the miners did not. It would not be a good sign to see a continued rally led by the metals rather than the miners.
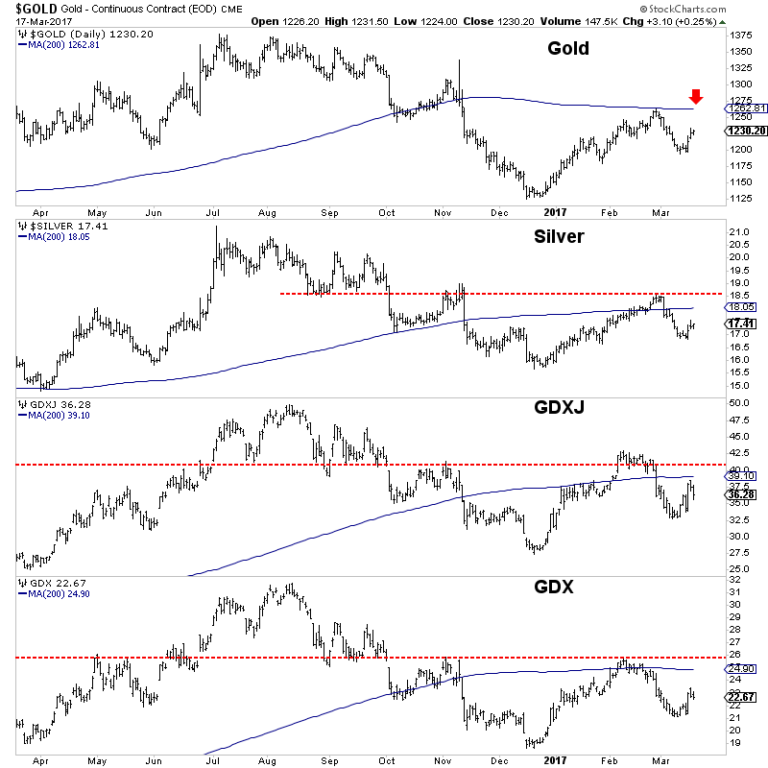
We should see some upside follow through in precious metals if our read on the US Dollar and Bonds is correct but take note of February highs and 200-day moving averages as resistance. I would not be chasing any strength until the sector proves itself. The first step would be a return to the February highs. If this rally fades below those levels then miners are again at risk for a retest of the recent December lows. We continue to look for bargains that we can buy on weakness and hold into 2018.
For professional guidance in riding this new bull market, consider learning more about our premium service including our current favorite junior miners.


-
I know Mike is a very solid investor and respect his opinions very much. So if he says pay attention to this or that - I will.
~ Dale G.
-
I've started managing my own investments so view Michael's site as a one-stop shop from which to get information and perspectives.
~ Dave E.
-
Michael offers easy reading, honest, common sense information that anyone can use in a practical manner.
~ der_al.
-
A sane voice in a scrambled investment world.
~ Ed R.
Inside Edge Pro Contributors

Greg Weldon

Josef Schachter

Tyler Bollhorn

Ryan Irvine

Paul Beattie

Martin Straith

Patrick Ceresna

Mark Leibovit

James Thorne

Victor Adair