
Gold & Precious Metals

 The Fed gave us another quarter-point rate increase yesterday. That makes the third such hike in the last 10 years!
Whoa! Hold on… We can’t take that much excitement.
But wait… The Fed also signaled that it may abandon its “data dependent” position and take the lead.
Instead of reacting to the news… it may lead the world’s interest rate levels back to normal, regardless of what the headlines tell it.
Oh, dear reader, you already know this is not going to happen. The Fed can never voluntarily return to sound money and market-set interest rates.
It presides over the biggest bubble in stocks and bonds the world has ever seen. Without underpriced credit, the whole thing would collapse.
That’s why the Fed can only take baby steps toward normalization… and only so long as they don’t matter.
We’re entering our ninth year of near-zero interest rates. During that time, businesses, investors, speculators, and consumers have adapted to extraordinarily cheap credit.
They’ve used it to refinance their debts… and drive up their stock prices. They’ve used it to sell automobiles and buy houses.
The big players have gotten used to gambling with money that is almost free. And if they get into trouble, they can borrow more.
If the cheap-credit system were to end – or even if people were to think it is coming to an end – it would take about two minutes for the whole capital structure to fall apart.
Businesses couldn’t refinance. Bonds would crash (except for U.S. Treasurys… which would get a temporary boost on “safe haven” buying).
Stocks would repeat their move of 2008–’09, but probably worse.
Crash Risk
Why worse?
Because they’re more overvalued. By some measures, they are pricier now than EVER before.
Compared to sales, monetary velocity (the rate at which each dollar in the economy is spent), and GDP growth, the S&P 500 is more expensive than it was in 1929, 1999, or 2007 – all major peaks that preceded major crashes.
Warren Buffett’s favorite market indicator also puts this stock market way out on the “overvalued” edge of the spectrum.
Buffett compares the value of the S&P 500’s “market cap” (the total value of all outstanding shares) with the size of the economy that supports it, measured by GDP.
Anytime the ratio goes over 1-to-1, stocks are overpriced.
Today, U.S. GDP is approaching $19 trillion. And the total value of stocks is about $22 trillion. This puts the ratio at 1.2-to-1. For reference, it was only 1.1-to-1 before the 2008 crash.
We can’t predict the future. But the risk of a crash shouldn’t be ignored.
And when it happens – it’s bound to sooner or later – it will take the Yellen Fed about five minutes to abandon its leadership role and become a “data dependent” follower.
Whatever It Takes
Looking at the data from a crashing stock market, the Fed will slash rates again…
And it will roll out QE4 – the fourth round of its quantitative easing program to buy bonds, and even stocks, with money created out of thin air – along with as much other mischief as the feds feel is appropriate.
This is no secret…
Mario Draghi, a former Goldman guy who now heads the European Central Bank (ECB), announced the anthem for central bankers around the world a couple of years ago.
In answer to what the ECB would do to protect its member banks, bankers’ bonuses, and the wealth of the rich, “Whatever it takes,” he said.
We don’t know what it might take, come the next crisis, to keep this fake-money system afloat. But whatever it is, we are sure that the Fed will give it a try.
Reformer or Rascal?
Meanwhile, cometh Donald. J. Trump…
Savior or scoundrel? Reformer or rascal? Hero doctor… or vainglorious quack?
The ailment afflicting the U.S. is “swamp fever” – with too many programs, too much money, and too many regulations that benefit Deep State cronies but hurt the Main Street economy.
There are three major ones. Now we have heard from the president on all of them.
The military: He says there is to be more of it. And in his preliminary 2018 budget proposal, there is a $54 billion windfall for the military-security industry.
Wall Street: Mr. Trump hasn’t even mentioned it. Instead, he has put Goldman Sachs alums such as Steven Mnuchin and Gary Cohn in key positions, signaling no change to the Clinton-Bush-Obama fake-money system.
And entitlements: Last week, the president said he was “proud” of the Republicans’ “Obamacare Lite” health care reforms.
We don’t know whether the new plan is better or worse than the old one. But one thing is for sure: From the Deep State’s point of view, it is not much different.
Military… Wall Street… entitlements… The rest is detail.
Tomorrow, we continue yesterday’s campfire tale – including why the U.S. empire’s financial system is doomed… and what you would have to do to get the economy working properly again.
Regards,
Bill
Market Insight
by Chris Lowe, Editor at Large, Bonner & Partners
This month, for the first time ever, the price of one bitcoin surpassed the price of one ounce of gold.
As you can see, on March 3, bitcoin hit $1,277 versus a price of $1,236 for an ounce of the yellow metal.

And even after a gold rally yesterday, one bitcoin is just $8 below the gold price.
— Chris Lowe

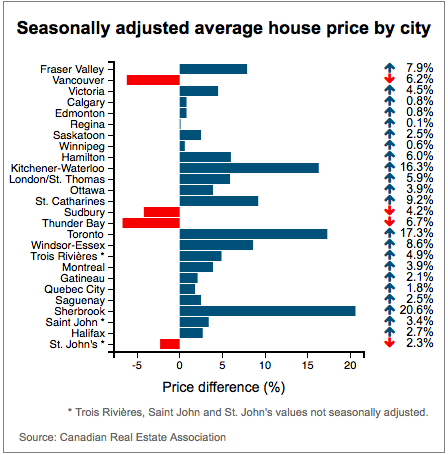
The price of the average Canadian home rose up by 3.5 per cent to and average price of $519,521 in February, even as the national figures continue to be skewed by hot activity in the country’s biggest market: Toronto. “That said, Greater Vancouver’s share of national sales activity has diminished considerably over the past year, giving it less upward influence on the national average price,” CREA said.
According to statistics released today by The Canadian Real Estate Association (CREA), national home sales were up on a month-over-month basis in February 2017.
Highlights:
- National home sales rose 5.2% from January to February.
- Actual (not seasonally adjusted) activity in February was down 2.6% from a year earlier.
- The number of newly listed homes was up 4.8% from January to February.
- The MLS® Home Price Index (HPI) in February was up 16% year-over-year (y-o-y).
- The national average sale price edged up 3.5% y-o-y in February.

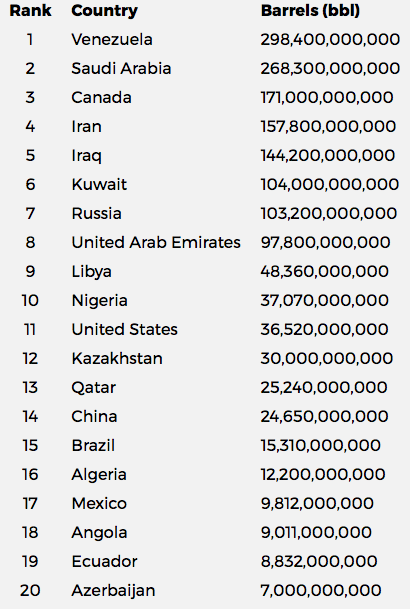 Martin: Another major discovery of oil has been made in Alaska of 1.2 billion barrels. It is the largest find of conventional oil for 30 years on US territory.
The Fed Raises Interest Rates & Markets Rally!
“The Fed’s forecasts have moved in the direction of tightening, and despite what they say publicly, the most serious stimulus is rising stock prices”

Sent to subscribers on March 16, 2017, 6:55 AM.
Briefly: In our opinion, speculative short positions are favored (with stop-loss at 2,410, and profit target at 2,200, S&P 500 index).
Our intraday outlook is bearish, and our short-term outlook is bearish. Our medium-term outlook remains neutral, following S&P 500 index breakout above last year’s all-time high:
Intraday outlook (next 24 hours): bearish
Short-term outlook (next 1-2 weeks): bearish
Medium-term outlook (next 1-3 months): neutral
Long-term outlook (next year): neutral
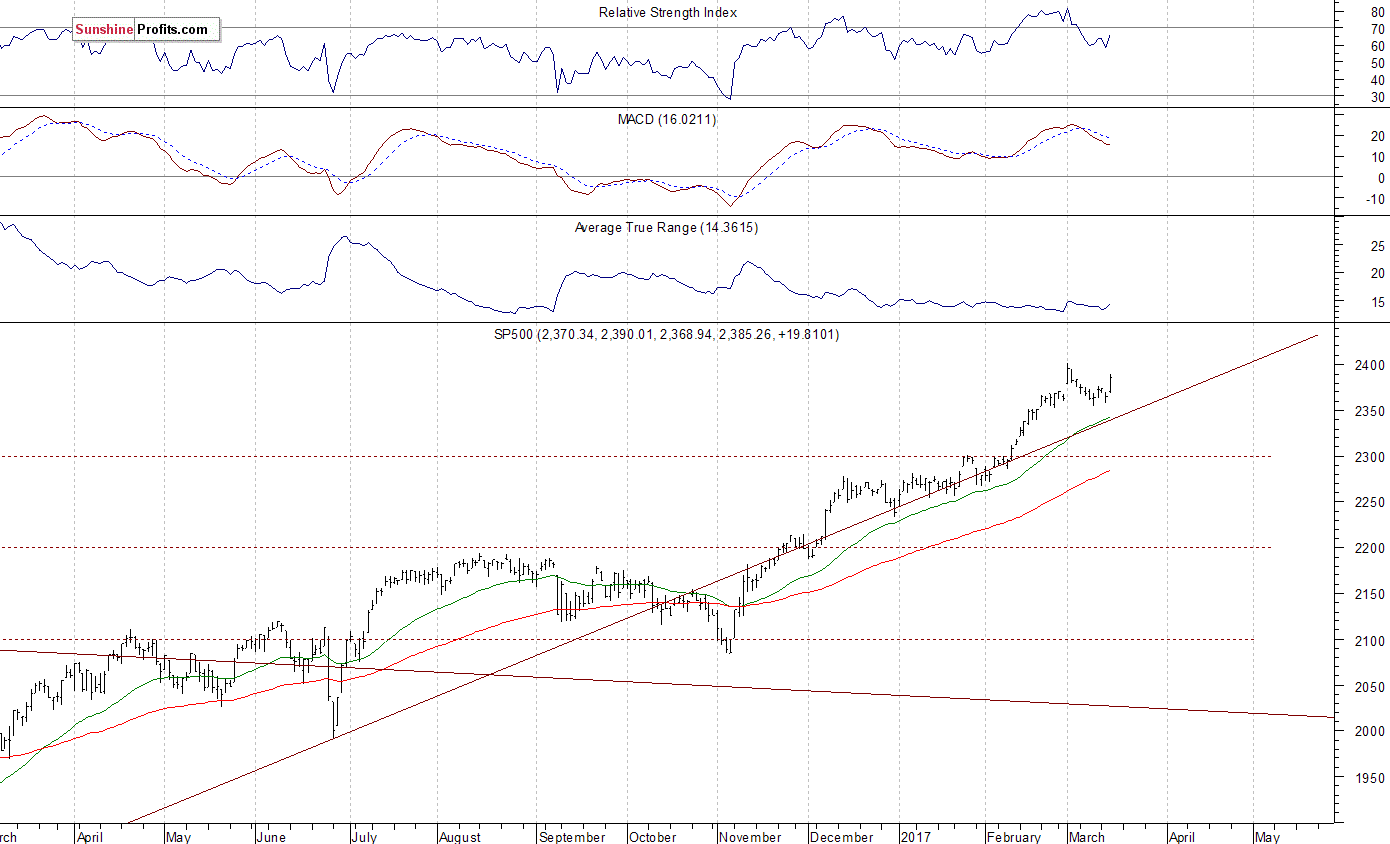
The U.S stock market indexes gained between 0.5% and 0.8% on Wednesday, breaking above their recent consolidation, as investors reacted to the FOMC’s Rate Decision announcement. The S&P 500 index has bounced off support level of 2,350-2,360 on Tuesday. It accelerated its short-term uptrend yesterday and got closer to March 1 all-time high of 2,400.98. The Dow Jones Industrial Average has managed to close above 20,900 mark, and the technology Nasdaq Composite index has got close to its record high above 5,900 mark. All three major stock market indexes continue to trade relatively close to their early March new record highs. The nearest important level of support of the S&P 500 index is at around 2,370-2,375, marked by recent local highs. The next support level remains at 2,350-2,360, marked by local lows and the February 21 daily gap up of 2,351.16-2,354.91. The support level is also at around 2,320. On the other hand, the nearest important level of resistance is at around 2,390-2,400, marked by all-time high. Will the market extend its year-long medium-term uptrend even further before some more meaningful downward correction? We can see some short-term volatility following four-month-long rally off last year’s November low at around 2,100. Is this a topping pattern before downward reversal? The uptrend accelerated on March 1 and it looked like a blow-off top pattern accompanied by some buying frenzy. The S&P 500 index continues to trade above its over year-long medium-term upward trend line, as we can see on the daily chart:
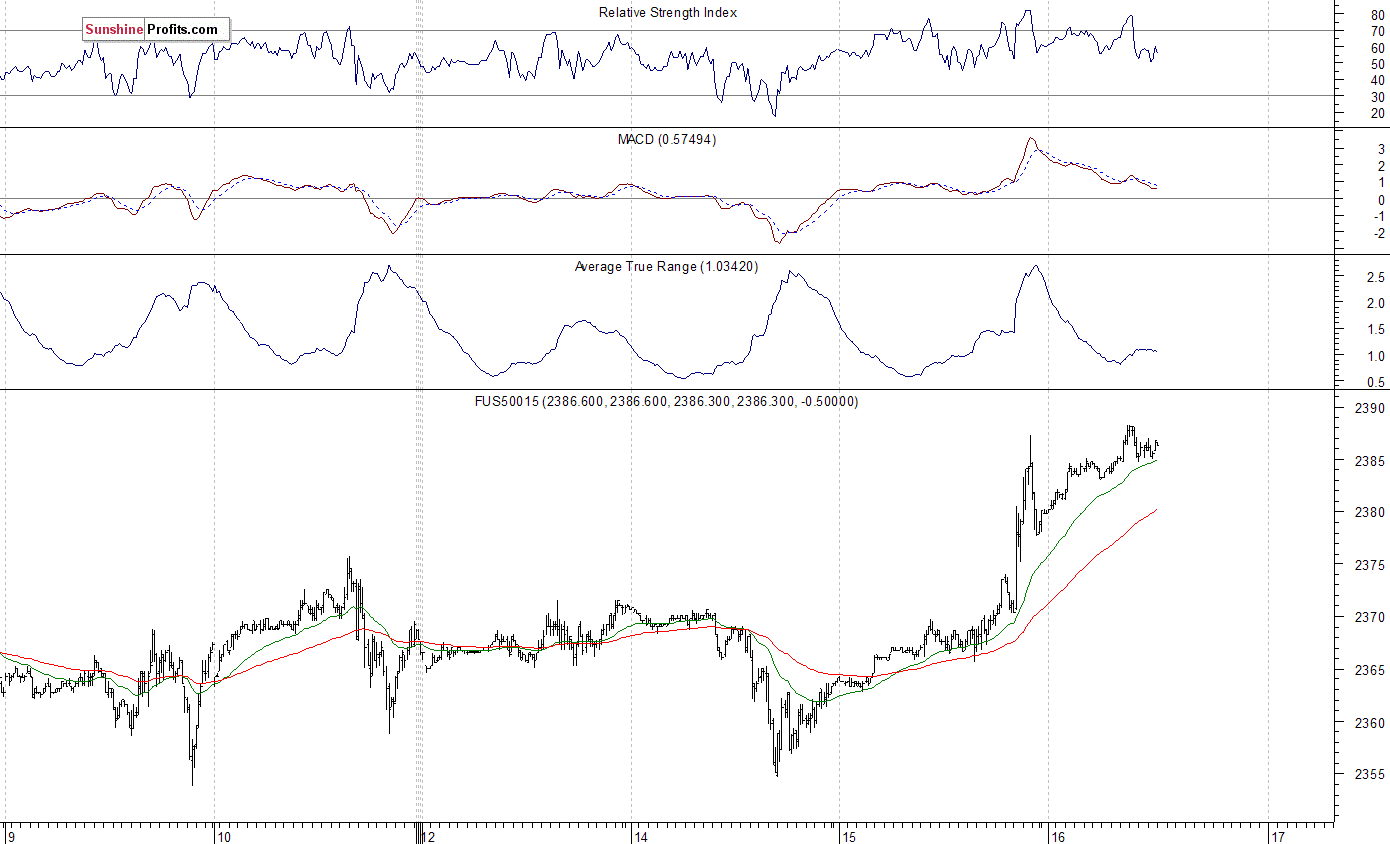
Expectations before the opening of today’s trading session are positive, with index futures currently up 0.2-0.3%. The European stock market indexes have gained 0.9-1.0% so far. Investors will now wait for some economic data announcements: Initial Claims, Housing Starts, Building Permits, Philadelphia Fed at 8:30 a.m., JOLTS – Job Openings at 10:00 a.m. The market expects that Housing Starts number was at 1,260K and Building Permits was at 1,251K in February, relatively flat vs. prior data. The S&P 500 futures contract trades within an intraday uptrend, as it retraces yesterday’s late session move down. It currently trades along the level of 2,385. The nearest important level of resistance is at around 2,395-2,400, marked by all-time high. On the other hand, support level is at 2,370-2,375, marked by previous level of resistance. The next support level remains at 2,355-2,360, marked by short-term local lows. The market continues to trade within a consolidation following late April – early March rally. There have been no confirmed negative signals so far. Will it break above its early March record high?
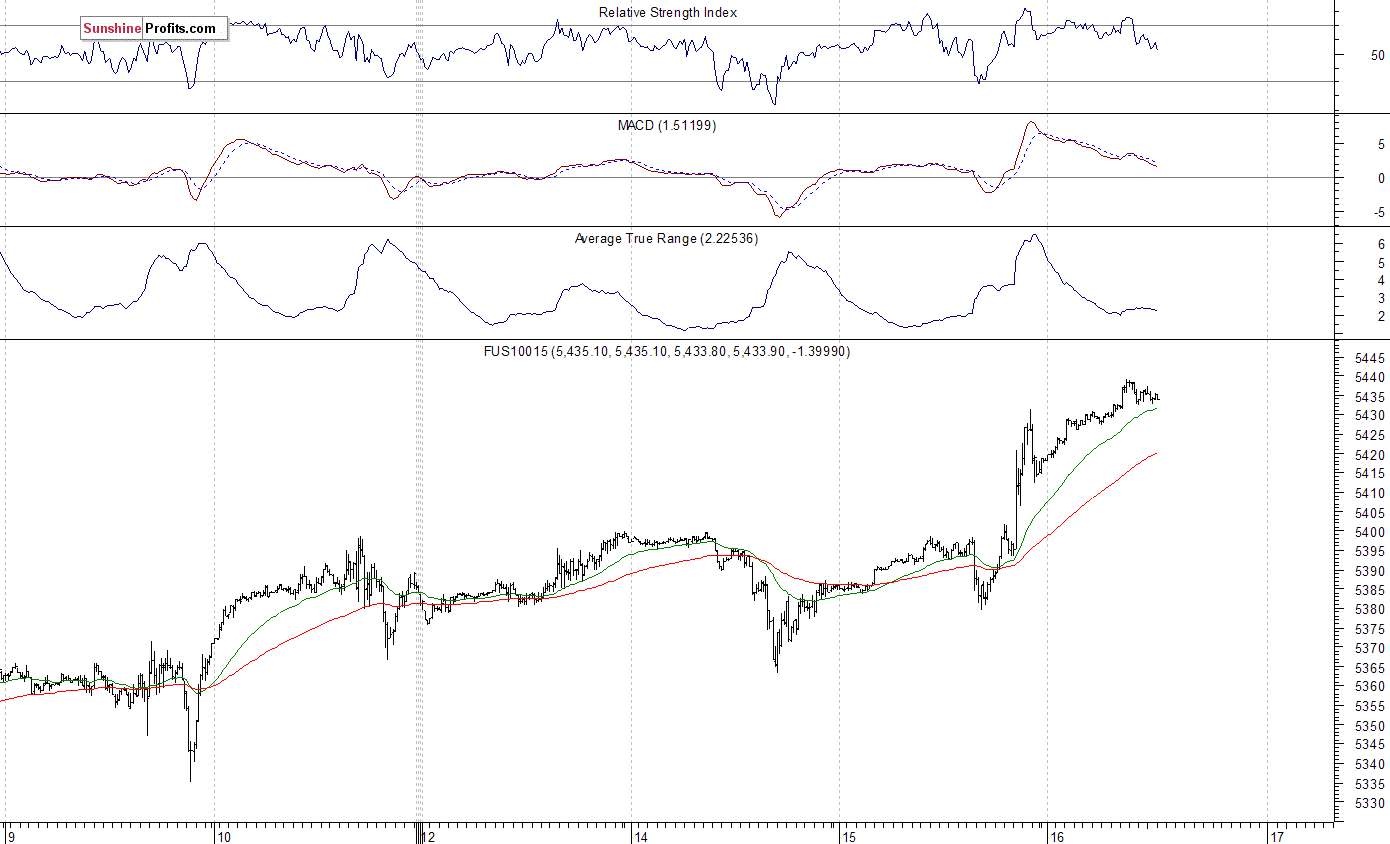
The technology Nasdaq 100 futures contract is relatively stronger than the broad stock market, as it currently trades close to new record high just below 5,440 mark. It has broken above its previous all-time high at around 5,400 yesterday. The market extends its eight-year-long bull-run. The nearest important level of support is at 5,400, marked by previous level of resistance. The next support level remains at 5,370, marked by some local lows, as the 15-minute chart shows:
Concluding, the broad stock market broke above its short-term consolidation yesterday, following Fed’s Rate Decision release. The S&P 500 index got close to its early March record high. Will the market resume its medium-term uptrend? There have been no confirmed negative signals so far. However, we still can see medium-term overbought conditions accompanied by negative technical divergences. Therefore, we continue to maintain our speculative short position (opened on February 15 at 2,335.58 – opening price of the S&P 500 index). Stop-loss level is at 2,410 and potential profit target is at 2,200 (S&P 500 index). You can trade S&P 500 index using futures contracts (S&P 500 futures contract – SP, E-mini S&P 500 futures contract – ES) or an ETF like the SPDR S&P 500 ETF – SPY. It is always important to set some exit price level in case some events cause the price to move in the unlikely direction. Having safety measures in place helps limit potential losses while letting the gains grow.
To summarize: short position in S&P 500 index is justified from the risk/reward perspective with the following entry prices, stop-loss orders and profit target price levels:
S&P 500 index – short position: profit target level: 2,200; stop-loss level: 2,410
S&P 500 futures contract (March) – short position: profit target level: 2,197; stop-loss level: 2,407
SPY ETF (SPDR S&P 500, not leveraged) – short position: profit target level: $220; stop-loss level: $241
SDS ETF (ProShares UltraShort S&P500, leveraged: -2x) – long position: profit target level: $15.47; stop-loss level: $12.98
Thank you.
Paul Rejczak
Stock Trading Strategist


-
I know Mike is a very solid investor and respect his opinions very much. So if he says pay attention to this or that - I will.
~ Dale G.
-
I've started managing my own investments so view Michael's site as a one-stop shop from which to get information and perspectives.
~ Dave E.
-
Michael offers easy reading, honest, common sense information that anyone can use in a practical manner.
~ der_al.
-
A sane voice in a scrambled investment world.
~ Ed R.
Inside Edge Pro Contributors

Greg Weldon

Josef Schachter

Tyler Bollhorn

Ryan Irvine

Paul Beattie

Martin Straith

Patrick Ceresna

Mark Leibovit

James Thorne

Victor Adair