
Gold & Precious Metals

“A fanatic is a man that does what he thinks the Lord would do if He knew the facts of the case.” ~ Finley Peter Dunne
Not too long ago this bull market was one of the most hated in history; that no longer appears to be the case. Throughout the unpopular phase of this bull market, we consistently and much to the dismay of many penguins, oops we mean experts, stated that every pullback should have been treated as a buying opportunity. There were two reasons for this; market sentiment was consistently negative, and the trend was up.
We even penned an article before Trump won stating that a Trump win like Brexit would prove to be a buying opportunity. As expected after the initial panic of having to deal with A Trump Presidency, the markets recouped their losses and never looked back. We were so bullish that on De 15, 2016 we provided our subscribers with the Path we expected the Dow to take in 2017.
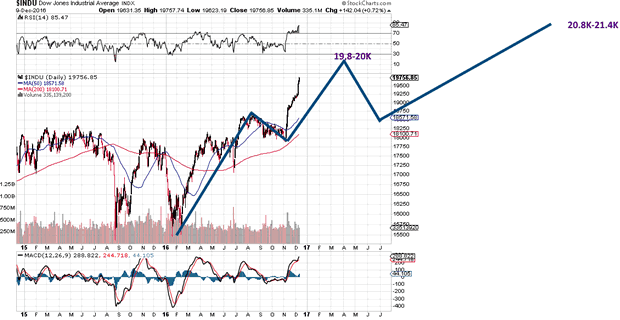
To be fair, we expected the markets to let out some steam as indicated the chart above, but the Dow only hesitated at 20,000 for a bit before surging like a rocket. Many experts were predicting the end of this bull at that time, some of which had for the most part been on the right side of the market. A stock market crash is not something we were ready for, and we voiced this sentiment in several articles in late 2016 and in Jan and Feb of this year. We were waiting for a pullback as the sentiment at the time (Dec 2016) had turned quite bullish. Long story short our targets have been hit and they have been hit a lot faster than we expected. One would almost be tempted to state that we are in the feeding frenzy stage which usually represents the last stage of a Bull Market. However, the Crowd is not Euphoric, so this would rule that option out at least for now. So what’s going on? Well, it appears to be fanaticism or madness. The markets are operating out of the realm of reality.
Fanaticism is a different emotion from Euphoria; it is a form of madness, and it is hard to analyse an insane person as there is no discernible pattern; at least not immediately. History is not replete with such situations, so we need to spot these new patterns in real time. This emotion does not expire as fast as Euphoria or Fear; it can be maintained for a prolonged period. Thus, when one encounters it, the safest play is to take a defensive position. Assume the outlook is worse than it is, but without letting the panic factor seep into the equation.
The data is twisted; on the one hand, the sentiment is far from Bullish, but on the other hand, more money is flowing into the markets, and our indicators are now in the extremely overbought ranges on the long term weekly and monthly charts. Just because the outlook is different does not mean we need to start becoming anxious. Panic is not something we favour or look kindly at; panic is a useless emotion. One has to be prudent when it comes to the markets, and we have been right on the money regarding this bull market for a long time. We do not want to let arrogance take over; common sense which we value highly dictates that caution, and not fear is warranted. Thus, prudent traders would do well to tighten their stops and if committing new funds, look for companies that are selling at a huge discount or trading in the extremely oversold ranges. If the markets pull back suddenly your risk will be limited.
This market will pullback, however, no one call tell it when to pull back especially when the primary emotion driving this market is fanaticism. It is relatively easy to determine a market’s trajectory if the emotion is Euphoria or Fear, but Fanaticism is something different. As stated it is a form of madness and insanity is not easy to spot, especially if it is in stealth mode.
We are not going to pen another thousand words telling you why this Stock Market should crash or soar or anything like that. The bottom line is the market does not care about what if scenarios? What if scenarios are for people that have too much time on 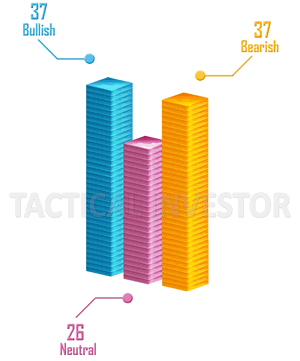 their hands to talk about useless concepts that most likely will not come to pass? Let’s deal with reality
Let’s first take a look at the data
Polarisation is spreading or contaminating the Bullish and Bearish Camps. It has been a long time since we have the sentiment so evenly divided between the two camps. This week exactly 37% are bullish, and exactly 37% are bearish, with 26% falling in the neutral camp. One would normally expect the bullish sentiment to soar through the roof; euphoria is clearly not gripping the market, and neither is panic. When we combine the bears with the individuals from the neutral camp, we arrive at a figure of 63%. The masses appear to be uneasy; the key word is “appear” for insanity is operating in stealth mode for now.
We spotted traces of fanaticism late last year, and that is why we briefly addressed this topic in late Dec of 2016 and early January. The trend is gathering in intensity, and it could be with us or for some time. If this trend picks up, then this bull market could last longer than the most ardent of bulls ever envisioned, but there will be at least one correction that will break the backs of almost all the bulls and make the bears believe that a new bear market has started. Sadly, both of these chaps will be wrong. A stock market crash, a bear market, etc, all come down to perception as is the case with the truth or a lie. Alter the angle of observance and the perception changes; it all depends on when you got into the market or out of it.
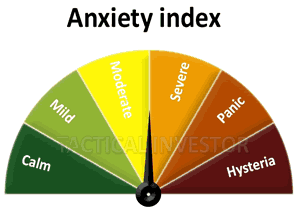 Our proprietary anxiety index is also getting infected with the polarisation flu; it is sitting right at the 50% mark. These are all subtle clues that something new is taking place in the background. Trend investing comes down to identifying the primary trend; it does not mean that the market cannot and will not pull back while it is an uptrend. In the long run the market tends to revert to the mean; currently, the market is trading almost two standard deviations from the mean. Thus regardless of the trend, one of the two things needs to happen
-
Our indicators pullback into the oversold ranges, preferably the extremely oversold ranges. Currently, they are trading in the extremely overbought ranges on the weekly charts and overbought ranges on the monthly charts
-
A sharp correction that drives many bulls to join hands with the Bears. A long-term bull market has to experience one back breaking correction. We do not know when this will occur, but the sooner, the better as, the higher it trades, the more painful the correction will be especially for those that embraced this bull market very late in the cycle
Ideally, both of the above occur simultaneously, and at that point, one could start conjuring images of Dow 24K. To do this, the above two need to occur simultaneously.
Shockingly V readings have surged a whopping 100 points in just two days. In just one week they have moved 160 points; a new three-day record and a new record. What can we say, expect what will appear to be chaos regarding human emotions, weather, politics and market movements? However, remember there is no such thing as true chaos as chaos has a pattern. Thus embrace this development for we are trend players and not chickens that squawk the moment we smell change. For the umpteenth, we are going to raise all the overbought and extreme ranges as V readings show no sign of letting up. If you look at the reading going back to Dec 16, 2009, you can see how insanely high this indicator is trading. Note that when we launched this indicator, readings were in the 300 ranges. This further cements the argument that the central driving theme in the world (and not just the U.S) is going to be to “polarise the masses”. Do not become part of the crowd for they are going to go insane and lose a lot in the process; you, on the other hand, could stand to benefit tremendously provided you do not lose control. ~ Market Update Feb 20, 2017
The crowd has gone insane at least when it come to the markets. Remember, that the mass mindset does not refer to just the small players. Hedge fund managers and even big players are all part of the mass mentality. Look at Bill Ackman, he finally conceded defeat and sold his position in Valiant Pharmaceuticals at what could very well turn out to be the bottom. Would it not have made sense to sell it earlier, why now, when the stock is trading close to the levels it was trading in 2005 well before it took off?; a classic example of the mass mindset in action; buying when you should have been selling and selling when buying probably makes more sense.
Individuals falsely assume that big hedge funds or mutual funds cannot be part of the mass mindset. Some of the biggest players are nothing but cattle, they just give the impression that they know what they are doing, but in the end, they are just following each other to the Promised Land, which usually turns out to be den full of vipers. Insanity (madness) is a very powerful force; never underestimate it.
Conclusion
As insanity is the main driving force, caution is called for, and we are going to change our tactics. At this point, the Markets are trading in the extremely overbought ranges on both the weekly and monthly charts. We are not stating that the markets are going to crash or that they need to crash. What we are stating is that common sense says that an old bull market such as this one needs to let out a healthy dose of steam. At this point, the risk to reward ratio is not strongly in our favour. We still view substantial pullbacks as buying opportunities unless the trend changes, but the pullback would have to sharp in nature.
“A fanatic is one who can’t change his mind and won’t change the subject.” ~ Winston Churchill

 My mentor and friend Larry Edelson had an uncanny ability to correctly identify market tops and bottoms.
This includes calling the 1987 stock market crash weeks in advance. Plus, the great bull market bottom in gold that began at $250 an ounce in 2001, and the bear market top at over $1,900 in 2011.
What’s Larry’s secret weapon that made him so prescient with his market calls?
Larry’s life’s work over four decades was the study of cycles. He quantified and cataloged historical cycles stretching back hundreds and even thousands of years. He combined this with cyclical pattern recognition across hundreds of markets and individual securities.
Plus, he added his own unique methods of technical analysis, to produce one of the most effective trading tools any investor could hope for: His Artificial Intelligence Neural Net model with the power to indicate expected cycle highs and lows in stocks, bonds, commodities, currencies and more.
Larry devoted these last three years pouring himself and his vast investing experience into this model. And as my mentor of 15 years, he entrusted me and his team of analysts and traders here at Weiss Research with his most closely guarded secrets and strategies for reliably detecting key market turning points.
In tribute to Larry, we simply call it the Edelson Wave Model.
The proof of Larry’s model is in the consistent profit potential it generates.
Just recently, most Wall Street analysts were calling for crude oil to break out on the upside and soon reach $60 a barrel as a result of the OPEC agreement among oil producing nations to limit production. But Larry was not one of them.
The Edelson Wave Model steadfastly and correctly disagreed with Wall Street. Our research pointed to a break-down in oil below the recent trading range.
Sure enough, crude oil plunged nearly 15% over the last three weeks, right on cue with Larry’s model. Members of one of his trading services earned gains of over 26% in the process from a well-timed trade on an inverse ETF that tracks oil.
Larry also correctly called the bottom in gold and mining stocks in late 2015, but warned that the first leg of the new bull market rally last year would falter, with a steep correction testing the patience of precious metals bulls.
Again, the model was right on the money with precious metals suffering a steep correction during the second half of 2016. Gold and silver stocks plunged more than 40% after this correct call.
 |
| Earlier this year, we correctly called – and profited from – the rally in gold. |
Early this year, we correctly called – and profited from – the rally in gold with multiple rounds of profits earned for subscribers. This time from ProShares Ultra Gold (UGL) and VelocityShares 3x Long Silver (USLV) leveraged ETFs – and once again, thanks to the E-Wave model.
More recently, Larry’s cycle models warned of a disturbance in the uptrends for gold and silver. The system identified an early warning flag: A bearish non-confirmation between gold itself and gold mining stocks.
While gold prices continued to move higher, gold mining shares started moving the opposite way. Seasoned technical analysts like Larry can spot trouble ahead with this indicator, signaling a correction is likely.
Right again, as mining stocks led gold and silver into another correction. This time, his members profited with the Direxion Gold Miners Index Bear 3x ETF (DUST).
Bottom line: Right up to his final days, Larry worked tirelessly to perfect his models and generously passed on his life’s work so future generations of investors would continue receiving his real-time guidance and forecasts. For me and our entire team here at Weiss, it is now our mission to fulfill Larry’s legacy, and to constantly improve the effectiveness of his proven, and highly profitable, approach to cycles analysis.
Good investing,
Mike Burnick
http://www.moneyandmarkets.com
also:
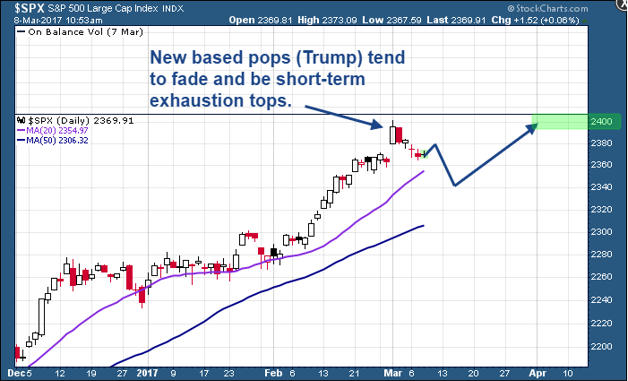
The U.S. stock market remains in a full-blown bull market with President Trump re-energizing the base. The U.S. stock market has temporarily become overbought and is likely due for a pause before the next new impulse wave up resumes.
My research indicates…
This Bull Market is not over. After this, it will move much higher!
Courtesy of TMTF service
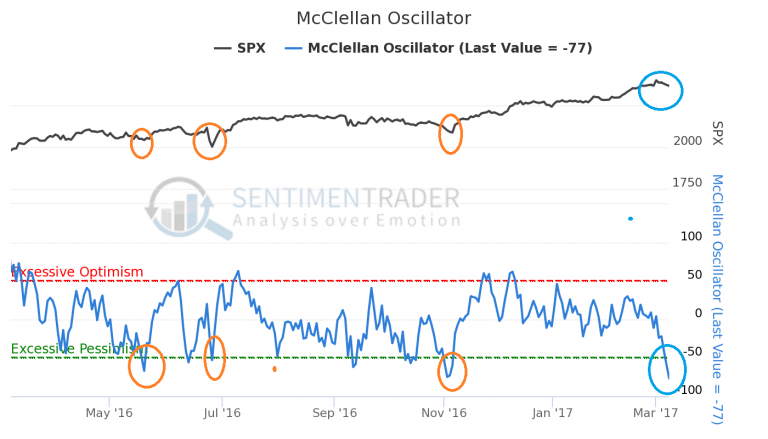
The chart, displayed below, is an overbought/oversold indicator which when it pushes above +100 or below -100, respectively, the indicator will hit its’ extreme point. The market then respond to it which indicates a change in the market’s trend.
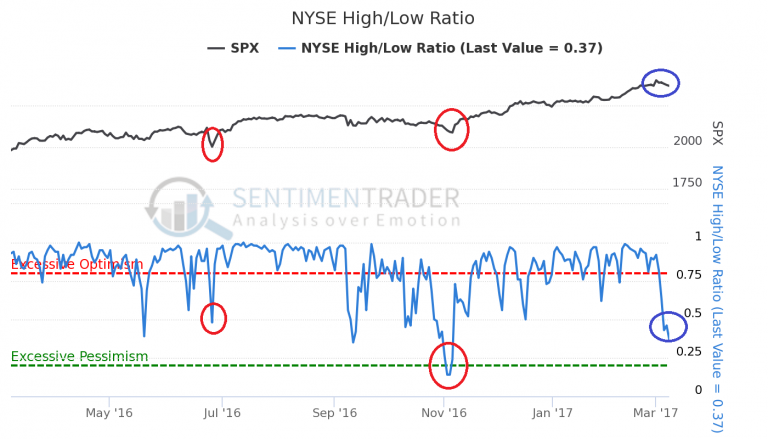
This is a breath indicator constructed from new high/new low ratios. New highs are the number of NYSE issues which closed at a new 52-week high. New lows are the number of NYSE issues that reached a new 52-week low. It is expressed as the number of issues, that closed at a new high, as a percentage of the total. These overbought/oversold indicators are effective when implemented as a contra-trend signal. It is reflecting a down trend and the indicator is becoming oversold. This suggests that an upside reversal will be forthcoming.
U.S. Economic Confidence Index at Record High
The Gallup’s U.S. Economic Confidence Index soared seven points to reach +16 ending on March 5th, 2017.The current conditions component score is at a record monthly high.
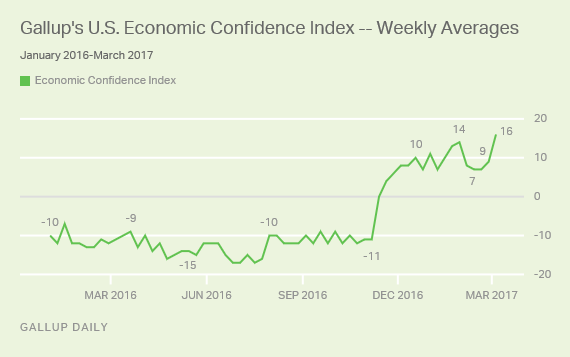
Americans are very optimistic as this marks the highest weekly average ever, in Gallup’s nine-year trend.
President Trump gave his State Of The Union Address to Congress on February. 28th, 2017, emphasizing his key economic policy goals! Traders on Wall Street were decidedly upbeat. The stock market rallied gloriously the following day on Wednesday, March 1st, 2017. The Dow Jones industrial average closed above 21,000 for the first time in its history.
A recently released Gallup Poll, “President Donald Trump’s address to Congress on Tuesday night had a positive effect on many of those who watched it or read news coverage about it later. Almost six in 10 of this group rated the address as excellent or good, and more than one in three said it made them more confident in Trump’s abilities to carry out his duties as president”.
Regardless of where all the markets are going, trading and focusing on our Momentum Reversal Method (MRM) and trading only the hot stocks and sectors, for quick oversized gains, is my expertise. Therefore, these momentum trades are moving significantly in one direction on heavy volume. The length of time for which we may hold a momentum trade depends on how quickly the trade is moving — with trades lasting 3-25 days in length and then we look for a 7%- 35% potential gain.
Conclusion:
There is some selling out there taking place. We are comfortable with this and think its needed for the markets to continue higher. We think this move is bullish and is providing new opportunities to trade this week.
By: John Winston
and Chris Vermeulen
….related:
Fed Rate Hikes, Fiscal vs. Monetary Policy and Why Again the Case for Gold?

 “Today’s headline refers to the fact that, really for the first time since the Trump rally began, it actually feels like the market may have achieved exhaustion.”
“I would at least bring up the point because if I’m right we will see some weakness, followed by a failing rally, followed by a whole lot of pain…”
‘Let’s Get Straight To the Points”
….read the entire article HERE
…also from King World:
James Turk – What Is Happening In The Gold & Silver Markets Right Now Is Extremely Rare


-
I know Mike is a very solid investor and respect his opinions very much. So if he says pay attention to this or that - I will.
~ Dale G.
-
I've started managing my own investments so view Michael's site as a one-stop shop from which to get information and perspectives.
~ Dave E.
-
Michael offers easy reading, honest, common sense information that anyone can use in a practical manner.
~ der_al.
-
A sane voice in a scrambled investment world.
~ Ed R.
Inside Edge Pro Contributors

Greg Weldon

Josef Schachter

Tyler Bollhorn

Ryan Irvine

Paul Beattie

Martin Straith

Patrick Ceresna

Mark Leibovit

James Thorne

Victor Adair