
Currency
The low oil price continues to wreak financial havoc on the largest oil producer in the Middle East. While the Mainstream press has published articles forecasting a rebound in Saudi Arabia’s financial outlook, due to higher oil prices this year, it seems like the Kingdom’s problems are just beginning.
In order to make up for falling oil revenues, Saudi Arabia has been liquidating its foreign currency reserves at a pretty good rate over the past two and a half years. I discussed this in my article, Bankrupting OPEC… One Million Barrels Of Oil At A Time. In that article I published this chart:

Due to the rapid oil price decline, Saudi Arabia liquidated 27% of its foreign currency reserves. At its peak, Saudi Arabia held $797 billion in foreign currency reserves. In just two and a half years, Saudi Arabia’s currency reserves declined $258 billion (U.S. Dollars) to $536 billion currently (Dec 2016).
I also published the following chart showing Saudi Arabia’s foreign currency reserves declined in 2016, even as the oil price recovered from a low of $30.7 in January to a high of $53.3 in December:

Now, what’s even more interesting… is that Saudi Arabia’s foreign currency reserves took another BIG HIT in January, by falling $12.5 billion in just one month:
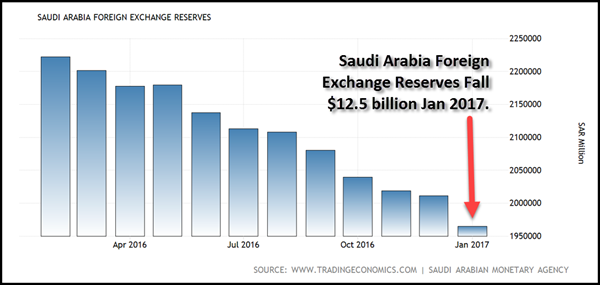
Saudi Arabia’s foreign currency reserves fell from $536.3 billion in Dec 2016, to $523.8 billion in January. The chart displays the figures in Saudi Arabia Riyal. They were converted to U.S. Dollars. This is a pretty good drop in just one month. Moreover, this occurred even as the oil price increased to $54.6 a barrel in January versus $53.3 in December.
I would imagine some would assume that this fall in exchange reserves may have been due to the recent Saudi oil production cut. While it is true that Saudi Arabia has cut oil production, as well as exports, this only accounts for a small portion of the $12.5 billion decline in foreign currency reserves.
For example, according to the Bloomberg article, Saudi Arabia Oil Tanker Tracking Shows Exports Slide In February:
While Saudi Arabia has the ability to store crude — meaning that its exports aren’t perfectly correlated with production — a month-on-month decline in exports would support the country’s assertion it’s cutting back. Exports fell from about 7.16 million barrels a day in January, according to Bloomberg calculations based on industry standard cargo sizes.
Saudi Arabia exported about 7.64 million barrels a day in October, according to figures from the Joint Organisations Data Initiative. Riyadh-based JODI collates data including production and exports directly from countries. Shipments exceeded 8 million barrels a day in both November and December. The deal to cut supply took effect at the beginning of the year.

The article states that Saudi Arabia’s oil exports declined from 8+ million barrels per day in November and December, down to 7.16 million barrels per day in January. If we do some simple math, we have the following:
JAN 2017 = 1 million barrel per day cut x 31 days = 31 million barrels X $54.58 = -$1.7 billion
If we assume that Saudi Arabia was paid spot price of $54.58 for each barrel (they didn’t, they have long-term contracts), then they would have lost $1.7 billion in oil revenue for the 1 million barrel per day cut in exports in January. So, if we subtract the $1.7 billion in lost oil revenues in January from the $12.5 billion in foreign exchange reserve liquidation, there’s a difference of about $10.8 billion.
For whatever reason, Saudi Arabia had to sell off another $12.5 billion of its foreign exchange reserves in January to make up for lost oil export revenue. To make matters even worse, Saudi Arabia To Slash Capital Expenditures by 71%:
With the largest budget shortfall among the world’s 20 biggest economies, Saudi Arabia is planning more austerity measures this year. The kingdom will scrap projects worth more than $20 billion as it comes to terms with cheaper oil.
According to the Saudi government’s bond prospectus obtained by Bloomberg, capital expenditure is expected to fall to $20.6 billion (75.8 billion riyals) this year compared with $70.2 billion (263.7 billion riyals) in 2015. Two years ago, the country’s capital spending was $98.6 billion (370 billion riyals).
Saudi Arabia is in serious trouble if it has to cut its capital expenditures by 71% this year. In addition, the Kingdom is placing its hope on the upcoming Saudi Aramco IPO. Saudi Aramco values its assets at $2 trillion and its five percent initial offering could be worth $200 billion. However, Wood Mackenzie believes Saudi Aramco’s assets are worth much less…. 80% less. From the article linked above:
Now, analysts at Wood Mackenzie have conducted their own study of Saudi Aramco, and came up with a completely different (and much lower) figure. WoodMac puts Aramco’s true value closer to $400 billion, eighty percent less than the Saudi estimate, and it arrived at the figure by considering future demand and the anticipated average price of oil (on which profits will depend), as well as Saudi Aramco’s status as a state-run company.
If I had to choose between these two different asset valuations, I would probably side with Wood Mackenzie. I have read several of their reports and trust their figures over the Saudi’s as they are more objective. Regardless, if the oil price continues to decline, Saudi Arabia will likely have to liquidate more of its foreign currency reserves to fill in the gap from insufficient oil export revenues.
According to the data by the EIA – U.S. Energy Information Agency, Saudi Arabia’s oil export revenues fell nearly 50% from $247 billion in 2014 down to $130 billion in 2015. And the figures for 2016 were even worse. The EIA only has data for the first five months of the year, which reports Saudi Arabia’s oil export revenue was a measly $39 billion. Even though the oil price rebounded towards the end of the year, Saudi Arabia’s oil export revenue was probably less than $110 billion in 2016.
Investors need to keep an eye on the U.S. and global oil industries this year. If we do see continued weakness in the oil price, this could spell BIG TROUBLE for an industry that is the backbone of the global economy.
Check back for new articles and updates at the SRSrocco Report.

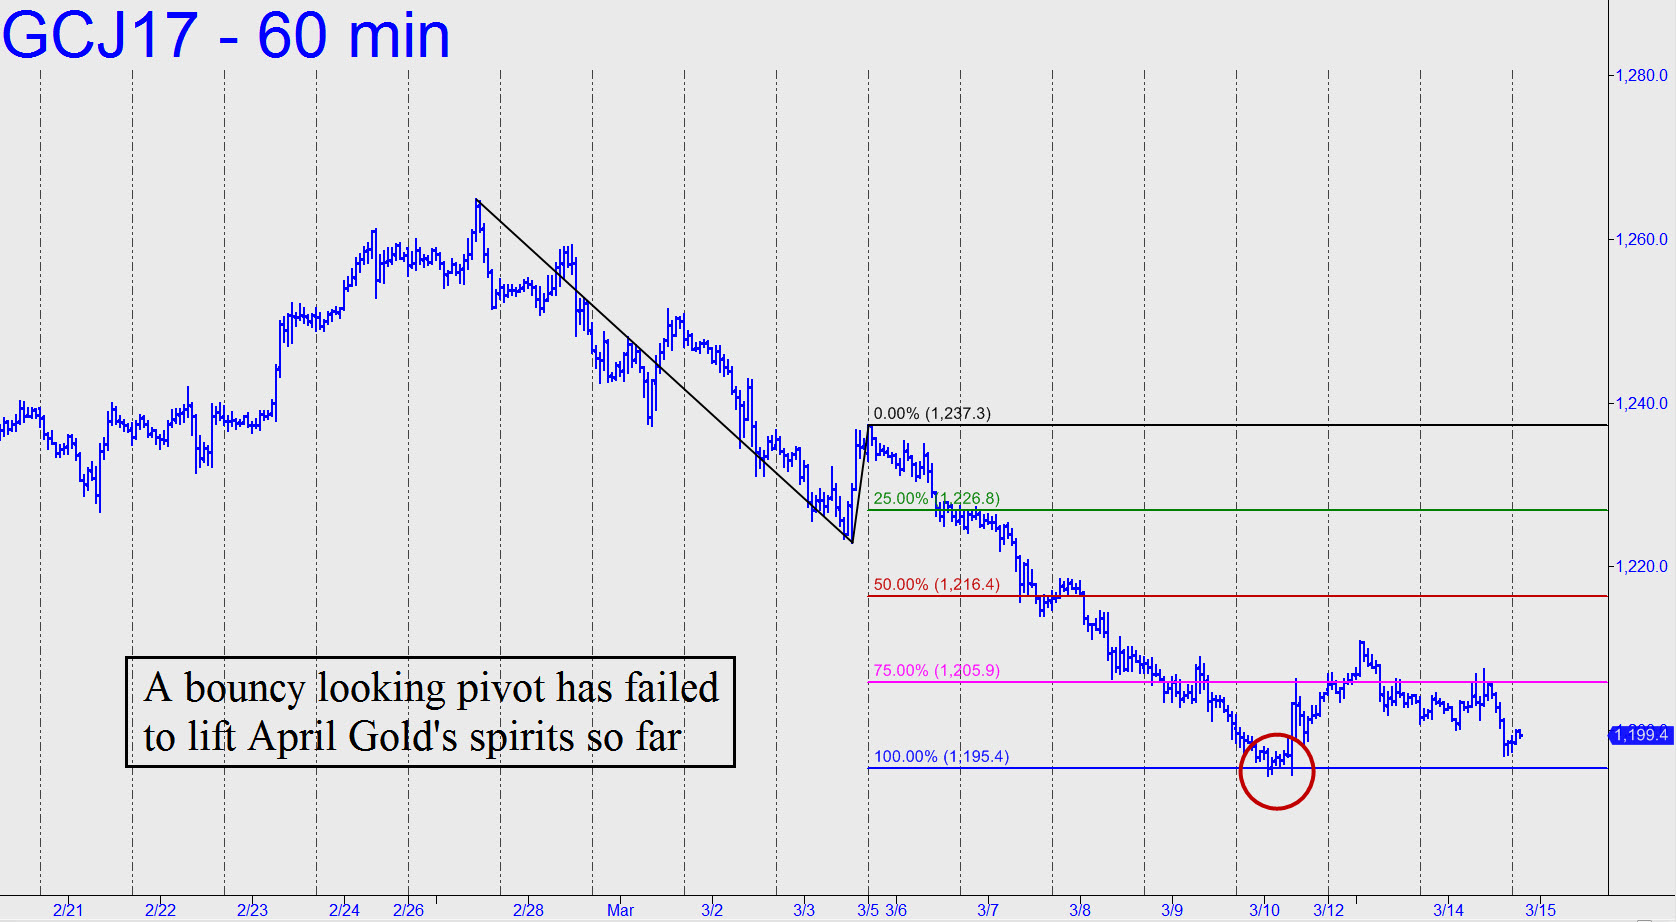
Our downside target for the near-term is 1156.60, a ‘midpoint’ Hidden Pivot that comes from the weekly chart.
April Gold had a chance to rally out of the hole this week from a bouncy-looking pivot at 1195.40. Instead, the futures popped for a few measly points before falling back to the support. This is pretty feeble price action, especially considering the rally had round-number support at 1200.00 going for it as well. Under the circumstances, we should expect the futures to continue lower, eventually turning 1200.00 into resistance.
I’d return reluctantly to the bullish case, at least for the near term, if this vehicle were to leap above 1214.50 in the next day or two. That would generate a bullish impulse leg on the hourly chart — one that presumably would be tradable. Click here for two weeks’ free access to Rick’s Picks
…also: Silver Market Poised For Big Reversal When Institutional Investors Move In

I’ve been thinking about the current Fed Funds rate hike cycle, which is logically gaining forward momentum now that the Fed can stand down from its 8-year, ultra-lenient monetary policy cycle. That is because the Obama administration’s goals required a compliant Federal Reserve to continually re-liquefy the economy as its fiscal policies drained it.
With the coming of Trump mania and its very different fiscal policy goals, we will witness the end of much of what I considered to be the “evil genius” employed by the Federal Reserve, mostly under Ben Bernanke. When he oversaw the brilliant and completely maniacal painting of the macro known as Operation Twist in 2011, I knew we were not in Kansas anymore. We’d gone off the charts and off the balance sheet into a Wonderland of financial and monetary possibilities.
What else would you call a plan to sell the government’s short-term debt and buy its long-term debt in the stated effort to “sanitize” (the Fed’s word, not mine) inflationary signals on the macro? It was evil, it was genius, and it worked. So too did various other financial manipulations that took place before and after Op/Twist. And here we are.
The Republican view is one where businesses and consumers are stimulated, not money supplies. I think it is a better economically, but not by much in this case. That is because the Trumpian ‘reflation’ would simply be another form of man-made stimulation attempting to deny market and economic excesses from being cleared. A normal economy goes through normal cycles. We have not had a normal economy or a normal cycle since at least pre-2000.
Since Alan Greenspan panicked and blew the credit bubble of last decade, we have been on a continuum further into uncharted waters. Trump’s policies are not going to stop it, either. Besides, he inherits this (chart source: SlopeCharts).
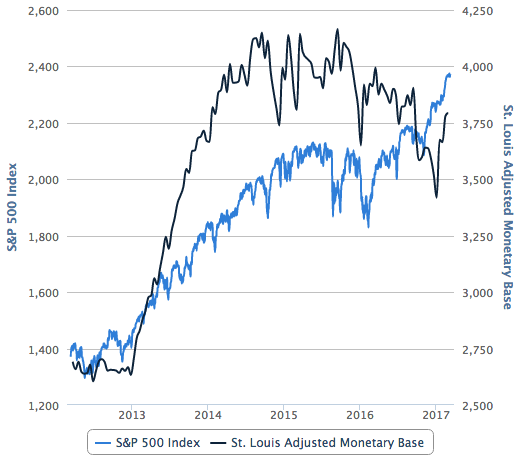
What we see above is a dangerous correlation between Monetary Base, which is the product of monetarypolicy, and the S&P 500. We see that the S&P 500, which followed the Base in lockstep for much of the bull market, is playing a little catch up to the Base, which itself is only bouncing within a topping structure. That is a dangerous looking chart if the assumption that monetary policy will be withdrawn as fiscal policy is anticipated/enacted is a good one.
To put it simply, the Fed is no longer mandated to prop the markets and the economy. The Trump administration is taking that task on. But what about the transition from monetary to fiscal? Ah, the transition. It is in that grey area that the Good Ship Lollypop could get cast about.
The Fed is apparently (finally!) in hawk mode. ‘Trump will free us from the chains of taxation, regulation and an out of control welfare state!’ think legions of happy people and corporations. But if the policy of the last 8 years is replaced and radically changed, there will be a transition period.
There are a lot of similarities to George W. Bush’s first term in office. A new Republican takes over from a 2-term Democrat under whom the markets roared. A rate hike cycle was in play at the end of Clinton’s term. When Bush took over into the jaws of a bear market, that was when Greenspan panicked and blew the millennium’s first bubble. On the next cycle, as G.W. benefited from the resulting inflationary bull market another rate hike cycle was kicked in. Greenspan rode off into the sunset and left a liquidation and crash in the lap of Bernanke and the Obama administration. They immediately went full frontal monetary policy and never looked back.
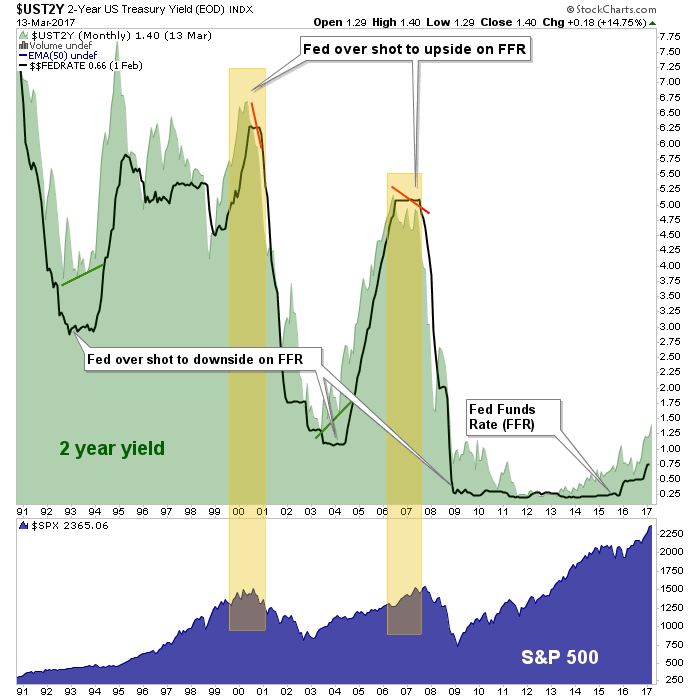
Now here we are. Another rate hike cycle is in the early stages. Normally the early stage of a rate hike cycle is a bullish thing and so far it has been just that. While my other work anticipates a perhaps routine market correction right around now, the favored view holds open new highs later in the year. The Fed Funds rate needs to climb significantly higher after all, in order to trigger the next market crash.
That is what the above chart says if taken at face value. The problem is that with 8 years of pure monetary policy distorting the system in ways that are impossible to quantify, who’s to say that this cycle will not abort at a significantly lower interest rate on the Fed Funds? After all, the entire asset price gambit has been built on ever-expanding debt, has it not?
What again is the case for gold? Real, heavy, in-your-hand gold? It is an anchor to the time before the Good Ship Lollypop set sail on these uncharted waters. Though its ‘on the surface’ fundamentals are not complete yet, there are rocks just beneath the macro’s surface. Those rocks are exponential monetary policy levels being withdrawn. That is enough reason to have monetary insurance, which is gold’s most basic utility.
Aside from the monetary metal, it is advisable to tune out overly conventional analysis that does not look below the surface (unless you day trade and are blissfully concentrating on the daily red and green lights). It is advisable to have balance with respect to your holdings (cash is a holding, folks, and if you own an equivalent like T Bills it is soon to be paying another .25%) and not to run with the herds. For example in the short-term, the pro-inflation/reflation and anti-Treasury bond herds are very crowded.
Given the monetary distortions noted above, the transition to coming fiscal distortions and a general backdrop that people should not pretend to be able to quantify, it is more important than ever to think for yourself and not lap up generic market advise. Have balance *, perspective and for crying out loud, do the work!
* For me this has taken the form of profit taking, loss limiting, rebalancing, cash raising and slowly increasing short positions in less favored areas.
NFTRH.com and Biiwii.com
….also:
The Bull Market Just Turned Eight. What Now?

 “The real estate cycle peaked and it is headed down in terms of appreciation. This is the general market and not the high-end, although that has begun to turn down in many places often due to taxation of rising regulation as in Miami or Sydney Australia.”
….also from Martin:

This proxy for T-Bonds has quietly slipped into no man’s land with the recent breach of December’s bombed-out lows near 116.80. Even before this occurred, TLT looked like a good bet to fall to at least 111.97, the midpoint Hidden Pivot support of the pattern shown. But it would require only a breach of the July 2015 low at 114.88 to do very serious damage to the long-term chart. If the 111.97 target is hit, it would correspond to a rise in long-term interest rates to about 3.37% from a current 3.19%. And if TLT were to fall all the way to the D target at 100.79, yields would be around 3.84%. For borrowers in the U.S. and around the world, this would be more than just a turn of the screw. Indeed, if stock prices were to fall simultaneously as seems logical, it would crush them beyond any hope of recovery. Meanwhile, any counter-stimulus equal to the problem would be tantamount to hyperinflation.
Click here for two weeks’ free access to Rick’s Picks


-
I know Mike is a very solid investor and respect his opinions very much. So if he says pay attention to this or that - I will.
~ Dale G.
-
I've started managing my own investments so view Michael's site as a one-stop shop from which to get information and perspectives.
~ Dave E.
-
Michael offers easy reading, honest, common sense information that anyone can use in a practical manner.
~ der_al.
-
A sane voice in a scrambled investment world.
~ Ed R.
Inside Edge Pro Contributors

Greg Weldon

Josef Schachter

Tyler Bollhorn

Ryan Irvine

Paul Beattie

Martin Straith

Patrick Ceresna

Mark Leibovit

James Thorne

Victor Adair