
Timing & trends
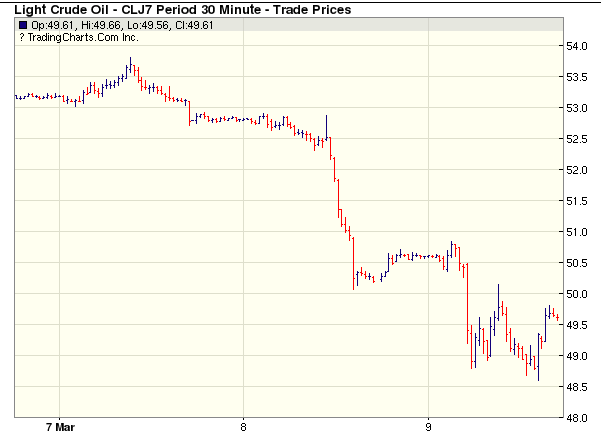
They took the oil and took it down, a stunning build and it turned straight down! When you count the barrels and the oil drilled, a landside brought it down!
A massive crude oil build rocked the oil market in what could be a major downside breakdown that is raising the stakes for OPEC and U.S. shale producers. Will it be cut back or face prices falling even further? Call it a landside if you will, as record long positions in oil ran for their lives and analysts like me are scratching their head to try to figure out how they did not see this historic and record breaking increase in weekly crude oil supply.

 Understanding that one must watch the world to ascertain the trend even domestically is critical – this is what separates a domestic trader from a professional hedge fund manager. You simply have to know what is happening out there on all fronts. Connecting the dots allows you to see the full picture of what exactly you are dealing with.
However, understanding what is taking place in Ukraine is more than a mere subject of depressing corruption and war. What you are looking at is how people respond to events, for when similar events unfold here, since we are all human, we will respond in a similar manner.
There are those who see this as purely a capitalistic system that we live in today. We by no means enjoy such freedom. Communism owns everything and you work for the benefit of the state. Socialism is where you own the property, but the state dictates how much you are allowed to keep from your earnings. Capitalism is where we have the freedom to be what we want. You hear claims on how Hillary was for the middle class yet all the big bankers, hedge funds, and foreign governments supported her. Was this to help the middle class or themselves? Corrupt politicians pretend to care for people and then sell loopholes to the highest bidder. This is not capitalism – this is an oligarchy.
Capitalism would be economic freedom and to achieve that it requires TERM LIMITS, end of political donations, and the end or over regulation such as there were 7 agencies that all approved the CDOs the bankers wanted. Not a single one reviewed anything with an eye on the economy.
This is the two-tier level of importance in observing the world around you. WE WILL GET THROUGH THIS, if we just for once learn how everything works. Then and only then can we take the next step in evolution.

Forex Trading Alert originally published on March 8, 2016, 9:32 AM
Earlier today, the U.S. dollar extended gains against its Canadian counterpart as declining crude oil prices pushed the Canadian currency lower. As a result, USD/CAD reached the next resistance zone. Will it stop currency bulls in the coming days?
In our opinion, the following forex trading positions are justified – summary:
EUR/USD: short (a stop-loss order at 1.0735; the initial downside target at 1.0388)
GBP/USD: none, in other words, taking profits off the table is justified from the risk/reward perspective.
USD/JPY: long (a stop-loss order at 111; the initial upside target at 115.43)
USD/CAD: none, in other words, taking profits off the table is justified from the risk/reward perspective.
USD/CHF: long (a stop-loss order at 0.9891; the initial upside target at 1.0180)
AUD/USD: none
EUR/USD


Looking at the daily chart, we see that EUR/USD moved a bit lower, extending yesterday’s losses. Additionally, the Stochastic Oscillator generated the sell signal, which suggests that further deterioration is just around the corner. If this is the case, and the exchange rate declines from here, the first downside target will be the previously-broken upper border of the blue declining trend channel (currently around 1.0497) and the recent lows. If they are broken, we’ll likely see a drop to around 1.0460, where the 76.4% and 78.6% Fibonacci retracements are.
Very short-term outlook: bearish
Short-term outlook: mixed with bearish bias
MT outlook: mixed
LT outlook: mixed
Trading position (short-term; our opinion): Short positions with a stop-loss order at 1.0735 and the initial downside target at 1.0388 are justified from the risk/reward perspective.
GBP/USD


Quoting our Monday’s alert:
(…) Although the pair rebounded slightly on Friday, the size of the move was tiny compared to the earlier decline, which suggests that we may see a test of the recent low or even a drop to the next downside target – the 70.7% Fibonacci retracement at 1.2194. If it is broken, the way to the next support area (created by the 76.4% and 78.6% Fibonacci retracements around 1.2138-1.2157) will be open. At this point, it is worth noting that in this area is also the lower border of the red declining trend channel (marked on the weekly chart), which increases the probability of reversal.
On the daily chart, we see that currency bears pushed GBP/USD lower (as we had expected) and the pair slipped to our next downside targets. Taking all the above into account, we think that this area could trigger a rebound. Therefore, closing short positions (they were opened when GBP/USD was trading around 1.2383) and taking profits off the table is currently justified from the risk/reward perspective.
Very short-term outlook: mixed
Short-term outlook: mixed
MT outlook: mixed
LT outlook: mixed
Trading position (short-term; our opinion): No positions are justified from the risk/reward perspective now.
USD/CAD


Yesterday, we wrote the following:
(…) although USD/CAD moved a bit lower on Friday, currency bears didn’t manage to push the pair lower, which resulted in a consolidation around the January 20 high. Taking this fact into account and the current situation in the medium-term chart, we think that currency bulls will push USD/CAD to around 1.3454, where the next resistance zone (created by the 76.4% and 78.6% Fibonacci retracements) is.
From today’s point of view, we see that the situation developed in line with the above scenario and USD/CAD reached our next upside targets. Taking into account the yellow resistance zone, the 161.8% and 73.2% Fibonacci extensions and the current position of the daily indicators (they are very close to generating sell signals), it seems that the exchange rate could correct the recent upward move in the very near future. Therefore, closing long positions (they were opened when USD/CAD was trading around 1.3190) and taking profits off the table is currently justified from the risk/reward perspective.
Very short-term outlook: mixed
Short-term outlook: mixed
MT outlook: mixed
LT outlook: mixed
Trading position (short-term; our opinion): No positions are justified from the risk/reward perspective now.
Thank you.
The following published for our subscribers March 2, 2017.
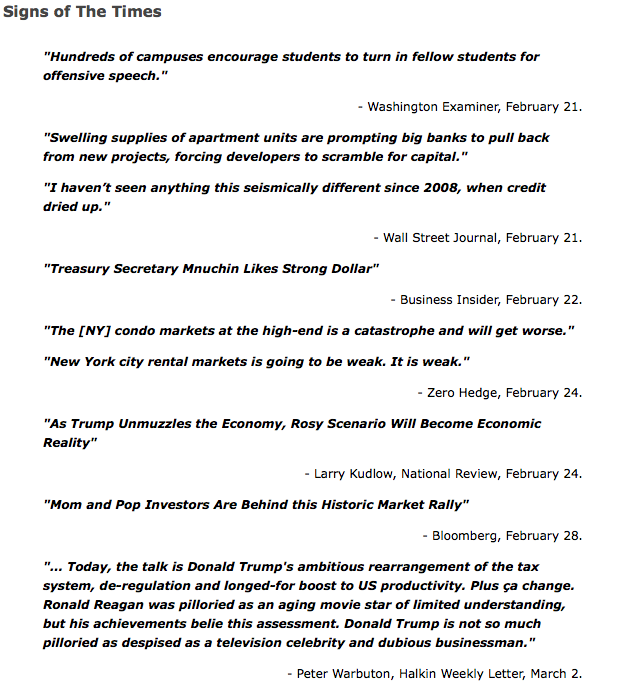
Perspective
What a range of headlines!
The first one about “informing” is right out of Totalitarianism 101, common to both international or national socialism. The one about banks pulling back from lending to condo developers reminds of Mises’ view on a contraction. At the top, the banks don’t have to call the loans, they just become nervous and stop making them. Then there would be the reversals in the credit markets.
Mom and Pop are in the stock market and Kudlow is writing about “Rosy Scenarios”.
The question is not about can it get any better?
It is about how long can it stay wonderful?
Stock Markets
Since November our theme has been “Rational Exuberance”, discounting the change from anti-business to a pro-business administration. Quite likely the most exciting such change in US history. But last week we concluded that with the action becoming sensational, “Rational” is no longer part of the theme. But “Irrational” seems not yet at hand, leaving us with “Exuberance”.
This, for example, has driven the Weekly RSI on the DJIA to 81, which is getting up there. But can be seen in previous strong advances out of a deflated condition. That was ending a year ago.
And how long can this phase run?
We will stay with the theme that the “good stuff” could run into March.
Industrial commodities, particularly crude, have been expected to be firm into March, providing support for the stock markets. However, the firming dollar could constrain further advances.
The other carrier of the good times has been narrowing credit spreads which have been likely to be a positive into March. The action is somewhat overbought, but March is not over.
The rise is encompassing most sectors and is becoming outstanding. This form of outstanding action can run until momentum takes a break. Also, there is the indicator attendant to extremes, and that is the “Hindenberg”, which has yet to register.
The February 16th ChartWorks outlined the possibility of an “ABC” type of correction. This would follow the completion of the momentum move. As noted, that would be signaled by the S&P taking out the 12-Day ma.
We used some seasonal influences to carry us this far in the rally. At times, the NYSE Margin Debt can guide and Ross has taken his thorough approach. The series is available from 1962 and the observation is that with the latest report at record highs the NYSE rally has further to go. The key will be a downtick in Margin combined with a MACD “Sell”.
Nice to have another technical tool.
Currencies
The DX got overbought at 103.85 at the end of December, which was within the ChartWorks long-term “model”. A correction was possible and we have been looking for the DX to base with the 20-Week ema. This was the case at the start of important rallies in 2014, 2015 and 2016.
The exponential moving average has based and is turning up. The DX has been staying above the line, which is constructive. Breaking above 102 is the next step, which was accomplished today. Above the last high at 103.85 and the uptrend will have resumed.
With this, the “model” provides a target of 112, which would be the best rally since 2014.
The Canadian dollar has weakened. And given the technical arithmetic, the 20-Week ema has guided the swings down. This began following the peak with commodities at 106 in 2011.
This week, the C$ slipped below the ema. It may take some work to fail, but the long-term trend is down.
Precious Metals
Our February 9th Pivot reviewed that rally and noted that the gold stocks were not outperforming the bullion price. A correction for the sector was possible.
The high for the GDXJ was 43 on February 8th and it has declined to 34.40. This week’s drop took out the 200-Day at 39 and the 50-Day at 36.80.
The decline is down to 35 on the Daily RSI. Close to 30 would be oversold enough to end the move.
What prompted our concern was that HUI/Gold reached a high in early February and rolled over. We will be watching for the next low.
The gold/silver ratio has suddenly become volatile which often precedes a change in the financial markets.
The ratio slumped from 70 on Monday to 67.8 early today. At the close it had jumped to 70, a big move for this item.
Rising through 71 will set the uptrend and that would suggest a significant setback in the credit markets.
Home Sales & Interest Rates

Source: Zero Hedge
- Mortgage rates are plotted with a 3-month lead.


Link to March 3, 2017 Bob Hoye interview on TalkDigitalNetwork.com:http://www.howestreet.com/2017/03/03/market-exuberance/
Listen to the Bob Hoye Podcast every Friday afternoon at TalkDigitalNetwork.com

After finishing 2016 up 25 percent, commodities are getting another boost from bullish investors. Investment bank Citigroup forecasts commodity prices will increase this year on strengthening demand in China and mounting inflation inspired by President Donald Trump’s “America First” policies. Commodity assets under management globally stood at $391 billion in January, up 50 percent from the same time the previous year, according to Citigroup.

Meanwhile, hedge fund managers significantly raised their bets that copper and oil prices have much further to climb, Bloomberg reported, with net-long positions in the Comex and Nymex markets surging to all-time highs.
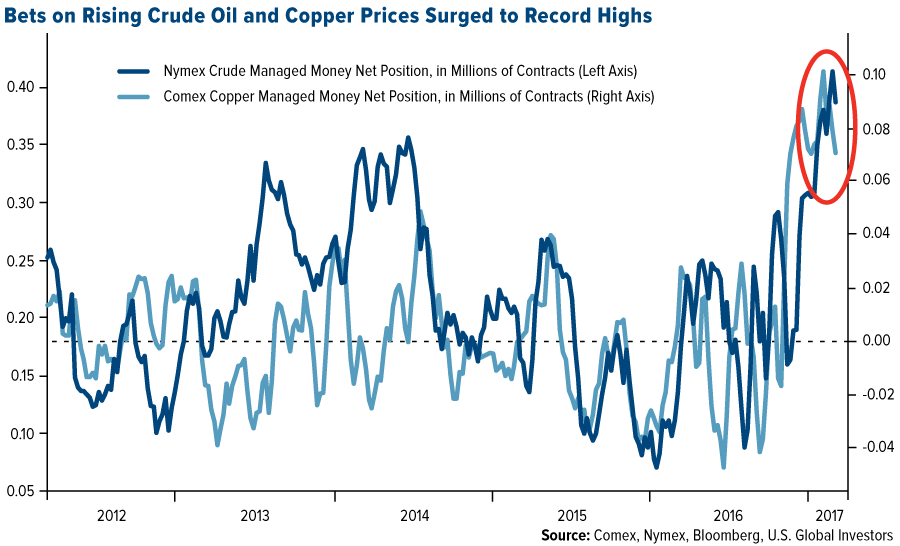
In addition, global manufacturing activity has expanded for the past six straight months, a good sign for commodities demand going forward. As I shared with you earlier in the week, the global purchasing managers’ index (PMI) advanced to a 69-month high of 52.9 in February, with strong showings from the U.S. and eurozone.

Asia Looking for $26 Trillion: Asian Development Bank
As for China and the rest of Asia, a recent special report from the Asian Development Bank (ADB) calculates the cost to modernize the region’s infrastructure at between $22.6 trillion and $26 trillion from 2016 to 2030. This comes out to about $1.7 trillion a year in global investment that’s required to maintain Asia’s growth momentum, deliver power and safe drinking water to millions, connect towns and cities, improve sanitation and more.
As you can see in the chart below, the bulk of the infrastructure need is in East Asia, which is seeking more than $16 trillion between now and 2030.

Governments have devoted funds to support only some of the projects. Currently, 25 economies in the region are spending a combined $881 billion annually on such projects, leaving a substantial spending gap for global investors to fill. This is an unprecedentedly huge opportunity for commodity and materials investors.
To make investment more attractive, however, regulatory and institutional reforms will need to be made in the region.
China, for instance, announced plans to curb aluminum, steel and coal production in an effort to combat air pollution. According to the Financial Times, as many as 30 northern Chinese cities are expected to cut aluminum capacity by more than 30 percent, a move that’s seen as very favorable to the rally that’s already helped the base metal gain over 11 percent so far in 2017.

In the past five trading days, shares in leading aluminum producer Aloca have surged on the news, jumping as much as 9.8 percent on March 1 alone. Since the November election, in fact, the company has gained more than 44 percent on optimism over President Trump’s pledge to spend $1 trillion on U.S. infrastructure.

$3.9 Trillion Still Needed in the U.S.
One trillion dollars sounds like a lot, but it falls remarkably short of the $3.9 trillion the U.S. needs by 2025 to rebuild its own aging infrastructure. That’s the estimate of the American Society of Civil Engineers (ASCE), which gave the nation’s overall infrastructure a D+ in 2013, with “poor” scores given to levees, roads, inland waterways, drinking water and more.
One of the most urgent areas for investment is the nation’s crumbling dams. According to energy news outlet E&E, about 70 percent of America’s 90,000 dams will be at least 50 years old by 2025, putting them near the end of their engineering lifespans. An estimated 15,500 American dams are now considered “high hazard,” meaning their failure could cause fatalities.

The cost of repairing and upgrading these structures is estimated to be around $54 billion.
According to E&E, 80 dams failed in South Carolina in the past two years alone, causing millions of dollars’ worth of property damage. And just last month in a high-profile case, more than 188,000 Californians had to be evacuated to avoid the collapse of the Oroville Dam, the nation’s tallest dam.
Like the ADB’s Asian infrastructure estimate, this has massive market potential. More than 80 percent of U.S. infrastructure, from schools to streets to sanitation, is in either private or municipal ownership. This means commodity and municipal bond investors will need to pick up where federal dollars leave off.
All opinions expressed and data provided are subject to change without notice. Some of these opinions may not be appropriate to every investor. By clicking the link(s) above, you will be directed to a third-party website(s). U.S. Global Investors does not endorse all information supplied by this/these website(s) and is not responsible for its/their content.
The J.P. Morgan Global Purchasing Manager’s Index is an indicator of the economic health of the global manufacturing sector. The PMI index is based on five major indicators: new orders, inventory levels, production, supplier deliveries and the employment environment.
Holdings may change daily. Holdings are reported as of the most recent quarter-end. None of the securities mentioned in the article were held by any accounts managed by U.S. Global Investors as of 12/31/2016.

-
I know Mike is a very solid investor and respect his opinions very much. So if he says pay attention to this or that - I will.
~ Dale G.
-
I've started managing my own investments so view Michael's site as a one-stop shop from which to get information and perspectives.
~ Dave E.
-
Michael offers easy reading, honest, common sense information that anyone can use in a practical manner.
~ der_al.
-
A sane voice in a scrambled investment world.
~ Ed R.
Inside Edge Pro Contributors

Greg Weldon

Josef Schachter

Tyler Bollhorn

Ryan Irvine

Paul Beattie

Martin Straith

Patrick Ceresna

Mark Leibovit

James Thorne

Victor Adair