
Energy & Commodities
One of the biggest questions investors have is what type of environment are stocks and the economy in, deflation or inflation? Knowing the answer to that question can give you a heads up on what different sectors to invest in and what sectors to stay away from. Tonight I would like to update some of the different commodities indexes to see if they can give us any clues on which way the deflationary or inflationary pendulum is swinging. Commodities are often an under analysed asset class as compared to Stocks and Bonds. However they are the nuts and bolts , the real stuff supporting human existence.
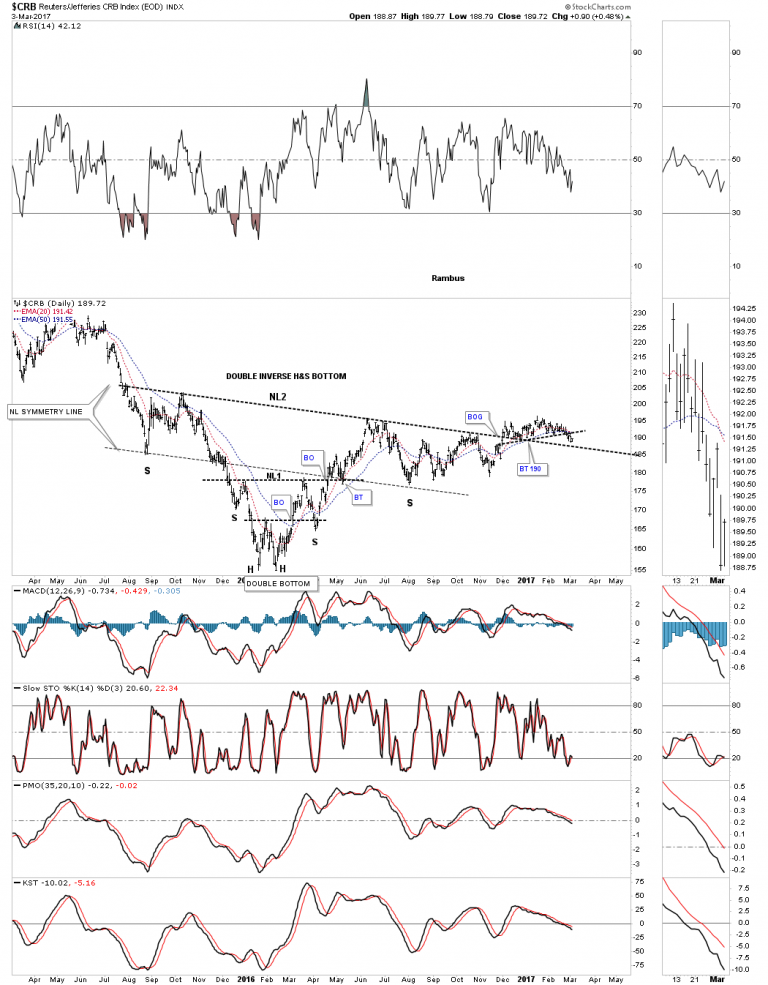
Lets start with one of the oldest commodities indexes around the $CRB index. After the huge impulse move down that began in the middle of 2014, the CRB index finally bottomed in early 2016, putting in a small double bottom which was going to be part of a bigger inverse H&S bottom. After breaking out above NL1 the CRB index then rallied higher stalling out below the 2016 high and began to decline once more. That decline found support at the neckline symmetry line which was a good place to look for a low for the right shoulder of a much bigger double H&S bottom. After trading below NL2 for six months the price action finally broke above it with just a small rally.
From a Chartology perspective nothing is broken yet on the double H&S bottom, but the price action has been very laborious since the December low of last year. Again, nothing is broken, but I see a yellow flag waving that is signaling caution in regards to the double H&S bottom, which we’ll look at in more detail on the next chart to follow this one.


The dollar has been one of the biggest contrarian trades I have seen in years. Every time the market is so certain about the direction it will run, it does the exact opposite and often in extreme fashion. In my last weekend update, I noted how we called the multi-year rally off the 2011 lows when the market was expecting the dollar to crash due to all the QE. And, I also noted how the dollar has been moving down after the Fed has raised rates, despite the common expectations that the dollar should rise.
Some days, if you listen really closely, you can almost hear the dollar laughing as it moves “unexpectedly.”
The same has happened with the Chinese Yuan. Recently, China spent 1 trillion US Dollars (a quarter of their FX reserves) over the past 3 years in an attempt to prop up the Yuan. However, the Yuan still lost close to 14% of its value against the USD over this time period. Moreover, our lead analyst of our Forex Service, Michael Golembesky, appropriately advised a short in this market despite the Chinese “intervention.” In fact, Mike and I wrote several public articles on this potential trade. And, as you know, he has been quite successful in that trade, even though most others in the market would not consider such a trade in the face of the unprecedented action by the Chinese government.
This past week, immediately after the Fed Chairman noted in a speech that it is likely they will raise rates at the upcoming March meeting, we saw the dollar drop lower. And, if you remember my article last weekend, I noted that I see a multi-year top forming in the dollar no matter what the Fed does, and warned you that the dollar can certainly head lower even in the face of the Fed raising rates. While I certainly can be wrong in my analysis and expectations, as I am human, I found it quite interesting that the dollar reacted exactly in the opposite manner in which everyone would expect on Friday, yet again.
And, if these examples make you wonder if any central bank has any real control over the market, then you are finally thinking for yourself in an intellectually honest manner rather than accepting the current “market-think.” This should truly make you realize that “manipulation” is not what moves the market in its larger trends.
As far as the short term, the market still has not made it abundantly clear that a long-term top has finally been struck for wave (3). The current rally has been quite overlapping, but still leaves the potential open to the market making a higher high in the 104-105 region in an ending diagonal. We still would need to break below 100.41 to invalidate that potential. But, I suspect that the market has completed wave (3), since we have struck the long-term trend line, as well as long term target we set years ago.
See charts illustrating wave counts on the U.S. Dollar Index (DXY).
Avi Gilburt is a widely followed Elliott Wave technical analyst and author of ElliottWaveTrader.net (www.elliottwavetrader.net), a live Trading Room featuring his intraday market analysis (including emini S&P 500, metals, oil, USD & VXX), interactive member-analyst forum, and detailed library of Elliott Wave education.

 One of the traditional signs of market tops is individual investors finally succumbing to the lure of apparently easy money and pouring their savings into the stock market. In the past this dumb money flowed into equity mutual funds in general. But today it’s favoring exchange traded funds (ETFs) that, rather than trying to pick winners, simply offer exposure to sectors or broad market indexes.
ETFs Race to Fastest Yearly Start Ever Based on Inflows
(Wall Street Journal) – Investors poured $62.9 billion into exchange-traded funds in February, pushing the year-to-date world-wide tally to $124 billion, the fastest start of any year in the history of the ETF industry, according to data from BlackRock Inc.
U.S. ETFs accounted for $44 billion of that, pushing assets in U.S. funds to almost $2.8 trillion.
Most of the money went to cheap, index-tracking ETFs, a sign that the price war in ETFs isn’t over yet. BlackRock’s iShares ETFs were the biggest winner, and its low-cost Core series garnered the bulk of the $38 billion global haul.
“All of the money is going into the cheapest and most boring ETFs. This is the retail investor getting back into the market with a vengeance,” said Dave Nadig, chief executive of ETF.com, an industry website owned by Bats Global Markets, newly a subsidiary of CBOE Holdings Inc.The Rise of the ‘Do-Nothing’ Investor
Passive mutual funds are growing rapidly, pushing aside stock pickers and changing the investment world. Click here to read more about The Wall Street Journal series.The fastest-growing ETF so far this year is the iShares Core Emerging Markets ETF, which took in $4.2 billion in the first two months of the year, 18% of its assets, according to FactSet. Three other Core ETFs that invest in U.S. stocks were also among the top gainers last month.
Why is this a sign of a market top? Because small investors tend to trade on emotion rather than logic or expertise.
It takes them a long time to forget the pain of the last bear market, so they avoid the early stages of recoveries. When they finally conclude that there’s money to be made, it’s usually too late.
And why are individual investors only the second dumbest money? Because governments are even less astute and more emotional than individuals, and their plunge into equities is just beginning. Japan’s central bank is now one of its market’s biggest “investors” while the Swiss National Bank is a huge holder of blue chips like Apple and Microsoft. See We’re All Hedge Funds Now, Part 4: Central Banks Become World’s Biggest Stock Speculators.
In the next downturn — which, based on most valuation measures, seems imminent – the US Fed and European Central Bank will find that interest rates are too low for big further cuts while the supply of bonds is insufficient for big new QE programs. So they’ll join Japan and Switzerland in buying stocks. They’ll do so indiscriminately, creating their own index ETFs and throwing money at a broad range of large cap stocks, possibly pushing prices to levels that history would consider insane. In other words they’ll act like retail investors on steroids.
But that’s a story for the next cycle. This time around the fact that individuals pouring in is all we need to know.
Originally sent to subscribers on March 6, 2017, 6:56 AM.
Briefly: In our opinion, speculative short positions are favored (with stop-loss at 2,410, and profit target at 2,200, S&P 500 index).
Our intraday outlook is bearish, and our short-term outlook is bearish. Our medium-term outlook remains neutral, following S&P 500 index breakout above last year’s all-time high:
Intraday outlook (next 24 hours): bearish
Short-term outlook (next 1-2 weeks): bearish
Medium-term outlook (next 1-3 months): neutral
Long-term outlook (next year): neutral
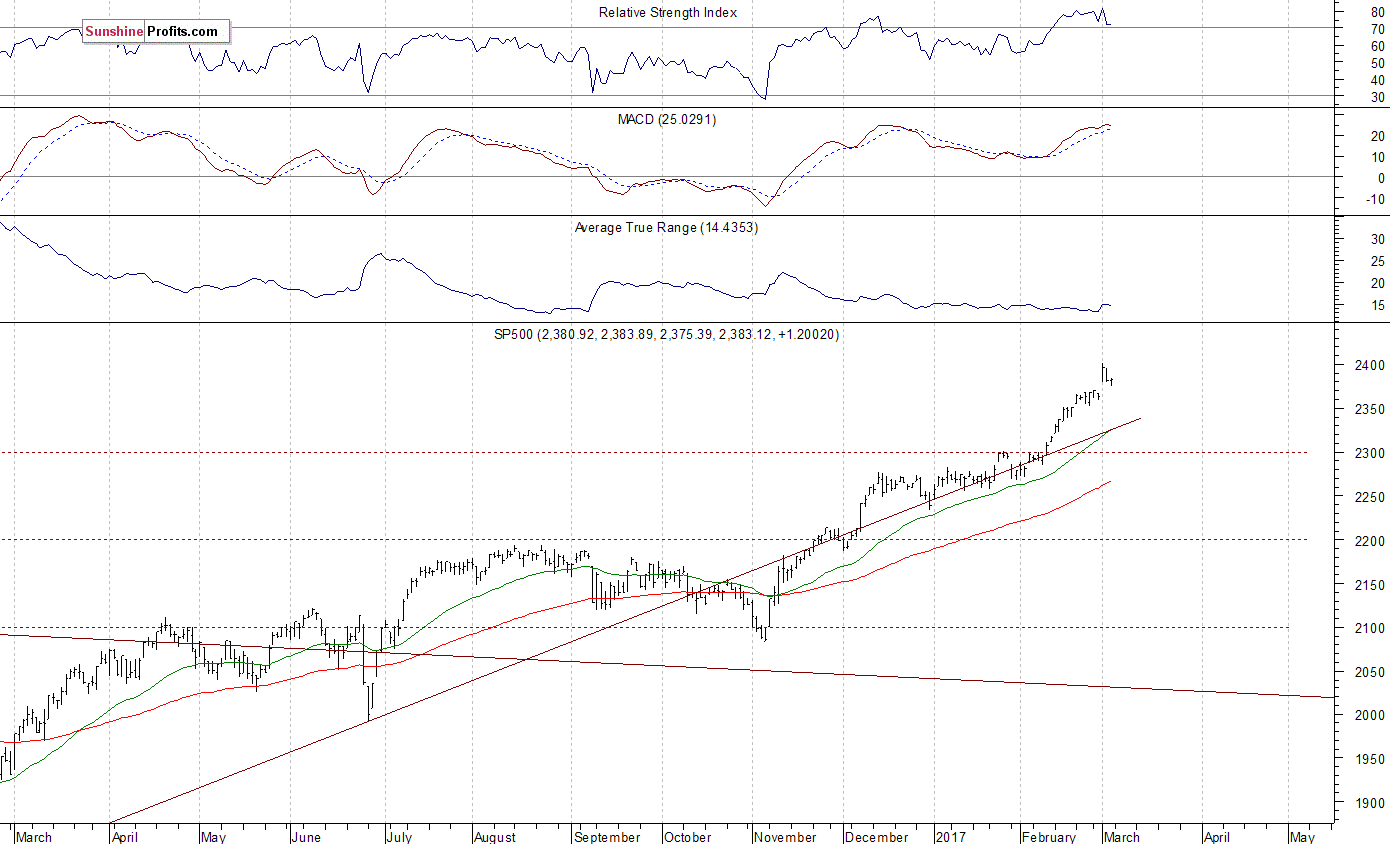
The U.S. stock market indexes were mixed between 0.0% and +0.2% on Friday, as they extended their short-term consolidation following Wednesday’s rally after Donald Trump’s address to Congress. The S&P 500 index remained relatively close to its new all-time high of 2,400.98. The Dow Jones Industrial Average continued to trade along 21,000 mark on Friday, and the technology Nasdaq Composite index remained close to the level of 5,900. All three major stock market indexes continue to trade close to their new record highs. The nearest important level of support of the S&P 500 index is at around 2,365-2,380, marked by Wednesday’s daily gap up of 2,367.79-2,380.13. The next support level is at 2,350-2,355, marked by previous daily gap up of 2,351.16-2,354.91. The support level is also at around 2,320. On the other hand, the nearest important level of resistance is at 2,390-2,400, marked by all-time high. Will the market extend its year-long medium-term uptrend even further before some more meaningful downward correction? We can see some short-term volatility following almost four-month-long rally off last year’s November low at around 2,100. Is this a topping pattern before downward reversal? The uptrend accelerated on Wednesday, and it looked like a blow-off top pattern accompanied by some buying frenzy. The S&P 500 index continues to trade above its medium-term upward trend line, as we can see on the daily chart:
Expectations before the opening of today’s trading session are slightly negative, with index futures currently down 0.1-0.2%. The European stock market indexes have lost 0.3-0.4% so far. Investors will now wait for the Factory Orders number release at 10:00 a.m. The market expects that it grew 1.0% in January. The S&P 500 futures contract trades within an intraday uptrend, following an overnight move down. The nearest important level of resistance is at around 2,380-2,385, marked by some short-term local highs. On the other hand, support level is at 2,365-2,370, marked by local low and previous resistance level. The market slightly extended its short-term move down following last week’s rally. Is this a new downtrend or just quick downward correction before another leg up?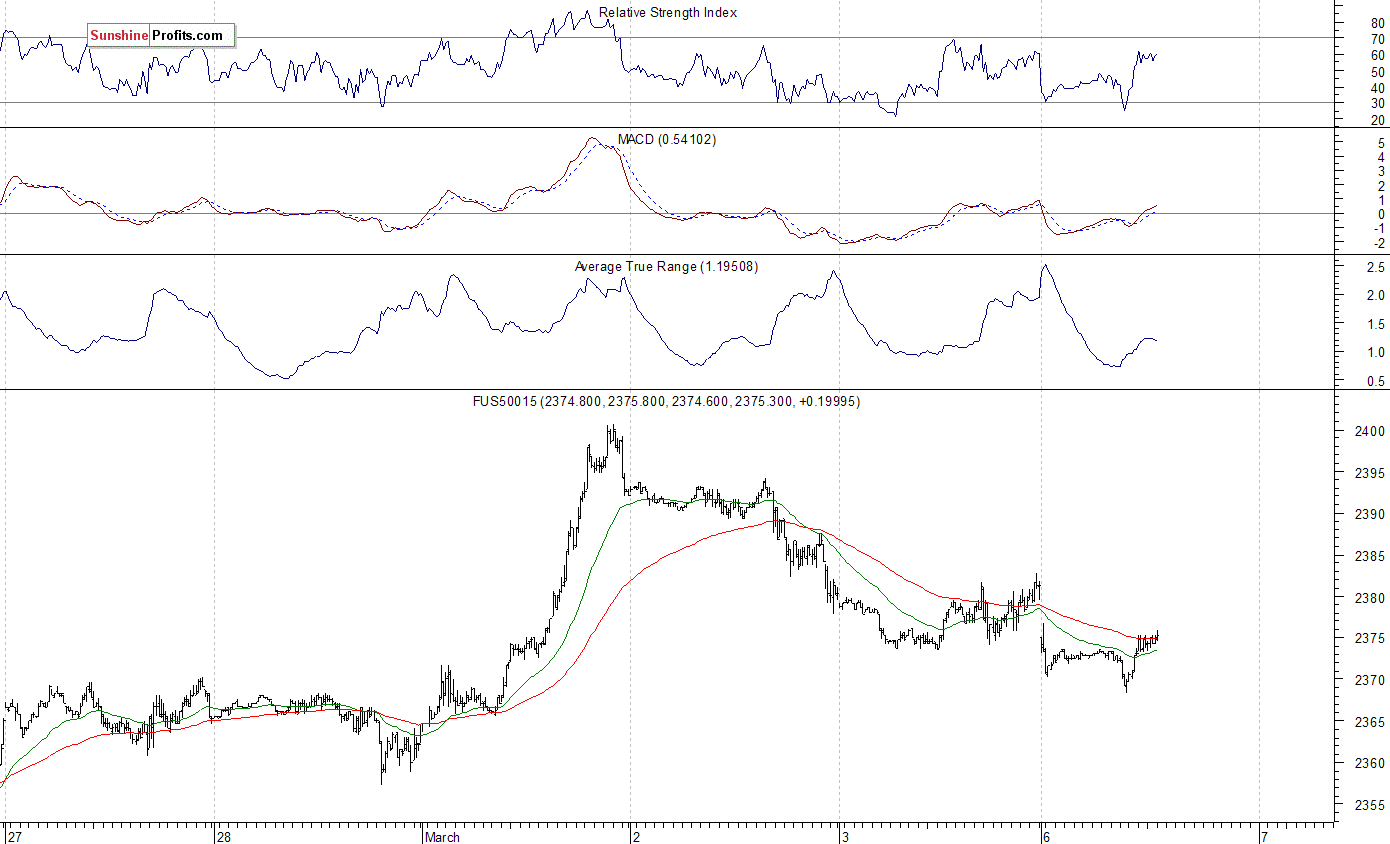
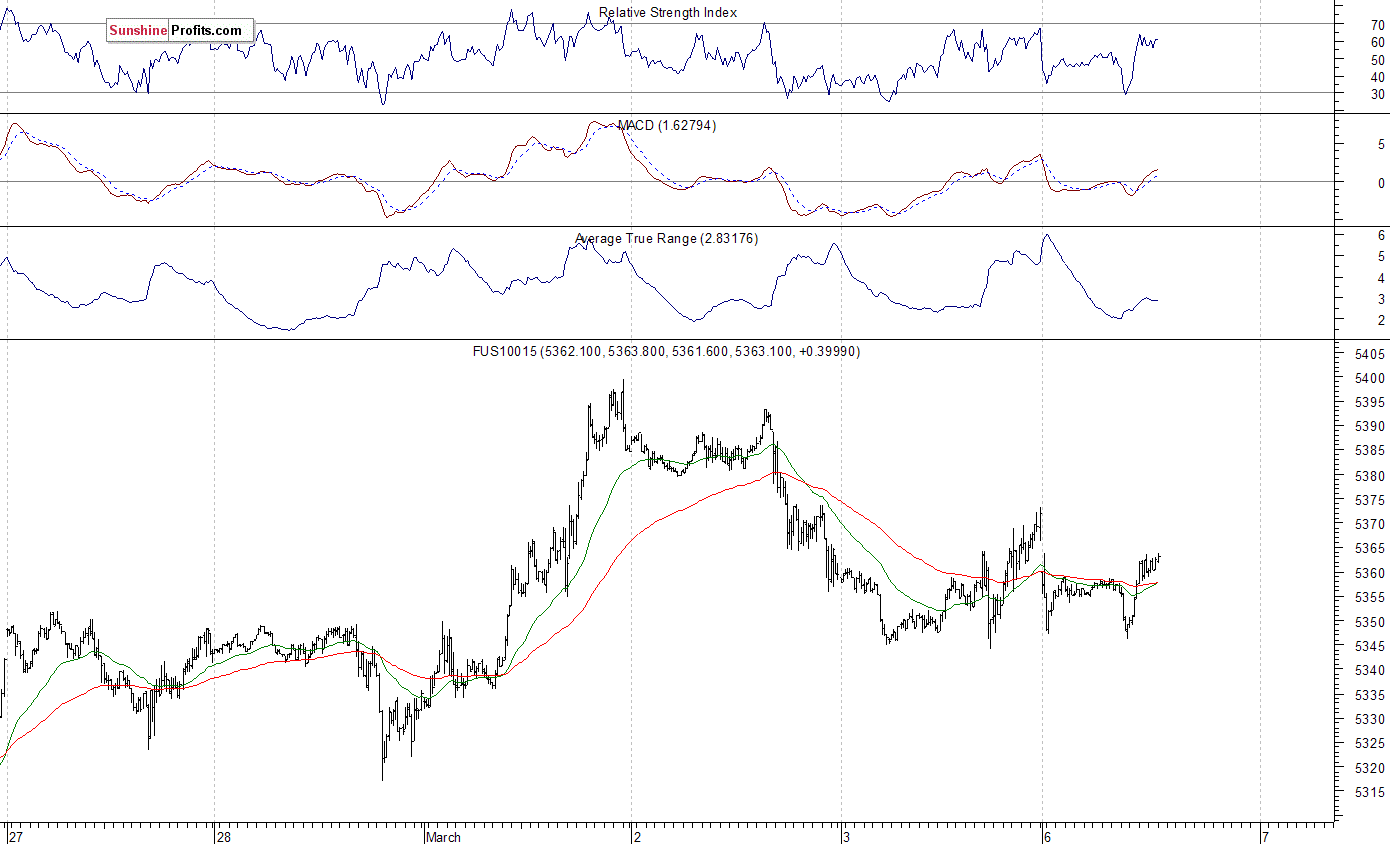
The technology Nasdaq 100 futures contract follows a similar path, as it currently trades within an intraday uptrend after an overnight decline. It has retraced most of its Wednesday’s rally to new record high at around 5,400. The nearest important support level is at around 5,340-5,350, marked by local lows and previous level of resistance, and the next level of support remains at 5,280-5,300. On the other hand, resistance level is at 5,380-5,400. The futures contract trades within a short-term consolidation, as the 15-minute chart shows:
Concluding, the broad stock market retraced some of its Wednesday’s move up on Thursday and Friday, as the S&P 500 index bounced off resistance level at 2,400 mark. For now, it looks like a downward correction within an uptrend. But will the uptrend continue even further despite some clear short-term overbought conditions? Or is this a topping pattern before some more meaningful downward correction? There have been no confirmed negative signals so far. However, we still can see medium-term overbought conditions accompanied by negative technical divergences. Therefore, we continue to maintain our speculative short position (opened on Wednesday, February 15 at 2,335.58 – opening price of the S&P 500 index). Stop-loss level is at 2,410 and potential profit target is at 2,200 (S&P 500 index). You can trade S&P 500 index using futures contracts (S&P 500 futures contract – SP, E-mini S&P 500 futures contract – ES) or an ETF like the SPDR S&P 500 ETF – SPY. It is always important to set some exit price level in case some events cause the price to move in the unlikely direction. Having safety measures in place helps limit potential losses while letting the gains grow.
To summarize: short position in S&P 500 index is justified from the risk/reward perspective with the following entry prices, stop-loss orders and profit target price levels:
S&P 500 index – short position: profit target level: 2,200; stop-loss level: 2,410
S&P 500 futures contract (March) – short position: profit target level: 2,197; stop-loss level: 2,407
SPY ETF (SPDR S&P 500, not leveraged) – short position: profit target level: $220; stop-loss level: $241
SDS ETF (ProShares UltraShort S&P500, leveraged: -2x) – long position: profit target level: $15.47; stop-loss level: $12.98
Thank you.
Paul Rejczak
 Summary
Natural gas repeats its February 2016 performance.
Liquefied NG is the future for the industry.
LNG a buy.
APA and DVN are scale-down buys.
UNG is another way to play natural gas for the months ahead.
Natural gas has seen lots of volatility over past months and speculative interest is at the highest level in years. With the price of the energy commodity falling, it is possible that some real future opportunities are currently available in the natural gas market for those brave enough to become a contrarian or buy certain assets during the current selloff.


-
I know Mike is a very solid investor and respect his opinions very much. So if he says pay attention to this or that - I will.
~ Dale G.
-
I've started managing my own investments so view Michael's site as a one-stop shop from which to get information and perspectives.
~ Dave E.
-
Michael offers easy reading, honest, common sense information that anyone can use in a practical manner.
~ der_al.
-
A sane voice in a scrambled investment world.
~ Ed R.
Inside Edge Pro Contributors

Greg Weldon

Josef Schachter

Tyler Bollhorn

Ryan Irvine

Paul Beattie

Martin Straith

Patrick Ceresna

Mark Leibovit

James Thorne

Victor Adair