
Timing & trends
DOW + 301 on 1000 net advances
NASDAQ COMP + 79 on 1350 net advances
SHORT TERM TREND Bullish
INTERMEDIATE TERM Bullish
STOCKS: Sometimes we’re not sure why the stock market does what it does, but this time there is no doubt. President Trump’s tone caught many doubters off guard. He was presidential and positive.
Of course, underneath, things haven’t changed. Investors continue to be encouraged by promises of lower taxes, less regulation and infrastructure spending.
After struggling for a while with Dow 20,000, the blue chip index spent just 24 sessions going the next 1,000 points, tied for the fastest ever/
GOLD: Gold dropped $4. It was down much more intraday. Less political tension dissuaded buyers.
CHART The volume rose sharply on the QQQ which is the ETF for the NASDAQ 100. This frequently marks some sort of a turn, Usually it’s seen at bottoms, but occasionally at tops. We’ll need to keep an eye n this short term indicator. We’re indebted to our friend Tom McClellan of the McClellan Financial Publications for pointing this out.

BOTTOM LINE: (Trading)
Our intermediate term system is on a buy.
System 7 We are in cash. Stay there for now.
System 8 We are long the SSO at 85.05. If there are more declining issues than advancing ones at 3:35 EST on Thursday, sell at the close.
NEWS AND FUNDAMENTALS: Personal income rose 0.4%, better than the anticipated 0.3%. The PMI mfg. index was 54.2, less than the expected 55.0. The ISM mfg. index came in at 57.7, better than the expected 56.4. Construction spending dropped 0.1%, worse than the expected rise of 0.05%. Oil inventories rose 1.5 million barrels. Last month, they rose 600,000.
INTERESTING STUFF: Paul Krugman, Nobel laureate economist with the New York Times said back in November that if Donald Trump won, the stock market would drop and never come back.
TORONTO EXCHANGE: Toronto rose a cool 200.
BONDS: Bonds dropped sharply.
THE REST: The dollar surged. Silver flat to down. Crude oil lost ground.
Bonds –Bullish as of Feb. 6.
U.S. dollar -Bullish as of Feb. 9.
Euro — Bullish as of December 2.
Gold —-Bullish as of Feb. 16.
Silver—- Bullish as of Jan. 31.
Crude oil —- Bearish as of Nov. 29.
Toronto Stock Exchange—- Bullish from January 22, 2016
We are on a long term buy signal for the markets of the U.S., Canada, Britain, Germany and France.
|
|
Wed. |
Thu. |
Fri. |
Mon. |
Tue. |
Wed. |
Evaluation |
|
Monetary conditions |
-1 |
-1 |
-1 |
-1 |
-1 |
-1 |
0 |
|
5 day RSI S&P 500 |
86 |
87 |
89 |
90 |
68 |
88 |
– |
|
5 day RSI NASDAQ |
89 |
67 |
70 |
76 |
50 |
74 |
– |
|
McCl- lAN OSC. |
+12 |
+11 |
-2 |
+13 |
-39 |
+7 |
0
|
|
Composite Gauge |
8 |
10 |
8 |
9 |
14 |
7 |
0 |
|
Comp. Gauge, 5 day m.a. |
8.2 |
8.4 |
8.0 |
8.2 |
9.8 |
9.6 |
0 |
|
CBOE Put Call Ratio |
.89 |
.83 |
.83 |
.83 |
1.18 |
.86 |
0 |
|
VIX |
11.74 |
11.71 |
11.47 |
12.09 |
12.92 |
12.54 |
|
|
VIX % change |
+1 |
0 |
-2 |
+5 |
+7 |
-3 |
0 |
|
VIX % change 5 day m.a. |
+1.8 |
-0.4 |
-0.4 |
+1.0 |
+2.2 |
+1.4 |
0 |
|
Adv – Dec 3 day m.a. |
+191 |
+354 |
-63 |
+240 |
-97 |
+243 |
0 |
|
Supply Demand 5 day m.a. |
.86 |
.78 |
.84 |
.80 |
.73 |
.75 |
0 |
|
Trading Index (TRIN) |
1.38 |
1.52 |
1.64 |
.82 |
1.38 |
.61 |
0
|
|
S&P 500
|
2363 |
2364 |
2367 |
2370 |
2364 |
2396 |
Plurality -2 |
INDICATOR PARAMETERS
Monetary conditions (+2 means the Fed is actively dropping rates; +1 means a bias toward easing. 0 means neutral, -1 means a bias toward tightening, -2 means actively raising rates). RSI (30 or below is oversold, 80 or above is overbought). McClellan Oscillator ( minus 100 is oversold. Plus 100 is overbought). Composite Gauge (5 or below is negative, 13 or above is positive). Composite Gauge five day m.a. (8.0 or below is overbought. 13.0 or above is oversold). CBOE Put Call Ratio ( .80 or below is a negative. 1.00 or above is a positive). Volatility Index, VIX (low teens bearish, high twenties bullish), VIX % single day change. + 5 or greater bullish. -5 or less, bearish. VIX % change 5 day m.a. +3.0 or above bullish, -3.0 or below, bearish. Advances minus declines three day m.a.( +500 is bearish. – 500 is bullish). Supply Demand 5 day m.a. (.45 or below is a positive. .80 or above is a negative). Trading Index (TRIN) 1.40 or above bullish. No level for bearish.
No guarantees are made. Traders can and do lose money. The publisher may take positions in recommended securities.

Feb 27th was just another period of back-and-forth movement for gold, silver, the USD Index and even the general stock market – but not for precious metals mining stocks. Gold stocks and silver stocks plunged very visibly – there are very important implications of this move and they are not bullish.
Let’s take a closer look at the charts (charts courtesy of http://stockcharts.com), starting with the GDX ETF (proxy for both gold and silver stocks).
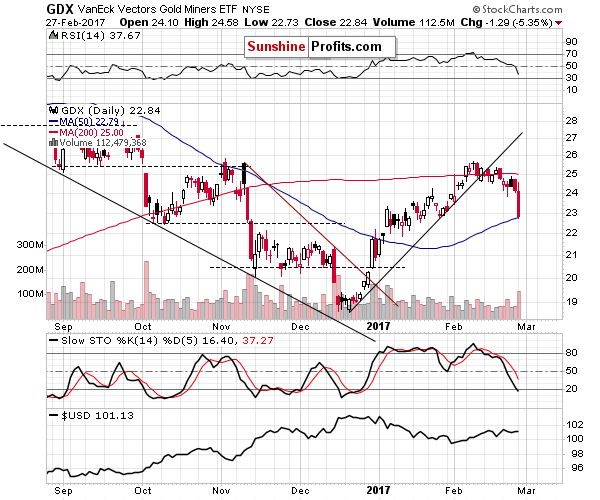
Precious metals mining stocks declined on huge volume and the fact that this happened without the metals’ lead is profound. Miners were a leading indicator in the recent past as well as in the previous years – including the time before THE plunge of 2013. We discussed that in greater detail in yesterday’s gold trading alert, while describing the situation in gold stocks (using the HUI Index as a proxy):
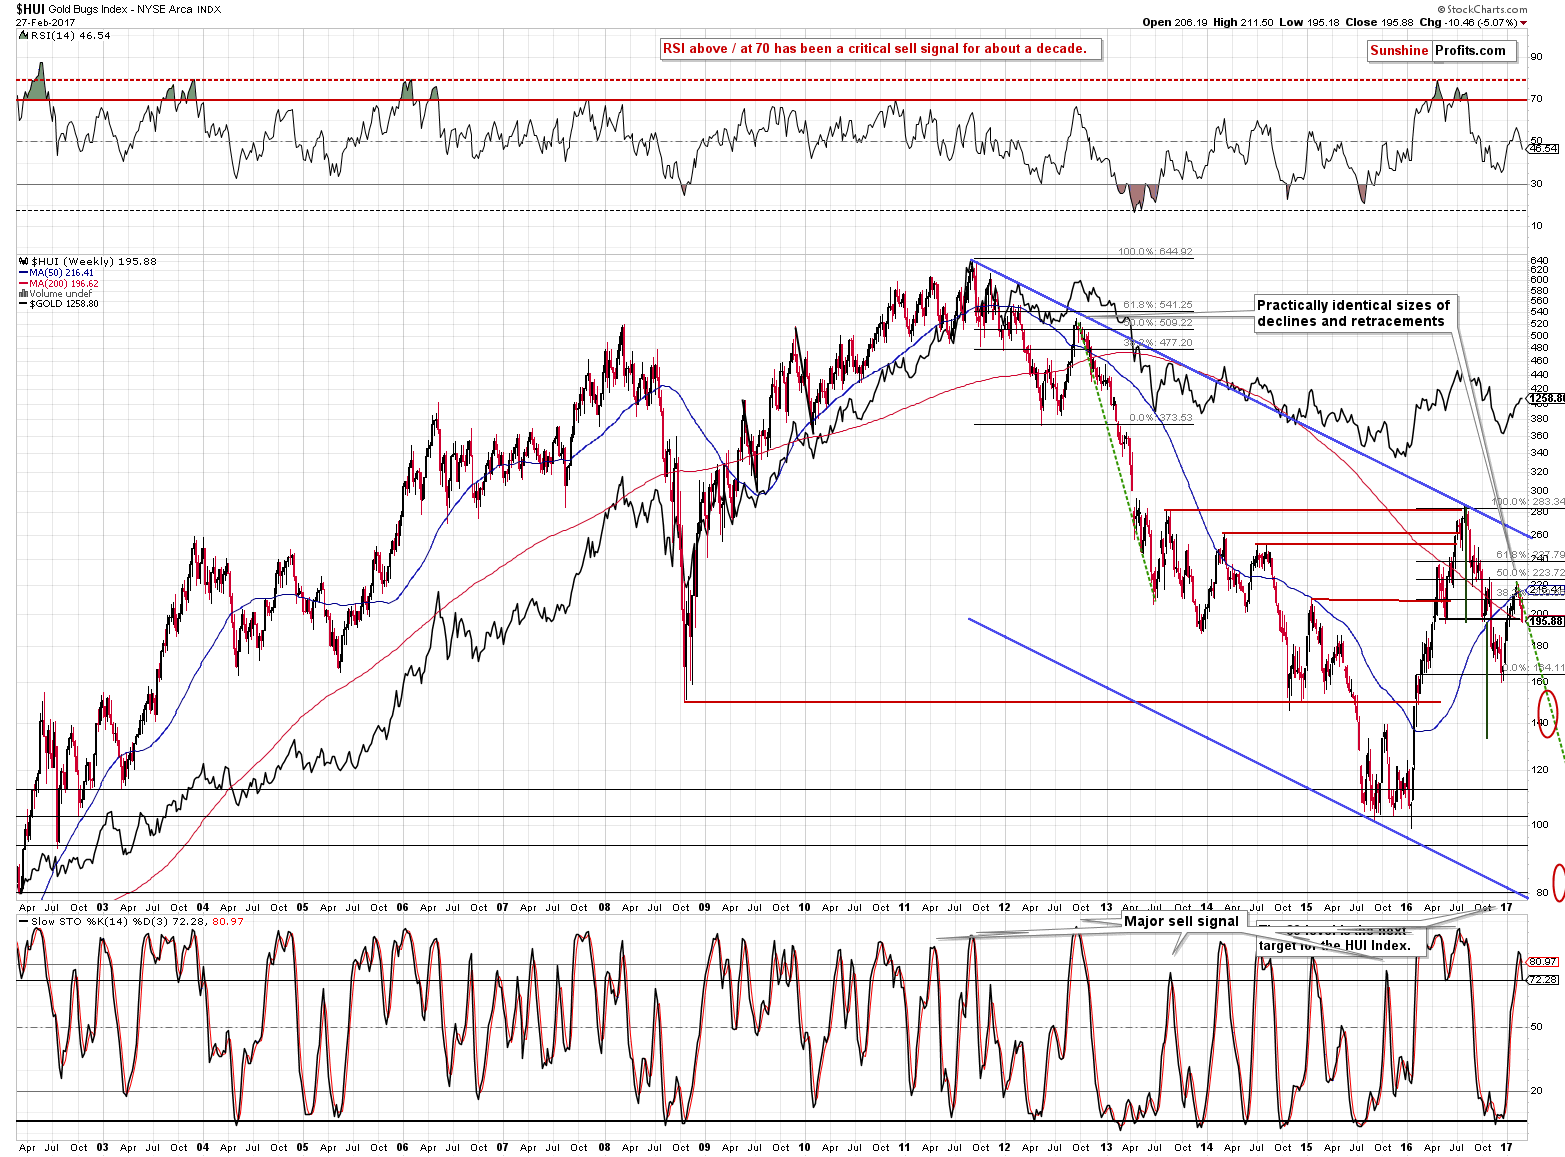
The HUI Index declined by 8 index points (almost 4%) [last week] despite having very strong reasons to move higher. Not only gold rallied, but we also saw higher prices of stocks in general (highest weekly close ever in case of S&P and DJIA) – miners should have rallied strongly and they weren’t just responding weakly – they declined, which is rather extreme. We saw something similar in 2012 and 2013, before the huge plunge in gold.
The above chart features something less visible but still very important. The size of the decline that followed the 2011 top and the size of the subsequent rebound (in the second half of 2012) is practically identical to the decline that we saw in the second half of 2016 and the current rebound. Back in 2012 gold stocks formed a local top after retracing about 50% of the previous decline and it appears that exactly the same thing happened also this time.
But the question remains if the top in metals was just formed or not. The upswing in gold and volume in GLD makes it quite likely.
Interestingly, while the HUI declined by almost 4% last week, it’s already down by more than 5% this week, even though gold is flat. The bearish implications described above clearly remain in place.
We already featured the GDX ETF chart that includes silver stocks, but let’s take a look specifically at them, to make sure that they confirm the observations made while analyzing gold stocks.
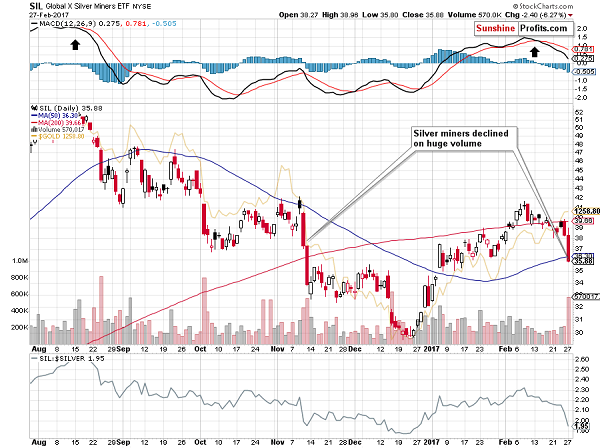
During yesterday’s session alone silver stocks declined about as much as they did from the February top to Friday – the size of the decline just doubled. The volume was huge. Both factors (size and volume) serve as good confirmations of the bearish signals that we discussed earlier.
Summing up, the bearish outlook for the precious metals sector remains in place. While the daily price changes are not particularly meaningful (except the miners’ underperformance – its implications are meaningful and bearish), the long- and medium-term signals that are very important (being highly effective in the past) continue to paint a very bearish picture for the precious metals sector for the upcoming weeks and months. It seems that the following weeks will be more than exciting and we encourage you to stay up-to-date with developments in gold and silver.
Thank you.
Przemyslaw Radomski, CFA
Founder, Editor-in-chief, Gold & Silver Fund Manager
* * * * *
All essays, research and information found above represent analyses and opinions of Przemyslaw Radomski, CFA and Sunshine Profits’ associates only. As such, it may prove wrong and be a subject to change without notice. Opinions and analyses were based on data available to authors of respective essays at the time of writing. Although the information provided above is based on careful research and sources that are believed to be accurate, Przemyslaw Radomski, CFA and his associates do not guarantee the accuracy or thoroughness of the data or information reported. The opinions published above are neither an offer nor a recommendation to purchase or sell any securities. Mr. Radomski is not a Registered Securities Advisor. By reading Przemyslaw Radomski’s, CFA reports you fully agree that he will not be held responsible or liable for any decisions you make regarding any information provided in these reports. Investing, trading and speculation in any financial markets may involve high risk of loss. Przemyslaw Radomski, CFA, Sunshine Profits’ employees and affiliates as well as members of their families may have a short or long position in any securities, including those mentioned in any of the reports or essays, and may make additional purchases and/or sales of those securities without notice.

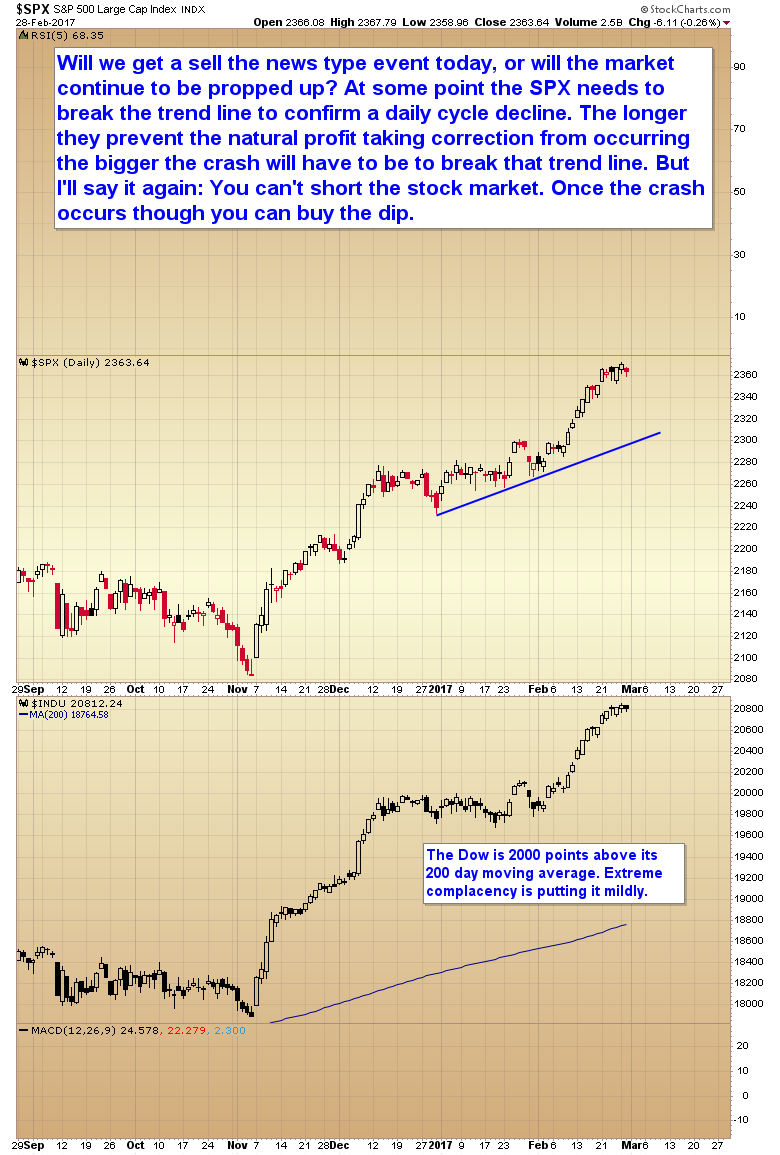
At some point the stock market needs to break the price trend line to confirm a daily cycle decline. The longer they prevent the natural profit taking correction from occurring the bigger the crash will have to be to break that trend line.
Rate hike odds surged as high as 80% following comments today from two Fed presidents. The odds are 62% as I am typing now. Let’s investigate the spike.
The Financial Times reports Market Odds of March Rise in US Interest Rates Hit 80%.
The market odds of a March increase in US interest rates shot up to 80 percent on Tuesday as Federal Reserve policymakers insisted they did not need to see Republican tax reforms and other policies before they act.
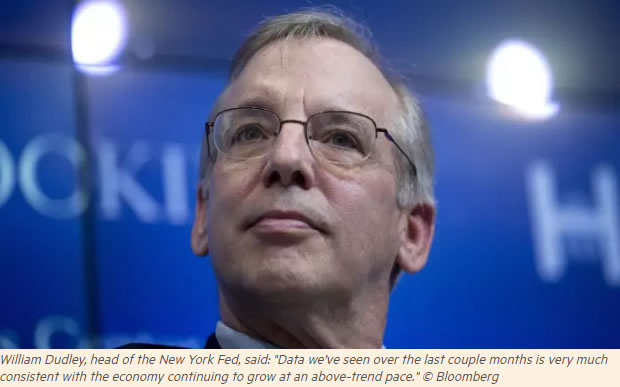
William Dudley, influential head of the New York Federal Reserve, said that the prospects for adding to the December 2016 rate increase had become “a lot more compelling”.
“It seems to me that most of the data we’ve seen over the last couple months is very much consistent with the economy continuing to grow at an above-trend pace, job gains remain pretty sturdy, inflation has actually drifted up a little bit as energy prices have increased,” he said in an interview with CNN.
Mr. Dudley is typically considered to be a dove on the Fed’s policy-setting board, so his remarks were “significant”, according to Thomas Simons, a money market economist at Jefferies, the investment bank.
“For Dudley, this is as hawkish and specific as you’re going to get,” he said
John Williams, president of the San Francisco Fed, said on Tuesday that a move would be “very much on the table for serious consideration” in March.
Parking the question of higher rates until June, on the other hand, would mean another half-year will have passed since the last rate rise in spite of surprisingly strong economic data.
New Standard for “Surprisingly Strong” Economy
I have no idea what “surprisingly strong” economic data they are referring to given that 4th quarter GDP is 1.9%, and the Atlanta Fed GDPNow model suggests 2.5% for first quarter.
Is 2% the new standard for”surprisingly strong” growth?
Yields Jump
Yields jumped across the board, but rates on the short end rose more than the 30-year long bond.
One-Year Treasuries

Two-Year Treasuries

30-Year Long Bond

Rate Jumps
- One-Year Yield +12 Basis Points
- Two-Year Yield +8 Basis Points
- Thirty-Year yield +5 Basis Points
Rate Hike Odds

If the Fed hikes, and I am not convinced they will, we will quickly learn more about the surprisingly strong economy.

 U.S. oil inventories are at record levels, but there are a few glimmers of hope that the glut could be starting to subside.
Storing crude oil for sale at a later date is no longer profitable, as the futures curve has flattened out in recent weeks, depriving traders of a strategy that has served them well over the past few years. The market “contango,” in which front-month oil contracts trade at a discount to oil futures six months or a year out, has all but vanished. The differential must be large enough to cover the cost of storage, and for many time spreads that is no longer the case. After three years of a steep contango, storing oil simply to take advantage of the time spreads is increasingly uneconomical.
One of the more expensive forms of storage is floating on tankers at sea, and because of the narrowing contango, floating storage is unprofitable today. Reuters reports that traders are beginning to unload crude from floating storage along the Gulf Coast. “Right now, traders aren’t incentivized (to store),” Sandy Fielden, director of oil and products research at Morningstar, told Reuters in an interview. “It won’t all stampede out of the gate, but inventory levels will come down. What will happen is that some of it will go to refineries, but a fair amount will be exported too.”
Just as the rapid rise of floating storage in 2015 and 2016 was a sign of the deepening global supply imbalance, draining tankers of stored oil is an early sign that the supply glut is receding.
So far, it is only the most expensive storage facilities that are seeing drawdowns – the U.S. on the whole has seen crude stocks swell to record highs. But oil analysts argue that the surge in crude inventories is a symptom of stepped up imports booked at the end of 2016, when OPEC members pumped out huge volumes of crude just ahead of implementation of their deal to cut production. After a few weeks of transit time, the extra supply started showing up in U.S. storage data in January and February. In other words, the stock builds could be a temporary anomaly.
More recently, the time spreads for Brent futures also indicate increasing tightness in the market. John Kemp of Reuters notes that the spread between futures between April and May has sharply narrowed this month, meaning that the market is betting on a supply deficit as we move into the second quarter. The spreads for May-June and June-July are even smaller, trading at a few cents per barrel. This is a complicated way of saying that there isn’t a way to make money by buying oil, paying for storage, and selling it at a later date.
In a separate report, Reuters notes that inventories are also starting to drawdown in Asia, adding further evidence that the glut is not as bad as feared. As OPEC has throttled back on production, Asia is starting to see the impact. Reuters says that unusually large drawdowns took place across key oil hubs in Asia – 6.8 million barrels of oil were withdrawn from tanker storage off of Malaysia’s coast while Singapore saw a 4.1 million barrel decline and Indonesia’s storage fell by 1.2 million barrels.
“Dancing contango is now not a profitable thing to do, so we’ve sold out,” an oil trading manager told Reuters. The trader no longer stores oil on tankers because of the disappearing contango.
The details of the contango and the oil futures market may seem complex and arcane, but the shift in time spreads is exactly what OPEC has been targeting with its supply cut. By cutting near-term supply, OPEC has succeeded in changing the economics of oil trading, forcing inventories to draw down. That could cause a short-term supply problem as oil is unloaded from storage, but in the long run OPEC needs to drain that excess supply from storage tanks around the world in order to spark higher prices.
Traders are more and more confident that the oil market will experience tighter conditions as we move into the second quarter, a bet that is reflected in both the time spreads and the exceptional buildup in bullish positions on crude oil. The oil price rally is not without its risks – very notable risks that have been covered in previous articles – but for now, the futures market is offering investors and traders some reasons for bullishness.


-
I know Mike is a very solid investor and respect his opinions very much. So if he says pay attention to this or that - I will.
~ Dale G.
-
I've started managing my own investments so view Michael's site as a one-stop shop from which to get information and perspectives.
~ Dave E.
-
Michael offers easy reading, honest, common sense information that anyone can use in a practical manner.
~ der_al.
-
A sane voice in a scrambled investment world.
~ Ed R.
Inside Edge Pro Contributors

Greg Weldon

Josef Schachter

Tyler Bollhorn

Ryan Irvine

Paul Beattie

Martin Straith

Patrick Ceresna

Mark Leibovit

James Thorne

Victor Adair