
Asset protection
If the U.S. stock market begins to move lower, it could trigger an ‘avalanche’ type move, according to The Gloom, Boom & Doom Report’s Marc Faber.
Marc Faber, the editor of “The Gloom, Boom & Doom Report,” predicted the rally’s disruption won’t be caused by any single catalyst. His argument: Stocks are very overbought and sentiment is way too bullish for the so-called Trump rally to continue. “Very simply, the market starts to go down. As it goes down, it will start triggering selling, and then it will be like an avalanche,” said Faber recently on “Futures Now.” “I would underweight U.S. stocks.”

…related:

Since December, I have been discussing the opportunity that existing in the potential for a rotation from the “risk-on”Trump Rally to the “risk-off” safety trade. I stated that in December we began buying these “risk off” trades based on this expectation and adding bonds, utilities, health care, preferred stocks and REIT’s to our portfolios.
The addition of bonds was also done under the premise that while the majority of analysis was discussing the long-term bottom in rates and the obvious move higher, I have not agreed. This is because “real inflation” remains nascent outside of health care and rent. The recent bump in commodity prices has also been a contributing factor to a small degree but has the negative side of fueling input costs that reduce corporate profitability. The rise in commodity prices, primarily oil, has been driven by a strengthening dollar which was something I discussed would happen in May of 2015.
Interestingly, Jeff Gundlach caught up with my stance last week discussing the “stealth rotation.” To wit:
“Not only is the Trump rally over, but stocks are the last to get the memo. That’s the current market summary according to DoubleLine’s Jeff Gundlach who told Reuters that ‘there is a stealth flight to safety going on.’
Among key indicators, Gundlach pointed to German Bunds and especially Schatz (2Yr), noting that ‘German bond yields are leading the way down and Gold is rising.’ He also warned that ‘speculators remain massively short bonds and the market is going to squeeze them out.’”
He is absolutely correct, and both of these are points I have made previously.
“Here is the most important point to remember. Just two months ago, we were told that U.S. equities should rise because bond yields would be low forever, discount rates should trend toward 0%, and therefore equity valuations should trend toward infinity over time.
Now, we’re told that despite bond yields surging we can still count on U.S. equities trending toward infinity because they’re better positioned to absorb higher rates than emerging markets.
It can’t be both.”
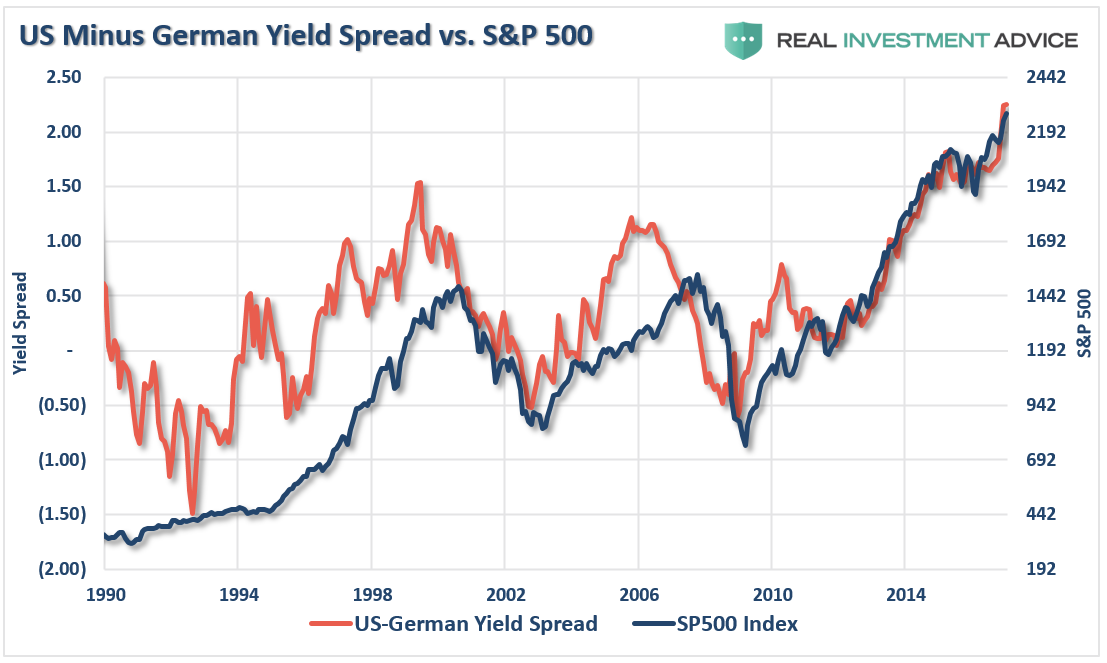
“The chart below shows the 10-year Treasury rate the German Bund rate. Not surprisingly, since rate spreads directly impact economic activity, trade, and currency flows, whenever spreads widen to such a degree, bad things have tended to happen.”

Short term Elliott wave view in SPX suggests that the rally from 1/23 low is unfolding as a 5 waves Elliott wave impulse structure where Minor wave 1 ended at 2301, Minor wave 2 ended at 2267.2, and Minor wave 3 remains in progress but close to ending.
Internal of Minor wave 3 shows an extension and subdivided also as an impulse structure where Minute wave ((i)) ended at 2289.1, Minute wave ((ii)) ended at 2271.6, Minute wave ((iii)) ended at 2368.2 and Minute wave ((iv)) ended at 2352.6.
Index has broken above the previous peak at 2368.2 suggesting Index is likely already in wave ((v)) of 3 towards minimum extension area of inverse 123.6-161.8% fib ext area of proposed wave ((iv)) at 2372-2378.
Once wave 3 is complete, index should do a 3 waves pullback to correct the cycle from 2267.2 in Minor wave 4 before the rally resumes in Minor wave 5. We don’t like selling the Index and expect buyers to appear again after Minor wave 4 pullback is complete in 3, 7, or 11 swing.
SPX 1 hour chart

Elliott Wave Degree

At Elliottwave-Forecast, we offer 24 hour coverage of 52 instruments from Monday – Friday using Elliott Wave Theory as primary tools of analysis. We provide Elliott Wave chart in 4 different time frames, up to 4 times a day update in 1 hour chart, two live sessions by our expert analysts, 24 hour chat room moderated by our expert analysts, market overview, and much more! With our expert team at your side to provide you with all the timely and accurate analysis, you will never be left in the dark and you can concentrate more on the actual trading and making profits. Check out our 14 day Trial to sample everything we have to offer.
 In this week’s issue:
- Weekly Commentary
- Strategy of the Week
- Stocks That Meet The Featured Strategy
- Stockscores’ Market Minutes Video – Why Winning Traders Win Stockscores Trader Training
- 7 Reasons to Say No to the Trade
- Stock Features of the Week – Abnormal Breaks US

Stockscores Market Minutes – Why Winning Traders Win
Seemingly minor differences exist between what winning and losing traders do. This week, I discuss one of these simple differences that came make a massive difference in your trading success. Plus, my weekly market analysis and trade of the week on TV. Click Here to Watch
To get instant updates when I upload a new video, subscribe to the Stockscores YouTube Channel
Trader Training – 7 Reason to Say No to the Trade
As investors, our natural inclination is to seek out stocks that have good qualities. We look for reasons to buy the stocks we are considering and often forget to look for the negatives. Since there are thousands of stocks to consider and almost all of them can have some reason for buying them, it may be better to reverse how we approach the analysis of stocks. Looking for reasons not to buy a stock will emphasize a higher standard for the stocks you do buy and will help to improve your overall market performance.
Here is a list of common reasons I use to throw a stock out of consideration:
Too Much Volatility
Volatility is uncertainty. Virtually every good chart pattern that I use to find winners demonstrates a break out from low volatility. The narrower the range before the breakout, the more important the breakout becomes. If the stock’s price is moving all over the place before it makes a break through resistance then there is a much greater chance that the breakout is false and will likely fall back. Ignore stocks that have a lot of price volatility before the break out.
Not Enough Reward for the Risk
A stock can go two ways, up or down, after you buy it. If the upside potential is not enough to justify the downside risk, then you should ignore the opportunity. I like stocks to have at least double the upside potential for the downside risk. That way, you don’t have to be right even half of the time to make money, provided you are disciplined of course.
Lack of Optimism
Fundamentals do not matter. It is the perception of Fundamentals that matter. If investors are not showing some optimism about a company’s prospects then it is likely that they are not paying any attention to the company’s fundamentals. Look for rising bottoms on the chart as an indication that investors are optimistic, if there aren’t any, leave the stock alone.
No Abnormal Behavior
The stock market is efficient most of the time. That means that you can not expect to consistently beat the stock market because all available information is priced in to the stock and your success at predicting new information can only be random. To beat the market, we have to look for break downs in market efficiency. I find that the best way to do this is look for abnormal behavior in the trading of a stock because it implies that there is significant new information playing a role in the stock’s performance. I don’t consider any stock that lacks abnormal behavior in its recent trading.
Too Far Up
The higher a stock goes, the riskier it becomes. I don’t like to chase stocks higher. If I look at a 6 month chart of a stock and it has made more than two steps up, I don’t consider it. A one day run of substantial gains is not a concern; I want to ignore stocks that have been in upward trends for some time. Look for stocks that are breaking from periods of sideways trading, not up trends.
Lack of Liquidity
The more often a stock trades, the easier it is to get in and out of it. Stocks that are not actively traded tend to have wider spreads between their bids and asks and it can be difficult to move in and out of the stock. Don’t consider stocks that don’t trade every day and they should trade at least 50 times a day but more is better.
Mixed Messages
I always try to look at a stock’s chart on more than one time frame. If the message is not the same on both charts, I leave them alone. When day trading, look at the daily and intraday charts. When position trading, look at the daily and weekly charts.
Any time you think a stock has great potential, give this list a look and see if any of these factors show up. If so, it may be a good idea to move on and look for something else.

This week, I ran the Abnormal Breaks US Market Scan strategy in search of US listed stocks that are breaking from good chart patterns on the daily and weekly time frames. Here are three names that stand out for position trades:

1. IMGN
IMGN made a big upside break with strong volume today, moving up from a rising bottom after breaking the downward trend line in late December. Support at $2.45.
2. AIMT
AIMT breaks the downward trend line from a rising bottom with good volume supporting the strong price action. Support at $19.40.
3. BLD
BLD is breaking out of a cup and handle pattern on the daily with strong price and volume action. Support at $37.95.
References
- Get the Stockscore on any of over 20,000 North American stocks.
- Background on the theories used by Stockscores.
- Strategies that can help you find new opportunities.
- Scan the market using extensive filter criteria.
- Build a portfolio of stocks and view a slide show of their charts.
- See which sectors are leading the market, and their components.
Disclaimer
This is not an investment advisory, and should not be used to make investment decisions. Information in Stockscores Perspectives is often opinionated and should be considered for information purposes only. No stock exchange anywhere has approved or disapproved of the information contained herein. There is no express or implied solicitation to buy or sell securities. The writers and editors of Perspectives may have positions in the stocks discussed above and may trade in the stocks mentioned. Don’t consider buying or selling any stock without conducting your own due diligence.


-
I know Mike is a very solid investor and respect his opinions very much. So if he says pay attention to this or that - I will.
~ Dale G.
-
I've started managing my own investments so view Michael's site as a one-stop shop from which to get information and perspectives.
~ Dave E.
-
Michael offers easy reading, honest, common sense information that anyone can use in a practical manner.
~ der_al.
-
A sane voice in a scrambled investment world.
~ Ed R.
Inside Edge Pro Contributors

Greg Weldon

Josef Schachter

Tyler Bollhorn

Ryan Irvine

Paul Beattie

Martin Straith

Patrick Ceresna

Mark Leibovit

James Thorne

Victor Adair