
Wealth Building Strategies
 I add this, that rational ability without education has more often raised a man to glory and virtue, than education without natural ability. Marcus T. Cicero
Before we get into the meat of this article, we would like to state at the onset that this article is not politically orientated. This election has probably been more divisive than any other election in U.S history. There are those who love Trump and those who detest him. Our views are based on market trends and not politics. Before the election results came in, we went on record to state that a Trump win would from an investing perspective prove to be a great buying opportunity and the masses would panic and dump their shares. We took the same stance on Brexit, and as they say, the rest is history.
From a contrarian angle (and not a political point of view) a Trump win could be construed as a positive development; non-contrarians will demand to know why? Mass Psychology clearly states that the masses are always on the wrong side of the equation. A Trump win will create uncertainty, and the lemmings will flee for the exits; markets will pull back sharply and viola the same old cycle will come into play. The cycle of selling based on fear which equates to opportunity for those who refuse to allow their emotions to do the talking. Tactical Investor
Trump’s agenda is in some aspects strikingly similar to that of Ronald Regan’s who was known for his pro-growth policies. When Regan took office, unemployment was in the 7.5% ranges by the time he left office it had dropped down to 5.4%. GDP growth surged and averaged 3.8% per year. Inflation was brought down to 3.7% and averaged 4.4% during his eight-year reign.
Regan’s massive tax cuts contributed to exponential growth. He cut taxes from 70% to 28% for the top income tax rate, and reduced corporate taxes from 48% to 34%. This iswhat probably helped drive the SPX 400% higher over the past 30 years, and these policies continue to drive the market higher. Trump is seeking to lower corporate taxes from 35% to 15% and has aspirations to reduce taxes for the average American. He also wants to embark on a massive infrastructure restoration plan, which if implemented should create thousands upon thousand of jobs.
Traits that Trump shares with Regan
- Both were outsiders
- Both were TV personalities; the only difference being that Trump is both a television personality and a businessman
- Both were ridiculed by the press and were mostly written off from having any chance at a win
- They both made promises to make America great
So how is Trump’s economy faring?
Well, by looking at the stock market, the outlook appears to be pretty good. The Dow has had Ten winning days in a row and is now up roughly 5% for the year. The markets are forward looking beasts so they appear to be viewing Trump’s economic agenda through a bullish lens. However, everyone is getting excited over this market, which might not be such a good thing in the short term, but that is a story for another day.
Corporations and Wall Street are drooling over the prospect of less regulation and lower taxes and judging by Trump’s recent actions; he looks set to deliver on many of his campaign promises. There is a massive pile of money sitting overseas that corporations would repatriate in a heartbeat under the right conditions. Some estimates put the amount of cash sitting overseas at $2.5 trillion. Trump could soon provide them with that opportunity, and this money among many other things could be used to fund massiveshare buybacks which will only help propel these stocks higher. Among the biggest benefactors from a lower corporate tax rate would be GE, AAPL, and MSFT.
Under Regan the stock market soared, unemployment levels dropped, and GDP growth rates rose significantly. If Trump takes a similar path, then the outlook for the stock market going forward could be quite favourable. However, one should always defer to Mass Psychology; if the crowd turns euphoric than caution is warranted. The time to jump in head first was in Nov of 2015, Jan of 2016 and before Trump won the elections. As the trend is still up, sharp pullbacks have to viewed through a bullish lens. The crowd is not euphoric, but the markets are extremely overbought, so prudence is justified over the short term. Investors should consider waiting for the market to let out a nice dose of steam before jumping in.
A genius can’t be forced; nor can you make an ape an alderman.
Thomas Somerville

Market Summary
The Dow extending its streak of record-setting gains to 11 days, the longest such streak since 1987, as increases in utilities and other safety plays outweighed declines in financials. Both the S&P 500 and the Nasdaq rose for a fifth straight week, while the Dow brought its string of weekly gains to three. As seen in the chart below, since the presidential election the major stock indexes have been on a tear. The only major asset classes to fall during this time are precious metals and bonds which are being adversely impacted by the threat of higher interest rates.

A standard chart that we use to help confirm the overall market trend is the Momentum Factor ETF (MTUM) chart. Momentum Factor ETF is an investment that seeks to track the investment results of an index composed of U.S. large- and mid-capitalization stocks exhibiting relatively higher price momentum. This type of momentum fund is considered a reliable proxy for the overall stock market trend. We prefer to use the Heikin-Ashi format to display the Momentum Factor ETF. Heikin-Ashi candlestick charts are designed to filter out volatility in an effort to better capture the true trend. The updated chart below maps the aggressive bullish surge. However, now we are starting to see the first technical signs indicating a possible pullback since the so-called Trump rally started. Overbought markets like the current situation can continue indefinitely, but now stock prices are converging into a tight range near resistance levels. Also, momentum levels are starting to turn down.

In the chart below the dollar has stalled a bit following remarks by Trump, who once said that the dollar was “too strong,” stoking speculation that his administration might abandon the longstanding “strong dollar” policy. Gold settled higher last week, logging its highest finish in more than three-and-half months, and for a fourth straight week of gains, as the metals complex was boosted by a softer dollar. Treasury bonds recovered last week, beginning after the release of minutes from the Federal Reserve’s latest policy meeting. In the minutes, Fed officials sounded somewhat more reluctant to raise interest rates than in recent remarks from Fed Chairwoman Janet Yellen and a bevy of other Fed officials.

Market Outlook
Jeff Hirsch in the Almanac Trader mentions how tempestuous March markets tend to drive prices up early in the month and batter stocks at month end. Julius Caesar failed to heed the famous warning to “beware the Ides of March” but investors have been served well when they have. Stock prices have a propensity to decline, sometimes rather precipitously, during the latter days of the month. March is the end of the first quarter, which brings with it Triple Witching and an abundance of portfolio maneuvers from The Street. March Triple-Witching Weeks have been quite bullish in recent years, DJIA up 9 of the last 11. But the week after is the exact opposite, DJIA down 19 of the last 29 years—and frequently down sharply for an average drop of 0.5%. The updated graph below displays first quarter performance for the major asset classes. After plunging at years-end you can see that gold has staged a dramatic comeback as a hedge against inflation and uncertainty about global reactions to Trump social-economic policies. The Nasdaq is the next best performer which has been the market leader since early last year. We look for the leaders to perform well to provide evidence of market strength.

The CBOE Volatility Index (VIX) is known as the market’s “fear gauge” because it tracks the expected volatility priced into short-term S&P 500 Index options. When stocks stumble, the uptick in volatility and the demand for index put options tends to drive up the price of options premiums and sends the VIX higher. In the daily chart below the Volatility Index crashes to its lowest levels as the S&P 500 continues making a series of all-time highs.

The American Association of Individual Investors (AAII) Sentiment Survey measures the percentage of individual investors who are bullish, bearish, and neutral on the stock market for the next six months; individuals are polled from the ranks of the AAII membership on a weekly basis. The current survey result is for the week ending 02/22/2017. Optimism among individual investors about the short-term direction of the stock market is at a six-week high, according to the latest AAII Sentiment Survey. The rebound is occurring as neutral sentiment is at a seven-week low. Bullish sentiment, expectations that stock prices will rise over the next six months is at 38.5%. Optimism was last higher on January 11, 2017 (43.6%). The rise puts bullish sentiment even with its historical average of 38.5%. Though bullish sentiment had been below average over the five previous weeks, it was never unusually low. Rather, optimism had merely fluctuated within the lower half of its typical range before rebounding to back to its historical average this week. Neutral sentiment, expectations that stock prices will stay essentially unchanged over the next six months, fell to 29.2%. Neutral sentiment was last lower on January 4, 2017 (28.6%). The historical average is 31.0%. Bearish sentiment, expectations that stock prices will fall over the next six months, is 32.30%, pessimism remains above its historical average of 30.5% for the fifth time in six weeks. This week’s rebound in optimism comes as both large- and small-cap stocks rose to new record highs.

The National Association of Active Investment Managers (NAAIM) Exposure Index represents the average exposure to US Equity markets reported by NAAIM members. The blue bars depict a two-week moving average of the NAAIM managers’ responses. As the name indicates, the NAAIM Exposure Index provides insight into the actual adjustments active risk managers have made to client accounts over the past two weeks. The current survey result is for the week ending 02/22/2017. Fourth-quarter NAAIM exposure index averaged 84.15%. Last week the NAAIM exposure index was 95.89%, and the current week’s exposure is 100.83%. The NAAIM Exposure Index rises to extremely elevated levels as the equity indexes keep continue making all-time highs. Sellers have virtually disappeared as earnings season winds down and it is reasonable to expect NAAIM exposure to remain high.

Trading Strategy
Not all investors are sold on the Trump rally, however with some worrying about valuations or a forthcoming pullback. The potential impact that President Trump could have on the domestic and global economy continues to cause uncertainty or concern among some investors, though encouraging others. Also influencing investor sentiment are earnings, consumer sentiment and the magnitude and timing of future interest rate increases. At such frothy levels a smart move is to consider taking some profits from the recent run up or at least hedging long bullish positions. In the near term we don’t fight the trend which is our friend. Every pullback or pause should be considered an opportunity to load up on shares from your target stock list. In the graph below, cyclical stocks are the leading sectors with the Energy group being the only loser.

Feel free to contact me with questions @ TheOptionPlayer.com

The early stages of Gold bull markets (this one included) are characterized by strong outperformance from the miners. They will lead the metals and turning points and register strong outperformance. We saw that in the early 2000s, late 2008 to early 2009 and we have seen it again over the past year. During the recent rebound, the miners rallied back to the “Trump” resistance while Gold is not yet close to doing so. However, unfortunately for bulls, while Gold is now pushing higher above key levels, the gold stocks are lagging. This new and recent underperformance suggests the gold stocks have made an interim peak and will remain entrenched in a correction or consolidation.
In the daily bar chart below we plot Gold, GDX and GDXJ. Gold closed the week up 1.6% and through resistance at $1250/oz while both GDX and GDXJ closed down over 2.5%. That is a strong negative divergence. Gold also eclipsed its early February high while miners did not. Do note that the miners already reached their early November peak (GDXJ exceeded it) while Gold remains some $40/oz below that peak. Buying in the miners reached an exhaustion point.

Gold, GDX, GDXJ
So if the gold stocks are correcting, how much downside potential is there? Upon first glance, we see 8% downside for GDX and 10% to 12% downside for GDXJ and TheDailyGold junior index. Note that the miners have already corrected roughly 6% to 9%. Keep an eye on GDX $22 because it is a confluence of strong support. It includes the 400-day exponential moving average which has provided support during many bull market corrections. The same can be said for the 350-day exponential moving average for TheDailyGold junior index. The secondary downside target for GDX and GDXJ would be the 400-day moving averages which are currently at $20 and $30 and rising.
 TDG Junior Index, GDXJ, GDX
After a roughly 40% to 50% rebound in only two months it should be no surprise that the mining sector has begun to soften around important resistance. Therefore, the recent underperformance in the shares relative to the metals (Silver included) rather than a surprise is confirmation that a correction in the shares has begun. We expect the metals to follow suit soon enough. Investors and traders are advised to accumulate their favorite names as the mining sector nears our downside targets.
Jordan Roy-Byrne, CMT, MFTA
Jordan@TheDailyGold.com – For professional guidance in riding this new bull market, consider learning more about our premium service including our current favorite junior miners.

The following was published for our subscribers February 16, 2017.
Perspective
In July, the ChartWorks noted technical excesses in the Bond Future. We concluded that action in the US Treasuries was the least distorted and would be the best market to use to determine a major top. For technical analysis, the European market is too dominated by the ECB.
The peak in Treasuries was in July and we noted that the bull market in lower-grade stuff would likely continue. We also noted that the European government bonds would likely turn with US Treasuries. Which they have.
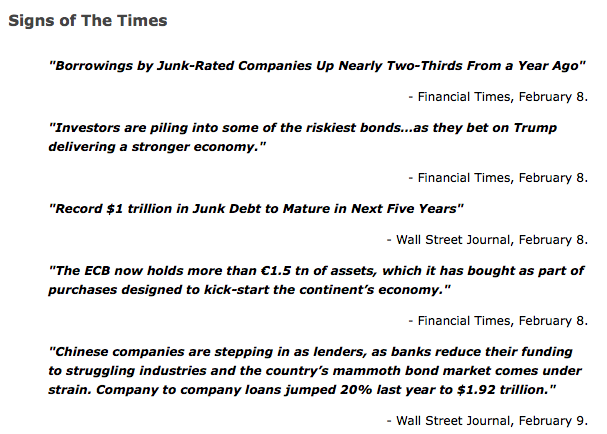
We are now getting technical excesses in Junk.
The headlines above, are recording the anecdotal aspects of a speculative blow-out in lower-grade bonds. It could be global.
The ECB wager that buying €1.5 trillion in assets would “kick-start” the economy rests upon the unproven notion that an economy can be “kick-started”. One might just as well try to kick-start a 747.
This kind of anecdotal record can be followed by panicdotal conditions.
Stock Markets
The American popular uprising now has a dynamic executive whose pro-business utterances have been catnip to equity traders.
We read about some big players on the wrong side of this move.
The rush to buy accomplished technical excesses in December, which we noted could be eased by a sharp correction. Instead, a modest correction has been followed by new highs, which have been driven by two things. Further announcements about reductions in taxation and regulation, which reality could be many months away. Still a positive prospect ahead.
More immediate, has been favourable action in industrial commodities, which has been likely to run into March.
Bond buying programs by central bankers are being thwarted, repeat thwarted, by market forces. Mother Nature has been fully engaged, Mister Margin is monitoring the action.
Over the past year, the combination of firming industrial commodities and narrowing spreads has been the main carrier of the uptrend. And, eventually, could be the agent of change, which we will be watching for.
The action has been likely to be positive into March. This is being confirmed by the Transports, which got out of their funk and are making new highs.
Central bank buying programs continue to look good. For how long?
As in 2015, we are now calling for a big Rounding Top.
Within this, the speculative surge that began in early November has been outstanding. In many ways, including in some series the best in a couple of decades. However, we have been wondering if the right-hand side of topping could extend beyond March. And to use economic jargon, “on the other hand” if crude rolls over, so does the stock market.
The “ABC” correction that the ChartWorks has been working on could start soon.
Credit Markets
The main driver for the banks (BKX) from June until mid-December was the steepening yield curve. From over-extended then, a correction followed to last week when the index found support at the 50-Day. That was at 92.5 and the jump to 97 suggests compulsive buying. Also, as we have been noting, there is the prospect of getting rid of Dodd-Frank, which is called the “Wall Street Reform and Consumer Protection Act”. Designed by congress it is more intrusion than protection.
Some who have studied Dodd-Frank have said it is worse than Obamacare.
As for reforming Wall Street – it has all been done – in 1934. The main intention of the SEC Act was to reform Wall Street so there would never be another financial bubble. One of the sponsors boasted that “It will put a cop at the corner of Wall and Broad Streets”.
Banks have done well despite the flattening curve, indicating that repealing D-F would be good for the sector. This has been almost discounted and the curve, so to speak, is away below the BKX.
Canadian banks such as RY are building outstanding technicals for an important high.
As noted last week, credit spreads as measured by JNK/TLT registered technical excesses in momentum and pattern. This was also registered with the peak of the Treasury action in July. The decline in the TLT has been from 143 to 117, at its worst.
A turn to widening seems imminent and would be a negative for global banks.
JNK accomplished technical excesses and the correction will be underway when the index takes out the 50-Day moving average.
Long Treasuries are poised for another brief bounce.
Commodities
Crude oil survived the huge and potentially negative COT numbers. Our position has been that after a seasonal setback in January, firming could run into March. So far, so good. A quick thrust to an overbought condition would complete the move.
Ross has a chart that says that 12 months after a crash low, an important high can be accomplished. Followed by an intermediate decline.
Base metals (GYX) have been expected to rally out to 332 in March. Severe pressures ended a year ago in January at 235 and the “Rotation” carried it to 283 in October. With the election results, it has rallied to 339, which accomplishes somewhat more than our goal.
It is overbought enough to suggest an intermediate correction.
Grains (GKX) have been acting well. We have had a target of 308, which has been the high-side of the trading range. A couple of weeks ago, we noted that it could be exceeded. At 318 now, there is resistance at 325.
Overall, commodities have had some good gains out of the disaster a year ago and are now eligible for an intermediate setback. The latest surge has been helped by the slide in the dollar, which is preparing for another significant rally.
Stock Leverage vs Spreads

- This measure of “Leverage” got crunched on the crisis into January 2016.
- Spreads have clocked remarkable narrowing.
- “Leverage” has eased a little but is still high.
- Spreads have reached technical excesses and are poised to reverse.
Oooops!

Source: Zero hedge
- Our work in July called for Treasury rates to increase.

Source: Zero hedge
US Drilling Rebounds

Source: Zero hedge
Governing Classes Need Governing

Link to February 17, 2017 Bob Hoye interview on TalkDigitalNetwork.com:
http://www.howestreet.com/2017/02/17/is-a-minor-market-correction-likely/

This holiday-shortened week (last Monday was President’s Day in the US), the price of the dollar fell. In gold, it fell almost half a milligram to 24.75mg, and prices in silver it dropped 30mg, to 1.7 grams of the white monetary metal. Flipped upside down, gold went up 23 notes from the Federal Reserve, and silver appears to go up by 41 cents.
Below, we will show the only true picture of the gold and silver supply and demand fundamentals. But first, the price and ratio charts.
The Prices of Gold and Silver
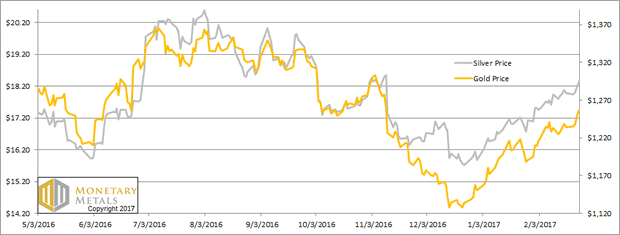
Next, this is a graph of the gold price measured in silver, otherwise known as the gold to silver ratio. It moved sideways again this week, which would normally be odd for a time when the prices of the metals are rising.
The Ratio of the Gold Price to the Silver Price

For each metal, we will look at a graph of the basis and cobasis overlaid with the price of the dollar in terms of the respective metal. It will make it easier to provide brief commentary. The dollar will be represented in green, the basis in blue and cobasis in red.
Here is the gold graph.
The Gold Basis and Cobasis and the Dollar Price

For a very long time, we would post graphs that looked almost the same. Oh, the specifics of month, price, and basis would be different. But they had a certain sameness. The price of the dollar (i.e. inverse of the price of gold, in dollar terms) would move along with the cobasis (i.e. scarcity of gold). So as the dollar would rise (i.e. the price of gold would fall), the scarcity would rise. And vice versa. This means changes in price were due to changes in behavior by speculators.
And now we have a clear picture of … the opposite. The dollar has been falling since mid-December. And for that same time, the cobasis (scarcity of gold) has been rising.
Yes, gold has been getting scarcer as it becomes pricier.
How could this be possible? Doesn’t the law of supply and demand work for gold? You know, the standard “X” graph from Econ. 101?
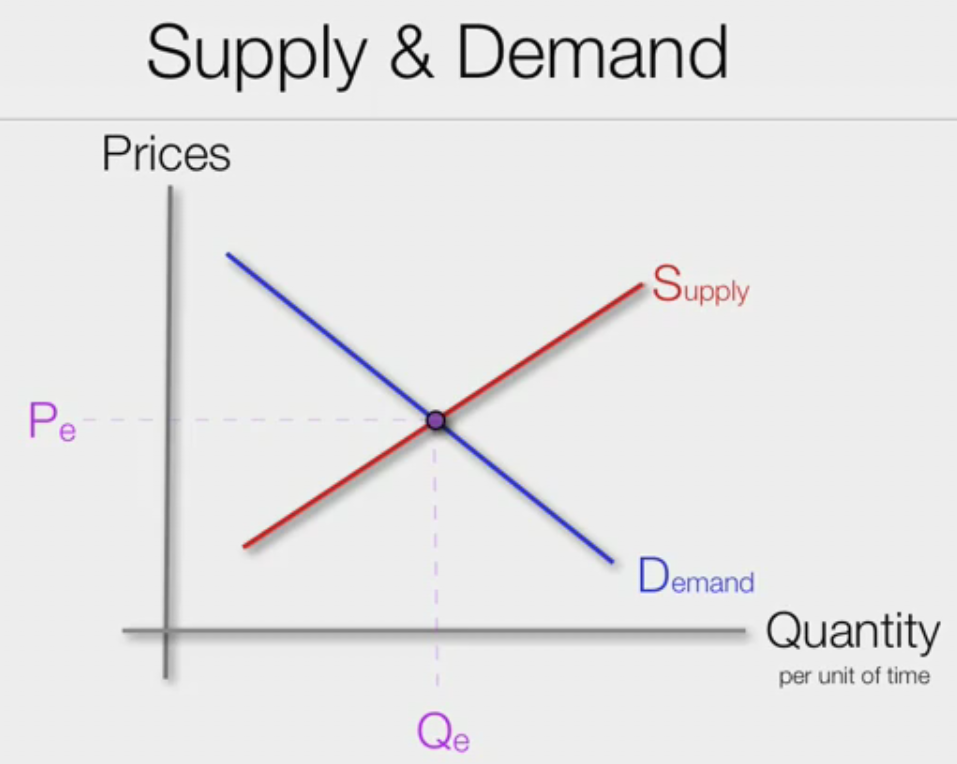
Gold has several unique properties. One is that it is not purchased for consumption, but for monetary reserves or jewelry (which in most of the world is monetary reserves). Contrast that to copper which is purchased by plumbing manufacturers to make pipe. It’s a competitive market, and if the price of copper plumbing goes up too much then home builders will switch to plastic. Demand drops as price rises. Also, the marginal copper mine will increase production. Supply rises as price rises. It is self-correcting.
Gold, not being bought to consume, does not have a limit to demand as price rises. If anything a rising price (i.e. a falling currency) signals to people that holding gold is a good thing. They were wise to get out of their falling paper currency, and should consider buying more gold.
Also, virtually all of the gold ever mined in human history is still in human hands. All of this gold is potential supply, at the right price and under the right conditions. Even if gold mining worked like copper mining, and miners could just produce more, changes in mine production at the margin are not material to the overall gold supply. By official estimates, the total inventory of gold would take over 70 years to be produced at current mine production rates (and we believe this is a low estimate).
Readers may object that this question is a bit unfair, as any commodity can experience rising tightness and that will accompany its rising price for a while until the market can correct itself. That is true, but what we are looking at in gold is not that at all. When the market corrects itself — which we think is very likely, we do not see Armageddon just yet — it will not be because gold miners have cranked up their outputs, nor because gold users have substituted another metal. There is no substitute for monetary reservation, particularly as paper currencies are in the terminal stages of failure.
Our calculated fundamental price is now up to almost $1,400.
Now let’s look at silver.
The Silver Basis and Cobasis and the Dollar Price

The trend of falling dollar (i.e. rising price of silver) and rising cobasis (scarcity) is here in silver, too, but it’s weaker.
Silver does not quite have the same stocks to flows ratio as gold, but it has far and away a higher ratio than copper or any ordinary commodity. That is why silver is the other monetary metal.
The fundamental price of silver is now up to about $18.70. While this is over the market price of the metal, it’s not nearly so much above as gold.
This is why we calculate a fundamental on the gold-silver ratio over 74.


-
I know Mike is a very solid investor and respect his opinions very much. So if he says pay attention to this or that - I will.
~ Dale G.
-
I've started managing my own investments so view Michael's site as a one-stop shop from which to get information and perspectives.
~ Dave E.
-
Michael offers easy reading, honest, common sense information that anyone can use in a practical manner.
~ der_al.
-
A sane voice in a scrambled investment world.
~ Ed R.
Inside Edge Pro Contributors

Greg Weldon

Josef Schachter

Tyler Bollhorn

Ryan Irvine

Paul Beattie

Martin Straith

Patrick Ceresna

Mark Leibovit

James Thorne

Victor Adair